Bingo Blitz
Game
Documents about Bingo Blitz
Playtika Holding Corp. FY2025 Q1 Prepared Remarks
Playtika Holding Corp.’s first quarter of 2025 financial results demonstrate a period of record-breaking revenue alongside strategic portfolio transitions.
- Playtika achieved a record quarterly revenue of $706 million in Q1 2025, representing an 8.4% year-over-year increase.
- Slotomania revenue declined 17.4% year-over-year to $111.8 million, with management expecting continued weakness in the coming quarters despite efforts to stabilize the game economy.
- Disney Solitaire launched globally on April 17, 2025, with management projecting it will reach a $100 million revenue run-rate faster than previous titles Dice Dreams and Domino Dreams.
Playtika Holding Corp. Q1 2025 Financial Results
Playtika Holding Corp. reported record-breaking financial results for the first quarter of 2025, ending March 31, 2025.
- Playtika reported record Q1 2025 revenue of $706.0 million, an 8.4% increase year-over-year, driven by its existing portfolio and the acquisition of SuperPlay.
- GAAP net income fell 42.3% year-over-year to $30.6 million, while Adjusted EBITDA declined 9.9% to $167.3 million.
- Average Daily Paying Users (DPUs) grew significantly by 26.2% year-over-year to 390,000, with average payer conversion rising to 4.3%.
Playtika Holding Corp. Q3 2024 Prepared Remarks
Playtika Holding Corp.’s third quarter 2024 earnings remarks outline a strategic focus on portfolio expansion through mergers and acquisitions, specifically highlighting the pending acquisition of SuperPlay.
- Playtika is acquiring SuperPlay to bolster its portfolio, utilizing a deal structure that includes an upfront payment and performance-based earn-outs to mitigate risk.
- Q3 2024 revenue was $620.8 million, down 1.5% year-over-year, while Credit Adjusted EBITDA reached $197.2 million, a 4.1% year-over-year decline.
- Slotomania performance fell short of expectations with revenue dropping 9.3% year-over-year, prompting a strategic pivot toward product feature updates and IGT-licensed IP like 'Cleopatra II'.
Playtika Holding Corp. Q3 2024 Financial Results
Playtika Holding Corp.’s third-quarter 2024 financial results reflect a period of strategic transition characterized by steady performance in direct-to-consumer (DTC) channels and the pursuit of inorganic growth.
- Playtika reported Q3 2024 revenue of $620.8 million, representing a 1.0% sequential decrease and a 1.5% year-over-year decline.
- The company is moving forward with the acquisition of SuperPlay, which is expected to close in Q4 2024 as part of its growth strategy.
- Direct-to-Consumer (DTC) platform revenue reached $174.4 million, showing growth of 0.4% sequentially and 8.3% year-over-year.
Playtika Holding Corp. Q2 2024 Financial Results
Playtika Holding Corp.’s financial results for the second quarter of 2024 reflect a period of mixed performance characterized by declining overall revenue alongside improved net income and growth in direct-to-consumer (DTC) channels.
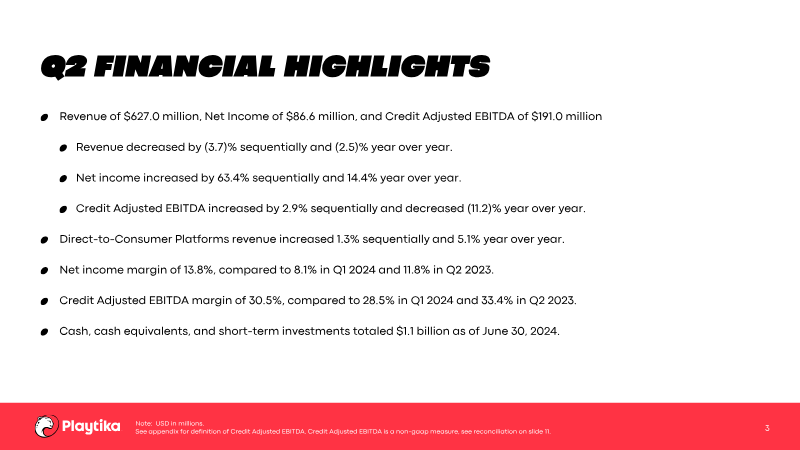
- Playtika reported Q2 2024 revenue of $627.0 million, a 3.7% sequential decrease and a 2.5% year-over-year decline.
- Net income rose to $86.6 million, representing a 63.4% increase sequentially and 14.4% growth year-over-year.
- Direct-to-Consumer (DTC) platform revenue grew to $173.7 million, up 1.3% sequentially and 5.1% year-over-year.
Playtika Holding Corp. Second Quarter 2024 Results
Playtika Holding Corp.’s second quarter 2024 results reflect a period of mixed financial performance characterized by a focus on operational efficiency and direct-to-consumer growth amidst a challenging macroeconomic and geopolitical environment.
- Playtika reported Q2 2024 revenue of $627.0 million, a 2.5% year-over-year decline, while net income rose 14.4% year-over-year to $86.6 million.
- Direct-to-consumer platforms grew revenue by 5.1% year-over-year, serving as a strategic hedge against high third-party platform fees.
- Credit Adjusted EBITDA reached $191.0 million, representing a 2.9% sequential increase but an 11.2% decline compared to Q2 2023.
Playtika Holding Corp. First Quarter 2024 Results
Playtika Holding Corp.’s first-quarter 2024 results highlight a period of mixed financial performance characterized by modest sequential growth alongside year-over-year declines.
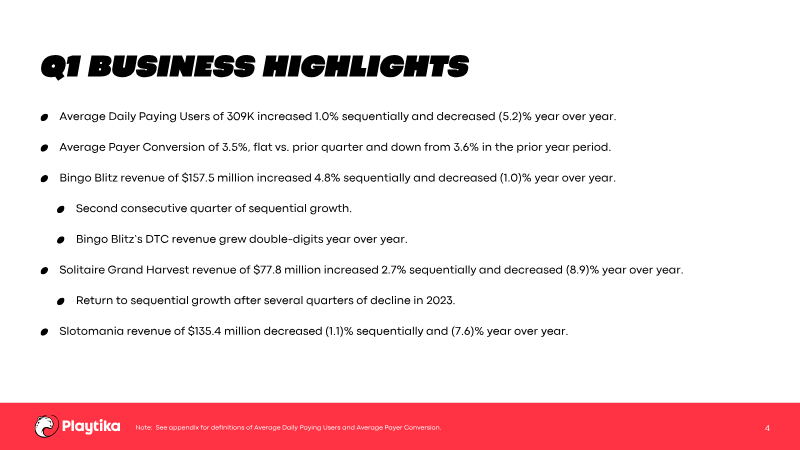
- Playtika reported Q1 2024 revenue of $651.2 million, reflecting a 2.1% sequential increase but a 0.8% decline compared to the same period in 2023.
- The Direct-to-Consumer (DTC) platform remains a key growth driver, with revenue increasing 6.1% sequentially and 13.2% year-over-year.
- Net income for the quarter was $53.0 million, representing a 42.1% sequential improvement but a 37.0% decrease year-over-year.
Playtika Holding Corp. Q3 2023 Financial Results
Playtika Holding Corp.’s third-quarter 2023 financial results reflect a period of operational adjustment characterized by modest revenue contraction and strategic expansion through acquisitions.
- Playtika reported Q3 2023 revenue of $630.1 million, a 2.7% decrease year-over-year, and net income of $37.9 million, representing a 44.4% decline compared to the same period in 2022.
- The company revised its full-year 2023 financial outlook, projecting annual revenue between $2.550 billion and $2.565 billion with Credit Adjusted EBITDA expected to range from $825 million to $832 million.
- Credit Adjusted EBITDA for Q3 2023 was $205.6 million, a 1.0% increase year-over-year, despite a 4.4% sequential decline.
Playtika Holding Corp. Third Quarter 2023 Results
Playtika Holding Corp.’s third quarter 2023 financial results reflect a period of moderate contraction in revenue and net income, alongside a strategic focus on operational efficiency and in-house game development.
- Playtika reported Q3 2023 revenue of $630.1 million, a 2.7% year-over-year decline, while net income dropped 44.4% to $37.9 million.
- Credit Adjusted EBITDA rose 1.0% year-over-year to $205.6 million, maintaining a 32.6% margin despite broader revenue contraction.
- Direct-to-consumer revenue grew 6.8% year-over-year as the company continues to prioritize these platforms to bypass 30% third-party app store commission fees.
Playtika Holding Corp. Q2 2023 Prepared Remarks
Playtika Holding Corp.’s second quarter 2023 financial results reflect a strategic pivot toward operational efficiency and the integration of artificial intelligence to navigate a challenging mobile gaming market.
- Playtika reported Q2 2023 revenue of $642.8 million, a 2.5% year-over-year decline, while Credit Adjusted EBITDA grew 6.7% to $215.0 million with a 33.4% margin.
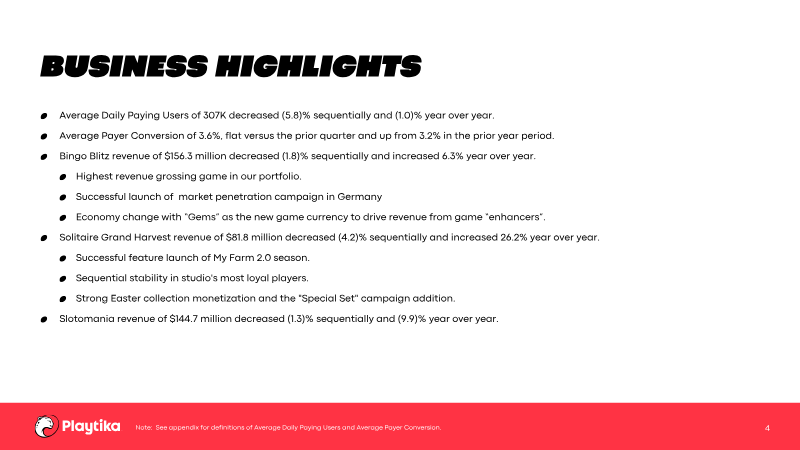
- The company's casual gaming portfolio reached a record 56.8% of total revenue, driven by year-over-year growth in Bingo Blitz (6.3%), Solitaire Grand Harvest (26.2%), and June’s Journey.
- Direct-to-Consumer platform revenue hit a record $165.3 million, representing 25.7% of total company revenue and reflecting a 7.6% year-over-year increase.
Playtika Holding Corp. Q2 2023 Financial Results
Playtika Holding Corp. reported its financial results for the second quarter ending June 30, 2023, highlighting a period of mixed performance characterized by slight revenue contraction alongside significant growth in direct-to-consumer (DTC) platforms and improved net income.
- Playtika reported Q2 2023 total revenue of $642.8 million, a 2.5% decrease year-over-year and a 2.0% decrease sequentially.
- Direct-to-consumer (DTC) platform revenue reached $165.3 million, marking a 7.6% year-over-year and 9.1% sequential increase.
- Net income for the quarter was $75.7 million, representing a 108% increase year-over-year despite a 10% sequential decline.
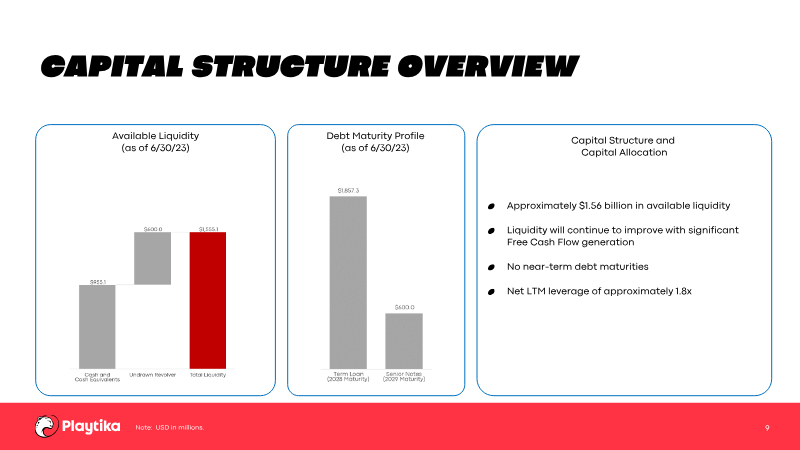
Playtika Holding Corp. Second Quarter 2023 Results
Playtika Holding Corp.’s second quarter 2023 results reflect a period of strategic stabilization and operational focus within the mobile gaming sector.
- Playtika reported Q2 2023 revenue of $642.8 million, a 2.5% year-over-year decrease, while net income surged 108% to $75.7 million.
- Credit Adjusted EBITDA rose 6.7% year-over-year to $215.0 million, achieving a 33.4% margin.
- Direct-to-Consumer platforms grew 9.1% sequentially, offering a more favorable cost structure than third-party distribution channels.