Bingo Blitz
Game
Documents about Bingo Blitz
Playtika Holding Corp. Q1 2026 Earnings Results
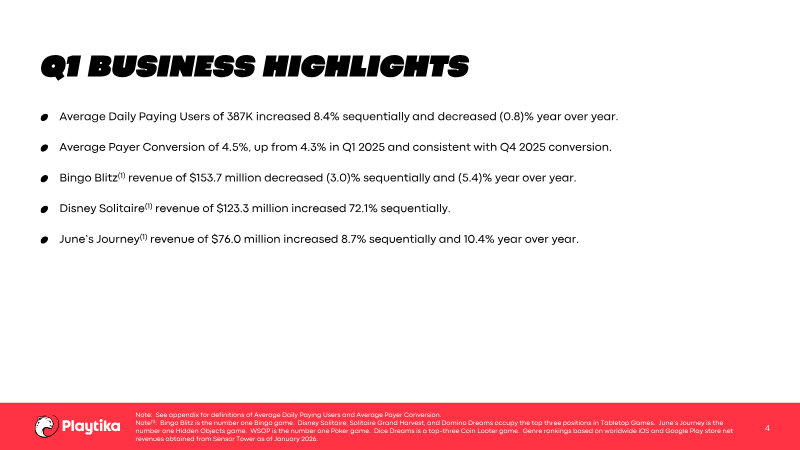
Playtika Holding Corp.’s Q1 2026 earnings results reflect a period of mixed financial performance characterized by revenue growth alongside a net loss.
- Playtika reported Q1 2026 revenue of $744.7 million, a 5.5% year-over-year increase, but recorded a net loss of $57.5 million.
- Adjusted EBITDA fell 37.8% sequentially to $125.2 million, reflecting a significant decline in adjusted profitability metrics.
- Direct-to-consumer (DTC) platforms achieved record growth of 16.7% sequentially and 62.8% year-over-year as the company attempts to reduce reliance on third-party platform fees.
Playtika Holding Corp. Third Quarter 2025 Results
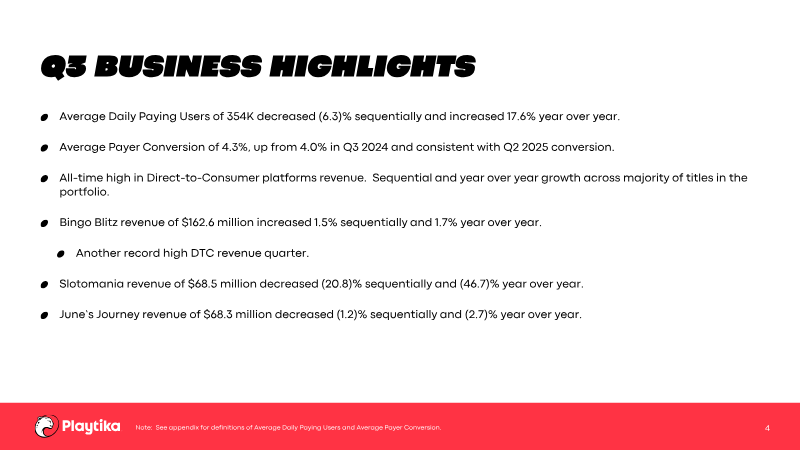
Playtika Holding Corp.’s third quarter 2025 financial results demonstrate a period of strategic growth and operational efficiency, highlighted by record-setting performance in its Direct-to-Consumer (DTC) platforms.
- Playtika reported Q3 2025 revenue of $674.6 million, an 8.7% year-over-year increase, alongside an Adjusted EBITDA of $217.5 million representing a 30.2% sequential growth.
- Direct-to-Consumer (DTC) platform revenue reached an all-time high, growing 20% year-over-year as the company shifts toward higher-margin distribution channels.
- The acquisition of SuperPlay is a central growth pillar, with initial trends indicating the company is tracking toward 60% year-one revenue growth for the asset.
Playtika Holding Corp. First Quarter 2025 Results
Playtika Holding Corp.’s first quarter 2025 financial results demonstrate a period of revenue growth alongside shifts in profitability metrics.
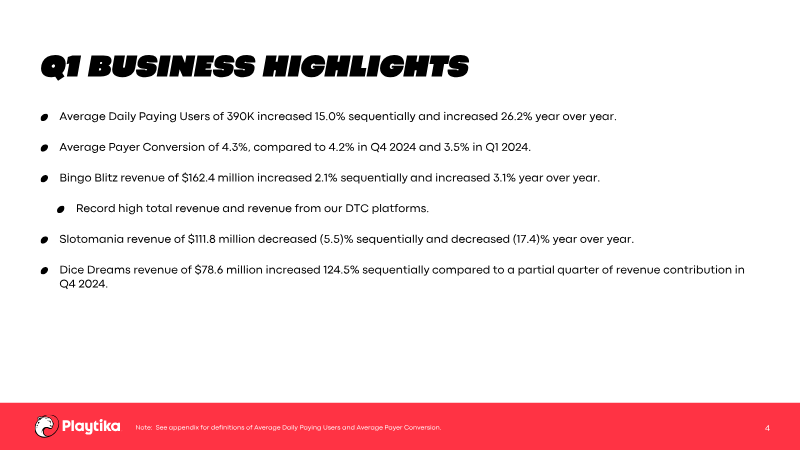
- Playtika reported Q1 2025 revenue of $706.0 million, an 8.4% year-over-year increase, though GAAP net income fell 42.3% to $30.6 million.
- Adjusted EBITDA declined 9.9% year-over-year to $167.3 million, resulting in a 23.7% margin for the quarter.
- User monetization metrics improved significantly, with Average Daily Paying Users rising 26.2% year-over-year to 390,000 and Payer Conversion increasing to 4.3%.
Playtika Holding Corp. Second Quarter 2024 Results
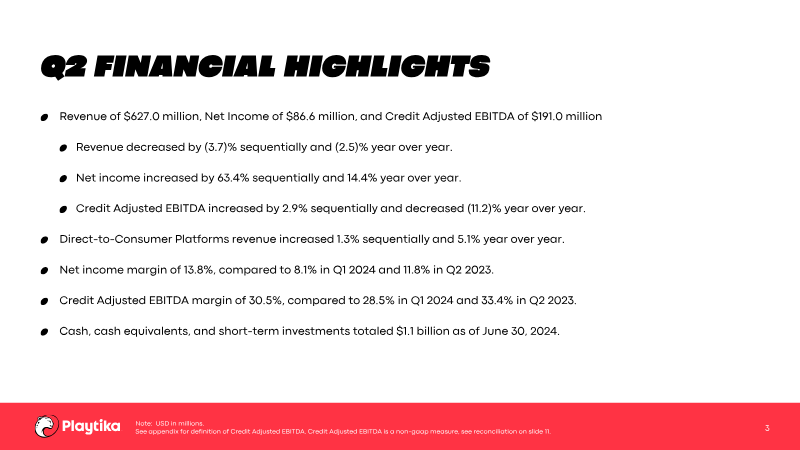
Playtika Holding Corp.’s second quarter 2024 results reflect a period of mixed financial performance characterized by a focus on operational efficiency and direct-to-consumer growth amidst a challenging macroeconomic and geopolitical environment.
- Playtika reported Q2 2024 revenue of $627.0 million, a 2.5% year-over-year decline, while net income rose 14.4% year-over-year to $86.6 million.
- Direct-to-consumer platforms grew revenue by 5.1% year-over-year, serving as a strategic hedge against high third-party platform fees.
- Credit Adjusted EBITDA reached $191.0 million, representing a 2.9% sequential increase but an 11.2% decline compared to Q2 2023.
Playtika Holding Corp. First Quarter 2024 Results
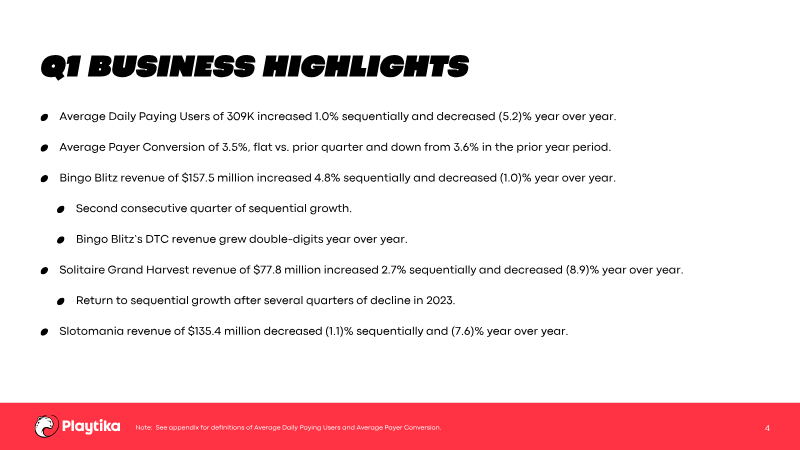
Playtika Holding Corp.’s first-quarter 2024 results highlight a period of mixed financial performance characterized by modest sequential growth alongside year-over-year declines.
- Playtika reported Q1 2024 revenue of $651.2 million, reflecting a 2.1% sequential increase but a 0.8% decline compared to the same period in 2023.
- The Direct-to-Consumer (DTC) platform remains a key growth driver, with revenue increasing 6.1% sequentially and 13.2% year-over-year.
- Net income for the quarter was $53.0 million, representing a 42.1% sequential improvement but a 37.0% decrease year-over-year.
Playtika Holding Corp. Third Quarter 2023 Results
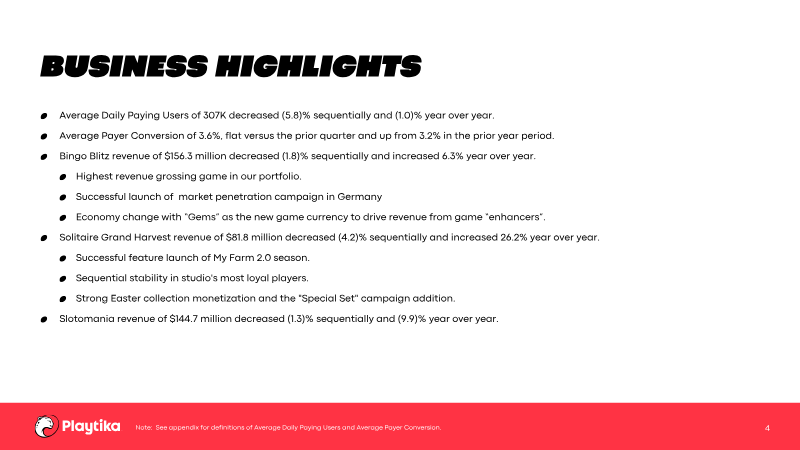
Playtika Holding Corp.’s third quarter 2023 financial results reflect a period of moderate contraction in revenue and net income, alongside a strategic focus on operational efficiency and in-house game development.
- Playtika reported Q3 2023 revenue of $630.1 million, a 2.7% year-over-year decline, while net income dropped 44.4% to $37.9 million.
- Credit Adjusted EBITDA rose 1.0% year-over-year to $205.6 million, maintaining a 32.6% margin despite broader revenue contraction.
- Direct-to-consumer revenue grew 6.8% year-over-year as the company continues to prioritize these platforms to bypass 30% third-party app store commission fees.
Playtika Holding Corp. Second Quarter 2023 Results
Playtika Holding Corp.’s second quarter 2023 results reflect a period of strategic stabilization and operational focus within the mobile gaming sector.
- Playtika reported Q2 2023 revenue of $642.8 million, a 2.5% year-over-year decrease, while net income surged 108% to $75.7 million.
- Credit Adjusted EBITDA rose 6.7% year-over-year to $215.0 million, achieving a 33.4% margin.
- Direct-to-Consumer platforms grew 9.1% sequentially, offering a more favorable cost structure than third-party distribution channels.
Playtika Form 10-K: FY2020
Playtika operates as a prominent developer of free-to-play mobile games, utilizing a proprietary data-driven platform to manage user acquisition, retention, and monetization.
- Playtika held $520.1 million in cash and cash equivalents as of December 31, 2020, a significant increase from $266.8 million at the end of 2019.
- The company settled the Sean Wilson class action litigation for $38.0 million, with final court approval granted in February 2021.
- International operations remain a core revenue driver, with non-U.S. sales accounting for 29.6% of total revenue in 2020 and 30.3% in 2019.
Playtika Holding Corp. Second Quarter 2026 Results
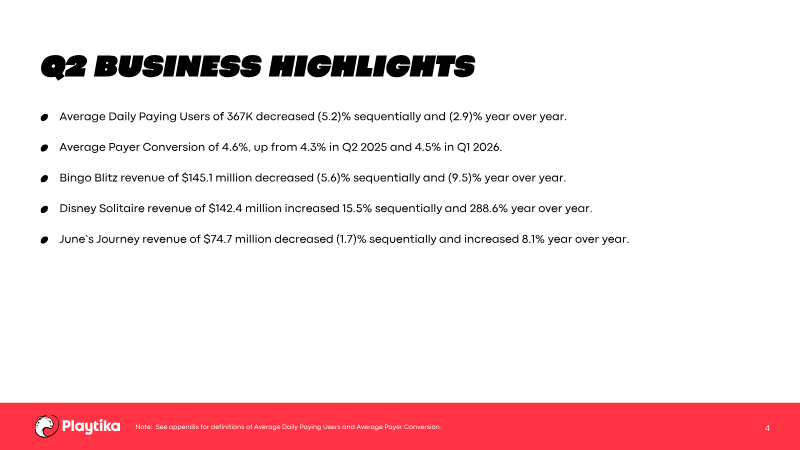
Playtika Holding Corp.’s second quarter 2026 financial results demonstrate a return to profitability and improved operational efficiency, despite a slight sequential decline in total revenue.
- Playtika returned to profitability in Q2 2026 with $48.0 million in net income, recovering from a net loss in the previous quarter.
- Total revenue reached $731.1 million, marking a 5.0% year-over-year increase despite a 1.8% sequential decline.
- Adjusted EBITDA grew 23.4% year-over-year to $206.1 million, resulting in an improved profit margin of 28.2%.


Playtika Holding Corp. First Quarter 2023 Results
Playtika Holding Corp. reported first-quarter 2023 results with total revenue of $656.2 million, reflecting a 4.0% sequential rise but a 3.1% decline YoY, driven by modest growth on direct-to-consumer platforms and a 12.1% YoY drop in Slotomania revenue.
- Playtika reported Q1 2023 revenue of $656.2 million, representing a 3.1% decline year-over-year despite a 4.0% sequential increase.
- Credit Adjusted EBITDA grew 12.8% year-over-year to $222.7 million, achieving a margin of 33.9%.
- Revenue performance was mixed across titles: Bingo Blitz grew 13.0% and Solitaire Grand Harvest grew 29.0% year-over-year, while Slotomania revenue declined 12.1%.


Playtika Holding Corp.: Fourth Quarter and Fiscal Year 2022 Results
Playtika Holding Corp. reported fiscal-year 2022 results that demonstrate modest revenue growth amid a challenging competitive landscape.
- Playtika reported FY2022 revenue of $2,615.5 million, a modest 1.3% year-over-year increase, while net income declined 10.8% to $275.3 million due to rising operating costs.
- Both Credit-Adjusted EBITDA ($805.1 million) and Retention Plan-Adjusted EBITDA ($919.0 million) fell short of the company's guidance ranges for the fiscal year.
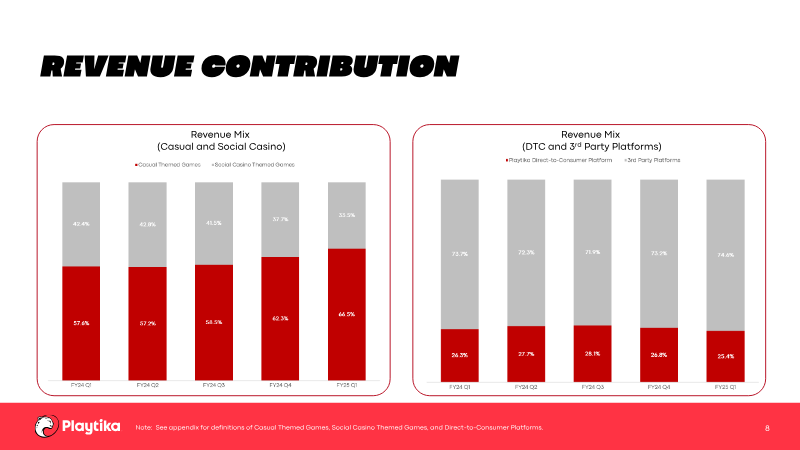
- Direct-to-Consumer platform revenue grew 14.7% year-over-year, and Casual Themed Games increased their share of total revenue to 53.8%, up from 48.7% in 2021.


Playtika Holding Corp. Third Quarter 2024 Results
Playtika Holding Corp. reported third-quarter 2024 results for the period ended September 30, 2024, showing a revenue of $620.8 million, down 1.0% sequentially and 1.5% year-over-year.
- Playtika agreed to acquire SuperPlay for an upfront $700 million, with up to $1.25 billion in contingent payments tied to performance targets over the next three years.
- Q3 2024 revenue reached $620.8 million, representing a 1.5% year-over-year decline, while net income fell 54.6% sequentially to $39.3 million.
- Direct-to-consumer platforms grew 8.3% year-over-year to $469.1 million, contrasting with a 4.8% decline in third-party platform revenue.