VideoDeconstructor of Fun
The $12B+ Mobile Ad Market: Sensor Tower's First-Ever Deep Dive
3 Aug 202633 min video
Transcript
[music]
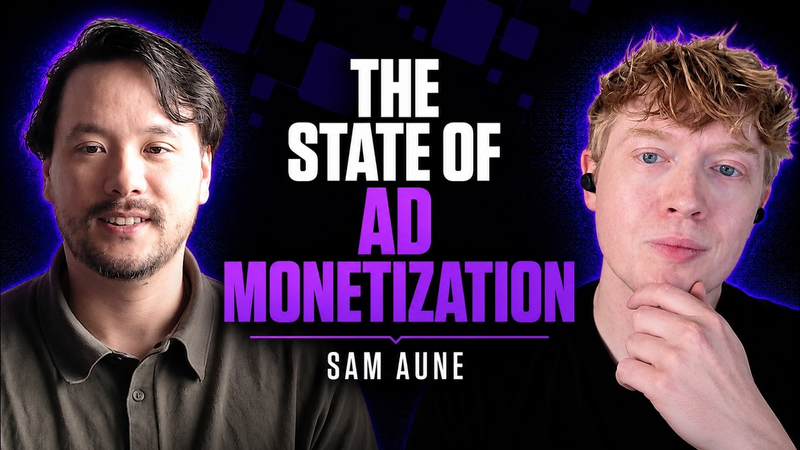
It's taken until 2026 to get an ad monetization report from Sensor Tower. And there's a lot to unpack. There's There's market sizing, network winners and losers, maybe even network take rates with the games like what does and doesn't scale in hybrid casual. Sam, your lead gaming insights analyst at Sensor Tower. So, tell me what took so long?
Yeah, it's uh it's a good question. So, we've covered a lot of things over the years and this is the first time we're coming out with ad monetization estimates. And I think to explain why why we're doing this now, it makes sense to take a second and and understand why we cover what we have covered in the past. So, for example, for mobile IAP and downloads, you're only watching two doors, right? The App Store and Google Play. Couple of other stores out there, but those are the two main ones that we can watch and understand most of the market, right? Almost every purchase goes through one of these and if you track them, there's a bunch bunch of inputs. There's
rankings, filings. First, we have a first-party panel. And based on those, we've got a real starting point, you know, for for estimates. Ads don't quite work like that, right? There's money split across a dozen networks. Each one reports one big revenue number. They never really break it out by app. If you're a publisher, you can see your own mediation dashboard, but nobody can see across networks. Networks don't really have any incentive to publish per app data. And then you've got to model all CPMs on top. So, that's kind of why this side of the business stayed opaque for so long. What changed is pretty simple. Our panel has gotten quite a bit bigger over the years and now we can support estimates that we just couldn't before. And also ads kind of just got everywhere. More than half of the top 1,000 games by IAP revenue also run ads. Uh 93% of the top ads by download growth in 2025 did as well. So, we're just seeing way more ads in our panel than we used to and that means we can estimate things like ads per minute and therefore
also start estimating things like ad revenue with some confidence.
How long was this in the oven before it ships?
Quite a while, I would say. I think this is some a question that, you know, people asked for this sort of revenue or this sort of data for a long time. And our answer for a long time was not yet. So, we we definitely kept our eye on on whether we can do this for for quite a while. As for an exact number, you'd have to ask someone on our product or data science teams. But yeah, it's it's something that we've definitely been thinking about for a long time and very excited to have out now.
All right. Well, without further ado, the big number, 12 billion in ad revenue in 2025. So, you talked about your your panel getting bigger and and more robust. How much of that 12 billion comes from observed data and and how much was was modeled?
Yeah, so I would say the number next to it, the 2.4 trillion ad impressions, that part is the volume is more observed. And the price is is definitely
more of a modeled part of the equation for us. The impressions come from real measurement in our first-party panel. We debias it, scale it up, smooth the gaps, and that's the part we really actually see. The dollar figure on top is modeled. We don't see money moving between networks and publishers. We just take the impressions we observe and we apply CPM benchmarks, these third-party benchmarks that are refined with our own winning bid data. So, an estimate, but it is anchored to observed volume.
All right. So, the the impressions are you you'd hang your hat on. The CPM 12 divided by 2.4 is is that $5 CPM on average? More estimated, less observed.
The exact revenue there or ratio there is a bit more modeled. We we have been taking a lot of input from from clients and from from other people who are expert in this part. And we're continuing to this is still an early data set for us. But yeah, that's exactly exactly how it works.
It's still it's very interesting and there's there's a lot of little details here I'm curious about. So you included
19 countries. Were those the 19 countries measured by like the top 19 by revenue or is it that there were 19 where it was easy to model? Like how did you decide what to include country wise?
These are just the 19 countries that we felt comfortable having estimates for that we feel like our panel is is good enough and covers ads well enough to to provide here. The good news is that I I think we do a pretty good job of which countries we choose chose to chose to cover in this first pass. There's some you know, there's T1 countries like US, Japan, South Korea, Germany, the UK. And also there's a decent amount of markets where ads are more primary and less IAPs are a big thinner. So markets like Brazil and India are also included.
It's a challenging thing cuz everything is so unique by the geo and also by the the network. It feels like you guys are explorers crossing the ocean looking for new found land. And then there were eight ad networks tracked or is it more
than that?
So we have a ninth category and that category is called other where everything else goes into at the moment. So I think we do track more than eight but yeah, some of networks aren't we don't have maybe enough volume to really give confident estimates at at this time is is my suspicion.
I suppose my last question here is how should we look at this 12 billion number? Now we have you know, 12 billion is from most but not every country, like most but not every network. Is this 12 billion number should we store it in our heads as like a an estimate accurate number or should we look at it like a floor? Like help me kind of square square that.
I think the floor analogy works best where this is you know, we we clearly we don't cover every single app on the market. We don't cover every single country in the market. So, you can do some comparisons possibly between this and, you know, using the same 19 countries to get some some numbers. But, yeah, this is I would say a floor and
you can maybe use that to get an idea of idea of of how how big the ad market is.
I see. When you think about ad revenue and you get this number out the first time, the first thing I want to do is compare it to something. And your state of mobile report last year put IAP at 81.8 billion against that 12 billion in ads. I mean, that that looks like seven to one. But, the IAP in that was gross, right?
That's correct.
So, that's before the stores 30%. So, it's kind of like comparing someone's salary to their take-home pay. After the 30% fee, it's about 60 billion compared to 12. So, does that make IAA like ad monetized games about 17% of game revenue?
Yeah, it's a sharp way to put together some of our our data points. Um there's a few caveats, I would say. First, of course, this is mobile gaming. PC, console not included. But, second, as I mentioned before, ads data right now covers 19 countries and the figure in
the state of mobile report is covering much more countries than we do for ad monetization at the moment. If you zoom into those same countries, however, you are looking at about 40 billion in IAP after store fees, which would put ads at about at about 23% of the combined IAP and and ad revenue. So, even a bit higher than what you're saying. Of course, as I mentioned before, country mix does matter a lot. A lot of the countries that we chose to cover, like Brazil and India, where ads do more of the work, probably are inflating this number to a degree in the the set of countries that we're choosing to to cover. And that's probably nudging this number up. Lastly, I I there's probably another slice of the pie to think about, D2C. And it's fun fun fact we actually just launched the US web store estimates on on Sensor Tower if people are interested in that on June 21st. And just a first look our early estimate our H1 2026 US market level figure for D2C is 2.3 billion. If you put that together with our ad estimates and our
IAP estimates, we get roughly a 73 14 13 split in the US for IAP web store and ads.
I'm curious before you saw all this data globally speaking, you know, what number did you expect?
If you had asked me before, I probably would have said maybe a bit higher globally. Uh of course what I just said was a US number the 13%. So maybe I yeah, 15 20% is maybe what I would have thought possibly, but I I would not say I'm an expert in ad monetization. This is uh the first time I'm getting to look at this kind of data and really digging in trying to understand the area a bit more.
I was on the opposite opposite end of it. I think about six or seven months ago, I publicly estimated about 25%. So I guess I was a little high.
I don't know. Maybe maybe you're closer [laughter] Yeah, uh uh yeah, maybe we'll see.
We'll see.
Yeah, right. Well, I'm sure our our estimates will continue getting better over time and yeah, we'll see what happens.
Okay. Well, let's take a look. I wanted to talk about where that revenue is coming from. And I thought slide 17 was really
interesting. The first thing that sticks out to me here is that wow, 5 years ago it really did feel like only games bought ads in games, but now you're telling us over 30% of impressions in every genre of goes to brand and it's essentially it's near as makes no difference half in sports. What's going on?
I think it's just that there's a lot of non-gaming demand coming through and reaching their audience through gaming at the moment. The majority is definitely still going to be games coming through and buying your placement there. But there's some very aggressive performance buyers like Temu and Shein and e-commerce, TikTok and Facebook on social, AI apps like Poly Buzz, Rocket Money, ChatGPT that are buying a lot of volume as well. And that's not the classic brand wave of CPG, auto, and finance. It's more looking like consumer apps spending hard on UA. And I would say that sports probably over indexes because it pulls a
mainstream non-gamer audience, which is who a lot of these advertisers are looking for.
You said something really interesting. What do you mean by brands in this slide? Is brands like a literal brand ad, or is it anything other than gaming? What is it?
Yes, so that was maybe an imprecise word choice on our part. It really just means non-gaming here. So maybe in hindsight we should have just said non-gaming. I guess it does say non-gaming there, but it says brands first.
What about revenue? 30 to 50% of impressions is is really interesting. But how much of that 12 billion in revenue is coming from non-gaming?
So for revenue, roughly 72% is still gaming advertisers. That makes about 28% non-gaming. As I said, when you when you show an ad in your game, it is usually another game buying that slot, but non-gaming money is real. And you know, as we are showing in this chart here, it's not evenly spread. Uh shopping over indexes in puzzle, arcade, and tabletop. Entertainment shows up
more in simulation, lifestyle, and action, and sports. The top category, non-gaming category, is finance. So non-gaming demand, meaningful. Not on top of gaming yet. And the mix does depend a lot on who's actually playing the game.
So top non-gaming in sports is finance. It it is Kahlúa? Finance? You you've
correctly guessed how we classify our apps correct, yeah.
Okay, I see. I see. Yeah, in finance, yes. Okay, The prediction markets are are not gambling, they're finance apps.
I would have to double-check. I'm I'm more on the gaming side of how we classify
No, no, it's it's
Oh, it's correct. Yeah.
Okay. It also is interesting. So, I published on LinkedIn, I think a year ago, that for Wildcard Games, my business, our number one advertiser by impressions, was Walmart.
Walmart?
Because we show cuz we show banner ads in our games. And Walmart loves banner ads. And so that's what makes me wonder, well, if the volume is high, CPM is a little lower, I wonder if it's banner ads.
Yeah, I guess purely speaking not based on any data, but it kind of makes sense that gaming ads would want something where they can show the gameplay, like a video or a playable or something, whereas you know, something like Walmart or someone with a strong ad, they just need to show you their brand to and then that's that's all they're really looking for. They don't need a video possibly. Uh would be my my my guess as to why
And then, my last question, these non-gaming categories, are these only for app install ads or are these for web and brands, too?
I believe this is for app install ads. Yeah, this is on our Sensor Tower side. We have another data set called Pathmatics, which would cover all sorts of different ads that that go to, you know, to the web or to wherever else.
All right. Now Now the spicy stuff.
All right.
Looking at your slide 14,
you have AppLovin and Google combined at 65% market share in mobile advertising and climbing. But but I looked at your interactive charts here, what I noticed was is Google flat and is AppLovin the one climbing?
So, AppLovin absolutely is the the clear growth story. From 30% in December, according to our estimates, to 36% in May. But I I would note that Google isn't completely flat in our numbers. We see more modest growth, 27% to 29% over that same window. And so yeah, as as you mentioned, together almost two-thirds of the market um Apple have been clearly up more. Um but arguably both are up. I I would I would stick to that to a degree.
Yeah, I mean this is a fantastic graph by the way. You can just scroll around and see who's winning and losing in real time. But if Apple have been gaining and AdMob Google is either gaining or kind of
flat-ish, who's losing?
Uh well, yeah, you can probably uh move your cursor up a little bit and see that some of the smaller networks are definitely getting chipped away at to a degree. I don't want to call anyone out by name particularly, but yeah, you can
All right, feel free.
[laughter]
Yeah, so you have Supersonic, which is IronSource, being shut down. The most interesting thing I see here, yeah, let's zoom in on Unity Ads vector. They're their public numbers since last year showed double-digit Q over Q growth, you know, every quarter. You have their share down 50% since July last year. Can you square that for me?
I cannot.
[laughter]
That was not something that I was aware of the top of my head. Thank you for bringing it to my attention. Um this is I would say an an early data set for us, obviously. Very difficult
problem, but I was not aware and I can't square that for you, unfortunately.
And this is like a brand new report, the first of its kind to my knowledge. I I can't stop looking at it and just finding new ways to read the data. One of them is inspired by the fact that there is endless speculation about AppLovin's take rates. What I mean by that is, if an advertiser pays AppLovin $10 for an install, you know, how much of that $10 goes to the solitary game that showed the ad, which is what you're showing here, and then how much of that $10 does AppLovin keep for itself? And this data lets us broadly estimate that for the same time for the first time. You know, so you have AppLovin overall 36% of 12 billion, which is 4.3.
Their net revenue last year was 5.5. So, 4.3 to the game showing their ads, 5.5 to AppLovin. Even reducing AppLovin's share to account for some non-gaming, is it possible that they're taking half the pie?
Uh yeah, this is a really good question, really creative way to put together some of our data. And I had to ask for some help answering this these questions and these other questions, too, honestly, from our amazing ads product manager, Crystal. And my understanding is that these two numbers, it's a little bit imprecise, maybe, to subtract them. The 5.5 billion is AppLovin's financial year 2025 advertising net revenue, I believe, which is, you know, what as you as you said, what they keep from the ads platform after selling the the apps business. Our 4.3 billion is a supply-side estimate of what publishers earned when AppLovin's network filled the impression. So, conceptually, it's definitely the same neighborhood as as, you know, publisher payouts, but but treating the
5.5 billion of AppLovin keep and 4.3 billion of publisher earnings as two halves of one take rate equation, we're assuming that that they're matched to the same activity, and that's that's It's completely true, I would argue.
Why not?
Yeah, take rate and we'd need a keep and payouts for the same pipe, right? Our number is in-app publisher earnings when Apple 11 filled, including fills that one inside of the other other mediation stacks, not just max. Apple 11 5.5 is company ad keep across a broader set of activities. So, there's Axon which buys in-app, but also web, e-commerce, CTV. Some of that never shows up as in-app publisher revenue in our panel at all. So, part of the keep is impaired with our supply number. And our coverage that we've talked about already, it cuts the other way. The 4.3 billion doesn't see every map, every app, every market. So, it's best read as a floor as we mentioned on publisher earnings from Apple 11 fills. And if you
put those mismatches together, a keep that's a bit too broad for this comparison, payouts that are under bounded, and the resulting take rate gets pushed upwards for for when we try to use them as an estimate. So, I would say that 4.3 billion can be useful as a floor on what publishers earned from Apple 11 network fills and bounding take rate needs to match the demand and supply scopes, including the Axon activity outside in-app, and we don't have that here.
It's not as comparable as we'd all like it to be. I think it's one of the questions I'm asked most, like how much of the pie are they taking, cuz they're so successful right now, and yeah. I don't think this is quite comparable enough yet. So, I'm going to torture you anyway. Best guess. Based on what you know about the inaccuracies that we have, do you think their take rate's closer to 30% or 50%?
So, this is definitely a guess.
[laughter]
Um but based on what I know, I would guess it's closer to 30%.
That's a good guess.
All right, thank you.
Let's take a look at the games themselves earning all this money. What stands out here is that the ad monetized world is really different than IAP. For instance, puzzle is more than half of all gaming revenue. And it's about four times the next one. Arcade. Why is puzzle so well suited to ad monetization?
Yeah, so there's a few things that contribute to this. First, puzzle is massive, right? Number three genre by downloads, number two by time spent both of these figures in 2025. And the genre ahead of it, simulation, that's only number one because Roblox is in there and it just warps the category. Second, genre is just really suited for ads. Players come back many times a day in short sessions. They have clean breaks between levels that make the perfect slot for an interstitial if that's the model you're
going for. You've got options like, you know, the give me five more moves or hints. These are the perfect placement for rewarded ads. And audiences really ad tolerant to placements like this into other placements when you compare them to other genres like mid-core genres for example. Also, I I think advertisers kind of just want this inventory. It's pretty desirable. Puzzle reach is broad, highly engaged. It's a proven commercial audience. It's not just a pure ad monetization niche which helps support demand in the category. And most puzzle players never buy. So, ads monetize the majority IAP misses. That's a big deal in a genre that's also number two IAP. And it's why the biggest casual publishers live there and why they spent years tuning ads in look like puzzle loops, which these learnings transfer across titles more easily than in messier smaller genres. And that compounds the knowledge lead and allows them to, you know, you use ad monetization strategies more successfully in the genre, I would argue. All that together is why I would think that puzzle is more than half of gaming ad revenue today. I guess one last
thought that that that comes to me is that again our our coverage doesn't include China unfortunately at the moment. It's a pretty opaque market and that's it's huge and definitely more mid-core focused and I don't know, maybe we would see a different split if we included
So that the two takeaways I got there was to summarize that for the whole first argument I would say maybe what you're saying is casual gameplay blends well with casual monetization.
Absolutely.
And and then the second thing is the audience itself is so broad. Is the puzzle audience like older, younger? What makes it different demographically?
Demographically I think it's probably older and probably skewing towards towards women if I had to take a guess. I I believe our audience data would answer this question more more precisely. But I I think it's just a wider range of players compared to other genres. We have a a feature in our audience where we call personas where we look at what different users of different apps are
really interested in. And I suspect that puzzle is probably broader and has has more different personas that that show up compared to some of these other genres.
Interesting. That also might explain why it's so attractive like you said, especially if the the audience is a little older than average. That's very attractive to advertisers. Just looking at this this data, this also may explain why we've seen Dream switch from you know, promising no ads in its ads to you know, enabling ads in Royal Kingdom and Royal Match. Is that revenue in this number?
I believe that some of that is in there. Uh we do detect the ads immediately. It shows in product the following month. The revenue should be in there as long as it's Yeah, this is up until April. I Actually no, off the top of my head I'm not positive when when these two games started showing ads. But we do estimate I did look this up that Royal Kingdom did about 2.4 million in ad revenue in the markets we cover in June.
2.4 million in June.
Wow. we estimate currently, yeah.
Okay. And then, so those would be casual games, right? Not not hybrid casual.
See, this is a really interesting question that we we always have
Everything's averaging towards the middle, right?
Yeah, that's true.
Everything's diversifying. What it it it melts the brain.
And it's it's a challenge for us when we're asked, you know, is this a casual game? Is this a hybrid casual game now? And my first instinct is still if Royal Match isn't casual, what is, you know? But at the same time it's it's definitely arguable. Yeah, it has ads now and that's like a key key variable
Yeah. Variable, then maybe we should consider recategorizing it.
It's not an easy question to answer and I I think that our our Game IQ taxonomy team is hard at work trying to figure out how to continue keeping up with the game market's needs.
They got a moving target on their hands.
Yeah, at all times. A lot of people are are paying attention, so I wish them luck and I I
I do my best to help them as well, but they're they're definitely the experts.
And so I believe this would also have the Dream Games as match swap, correct?
Yes, match swap.
So, it's really interesting to see as in this report that casual match swap, which would be the category that Dream and Playrix live in from 2025 to 2026 was the biggest loser, losing 155 million in revenue. Does that surprise you considering we're seeing games kind of flood into that category?
I do think that there is a certain game that might have we do show some decline in estimates for at the moment. That probably explains this particular dip. And so, I I think that this might be a single large game in the background to moving this this category as opposed to a category-wide shift.
Are you going to keep us in the dark?
Uh currently our our our estimates for Candy Crush Saga are going down, actually.
Mhm.
So, what you're what you're saying is Candy Crush is declining in ad revenue, and Playrix and Dream are moving in and increasing ad revenue.
I I'd have to go back and look at the who's actually increasing, but that sounds reasonable to me.
All right. Going back to this slide, if you were to start building an ad-monetized studio today, which genre or or subgenre would you want to build in?
I mean, obviously, the puzzle seems to be where the money is, right? But, it's also the most competitive.
Where the knives are.
Right.
The reddest of oceans.
The reddest of oceans. And yet, it does seem like maybe the the the the best place to start. You know, we we're seeing a decent amount of of new games coming out in in puzzle all the time, maybe trying to start like a new mechanic or a new subgenre. Pixel Flow comes to mind. So, that's probably where I would start looking. At the same time, I I I haven't seen uh the specifics aren't coming to me
immediately, but there are a decent amount of games coming out that target a a a smaller subgenre, a more stagnant subgenre, and revitalize it. I guess Meow Doku is one that comes to mind quickly. Although, I think that it's also a puzzle game.
[laughter]
Yeah, it's a Meow Doku is a lot of things. But, let's uh let's zoom in on a game you just mentioned, Pixel Flow. I want to talk about hybrid to round things out. Perhaps the the clearest finding in this report, an advertisation report, is that the the top IAP-focused hybrid games, like Scopely's Pixel Flow, are are out-earning the top IAA ad-monetized focused hybrid games by 4x. What's the story here?
Yeah, I think this is a story of different economies. So, whenever you're looking at whale economies, you get a
much higher ARPU, right? And if you're focusing on ads, it's going to be smaller. At the same time, you know, pure ad-mon giants like Block Block Blast show ad-led monetization can reach a very high ceiling. So, the audience and revenue potential for ad-first games is clearly there. What's less clear is the middle. I think IAP-focused hybrids, at first glance to me, make a bit more sense. You monetize the high spenders with purchases, maximize the ARPU there, and then you add ads to monetize the players who won't pay or, you know, to supplement and and do it in a way that's that's pretty additive, it seems. If you do IAA-focused hybrid, it seems to flip that stack. And my hunch is that some of these run high ad load, and then you have some purchase friction on top of that ad-related friction, but you don't quite reach the whale-level monetization that drives some of these IAP-focused games. So, I I wouldn't say IAA hybrid is dead. I would say that fewer titles have made light IAP clearly additive to an ads-first loop
the way that some IAP-first games seem to make ads additive. There's also a portfolio lens. There are studios out there that optimize for scale across many titles, not one whale-driven hit. So, an IAA hybrid mix can look modest at the title level even when the strategy is intentional. And and of course, this is all just trying to infer intent from monetization mix. I call it an open design question, not not a settled playbook. Um I wouldn't say it's a dead-end market, either. And I would also just say that winning whale IAP at scale is brutally competitive, and it's generally easier to ask players for their attention than their wallet.
Fair enough. And that That's a double click on what you said about ad monetized. You also have a separate chart showing Block Blast beta Majong and and Solitaire Association's journey. You know, Block Blast you have a 127 million so far this year. Massive massive game. Vita and Mahjong is at at 90. Solitaire is at 73.
Looking back at that original chart, if we were to put those on this chart, I I think they'd be numbers two, three, and four, right?
Yeah, that that looks to be correct.
So, your point I heard earlier is sort of that not only is IAP focused hybrid four times larger than IAA for ad focused hybrids, but just straight-up ad monetized games are bigger than ad monetized hybrid.
So far, yeah. I wouldn't say that we're never going to see that. We we definitely could. But at the moment, some of these ad focused pure plays have been outperforming, as far as I know, all of the IAA focused hybrid casual titles, yes.
So far, I mean, looking a few years down the road, do you think this is going to we're going to look back and this is going to be a small TAM, or is this a a blue ocean no one's fishing in yet?
Yeah, I I I don't think it's a small TAM.
You know, these these pure ad mon giants that you just mentioned, they they prove that these ad monetization focused games, there's a very high ceiling there. And I think there's probably a way to sprinkle in some spending and do it in a way that's additive that people maybe we haven't purely focused out yet or really optimized and figured out yet. And yeah, maybe we'll see that in the future.
All right. Same question as earlier. If you were starting a studio today, based on the numbers that you're seeing at Sensor Tower, what would you build? Would you go IAP only, IAP hybrid, ad focused hybrid, or or ads only?
I think the answer for me is probably IAP focused hybrid. I think I feel like the IAP focus is as red ocean as it gets. And yeah, I feel like I'm just seeing more breakouts coming from the IAP focused hybrid category than in other categories at the moment. And that's kind of the wave I
would try to ride if I were if I were starting a studio.
Okay. So, that's where the the bluest ocean is right now.
That's where I would go based on what I've seen so far, yes.
All right. Well, I guess I'll know what you're going to be announcing funding for soon.
[laughter]
Well, we'll see. I quite like working at Sensor Tower, so.
All right. Well, a floor of $12 billion in ad revenue in 2025. It's an amazing report. The more I read it, the the more I keep teasing out of it. Thank you for joining me, Sam.
Yeah, my pleasure, Jarkko. Thanks for having me.
You did it. You made it to the end of the episode. As a fan of the show, it would help us out if you'd subscribe and leave us a review on the podcast service of your [music] choice. Those stars and likes, while a small action on your part, mean a lot to us and help to grow the show.
[music]
More importantly, are you a member of the Deconstructor of Fun Slack group? If you have 5 years or more of games industry experience, [music] go to deconstructoroffun.com/slack
and apply to join. Join the games industry's best [music] professional community full of peers always willing to lend a hand. Or subscribe to our newsletter to get all the latest insights from the Deconstructor of Fun content creators. Thanks for listening. [music]
Auto-generated captions from YouTube — names and numbers may be misheard.









Comments