Loading the document
1 free read left. Create a free account for unlimited reading + AI research.
Create free account
Superstar Session: Hypercasual Games Under the Microscope: What Happened in 2020?
Key insights
6 takeaways- 01The mobile gaming industry is shifting toward granular sub-genre analysis to improve performance benchmarking and inform more nuanced, data-driven soft launch and regional strategies.
- 02Android metrics are significantly more reactive to external factors like lockdown mandates and seasonal shifts compared to the more consistent performance metrics observed on iOS.
- 03Analysis of over two billion monthly players and 100,000 games shows that Android users exhibit higher session counts and longer playtime, while iOS users demonstrate superior day-seven retention and stability.
- 04Developers should move beyond single-metric evaluations by prioritizing Lifetime Value (LTV) and integrating ad revenue data to accurately assess the health and profitability of their titles.
- 05While North America remains a high-value market, Europe offers stable engagement, and Asia—specifically China—represents a critical high-volume growth opportunity dominated by Android.
- 06The 2020 global lockdowns disrupted traditional seasonal patterns, leading to sustained increases in mobile gaming playtime and engagement throughout the first half of the year.
Ask AI about this video
Transcript
uh this is called the superstar session this is the 2020 uh gaming kpis in review and uh to pronounce uh to present that topic from game analytics is uh i wanna haren and chick and i may have butchered your name i'm sorry that's all right um hi hi kate um hey everyone uh i'll quickly share my screen and i'll put this powerpoint here in presentation mode so uh hopefully you all can see what's going on um i'm going to take you through uh some stats today which is what i usually do in my pgc talks um about 2020 and how the mobile industry has changed in particular we're going to be looking at
some platform differences today so uh before i get into that a little just a little bit about myself um so i'm the ceo of game analytics um and uh i've been with game analytics for a few years now but during this time we've had uh tremendous growth we've increased our user reach um eight times uh we work with some of the largest publishers uh globally right now um and our sweet spot is kind of hyper casual over there we work with some of the biggest names in the industry um we also do a lot of just general analytics and data analysis for the industry and benchmarks reports and we started to release more and more data and products around this um so you're going to hear um more from us on this actually in this presentation and generally in the next few months so uh these insights that i'm going to share with you today about the industry a good thing to know they're um with the exception of a single chart they're all from our uh product benchmarks plus uh so game analytics the core service is
free uh benchmarks plus is a mobile intelligence uh service which is actually a paid service uh but that uses kind of the game analytics uh data set that we have to create this industry analysis that you can look at just to compare your game and see how it is doing against the industry or if you're a publisher or an ad partner for instance to analyze a game and see if the metrics are healthy how they're doing in the industry and if the game is worth investing in supporting and so on um our reach is pretty massive right now we see more than two billion monthly uh players we've tracked more than a hundred thousand mobile games um it's you know it we think it's the largest data set of its kind in the industry um so we're very happy to share these insights with you all um and in terms of what we're going to cover uh we look at games by genre um and we like i said specifically today we are going to look at platforms so differences between ios and android um which is a topic that kind of was on
a lot of people's minds this year and also kind of regional differences across platforms and so on um the goal is for you to kind of at the end of this talk learn something new about what you can do or maybe whatever opportunities there are there for you are there are for your game that maybe you didn't consider uh before didn't consider in as much detail you kind of thought it was a good idea but didn't realize that this might be a great idea and you should prioritize it um okay so uh so far this is an analysis of the first half of the year um and uh it's an analysis of just the log down period we've published this analysis before but we i'd like to just keep starting with it because it kind of shows that just how how strange this year has been from the perspective of mobile gaming so uh the lockdowns have had significant impact on the industry the reason we've not this this um graph actually goes to june the reason we haven't published one of these is because um in the summer things kind
of stayed at the same level then in in september things kind of started normalizing a bit and now we are starting just very lit and when i say now i mean like now this week uh as like countries are starting to go back into lockdown um we're starting to see um again different patterns so um we are going to put out a new analysis at the end of this year but so far this is still relevant kind of play time stayed generally around 15 percent higher even throughout the summer um compared with the rest of the year across the across the industry so the industry increased this year for lockdown and then just generally remained at a higher level until about september um october when it started going back to a weekly weekly normal trend like lower traffic during the week work week higher traffic at the weekend um but then um now like i said it's it seems to be going back again so exciting times um still good year for the industry overall uh generally let's say industry
has been in the green now um i wanted to uh start off the platform analysis with the retention day seven um the reason we use retention day seven is that um it's kind of we see it as the best catch-all metric in the early stages of a game's lifetime so uh retention day one usually gives a lot of false positives retention 28 is too far away to like wait for uh so retention day seven is just in that sweet spot where it allows you to analyze your game very well uh but it's also fairly quick and it's usually a very strong predictor of the game's overall performance so um the reason we wanted to look at this was because uh this year um you know there was a lot of conversation around ios there's a lot of opportunity on android um but people don't usually know them as much about the differences between the platform so it's kind of assumed
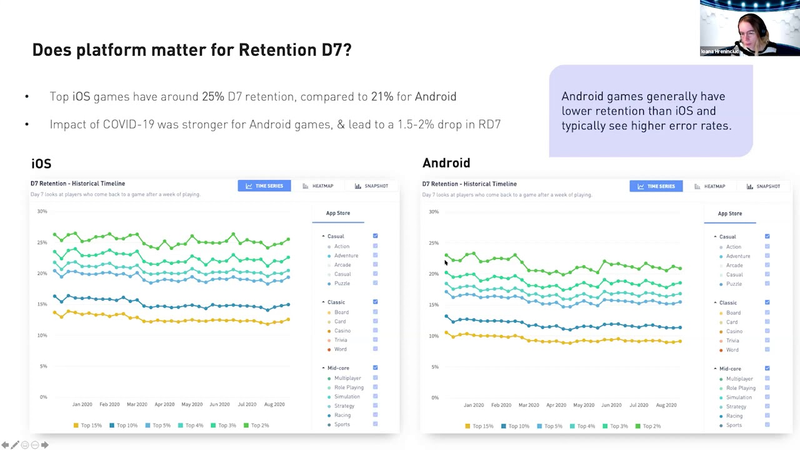
that um you know ios has higher metrics android has slightly lower metrics um but the image is quite actually the picture is very complex and i will go into why it's starting with retention so on retention day seven um generally android retention is lower than ios it is generally lower than ios across the industry by about four to five full percentage points so here we were looking at let's say uh 25 for ios 21 for android but there are also different behaviors in retention so uh this year what we saw in general across multiple metrics is that the android uh space was more affected by changes to the industry in general so um you can see for instance here that there is a dip in retention around the time of the lockdown we expect from we expect for instance the lockdown starts again a similar dip to occur secondly you can
notice that there's a slight downward trend so um this uh this um kind of didn't just have like one a short impact but kind of there was a general more impact there was a longer term impact on the industry whereas ios and i know some game developers know this where ios users are almost like you know just a groupon to themselves in any country across any game they're ios users and you can see that in some of the metrics where you know this number there is a little bit of a drop here during like the beginning of lockdown but it's pretty much rock solid like it's very very stable so um it's android tends to be much more reactive so this means that if you are testing a game in a certain period you know you may expect that you see let's say slightly lower retention for android but in particular time periods that difference may be higher than you expected so you may think oh this game is maybe not doing so well but it's actually maybe a factor that um is affecting the entire industry and you
want to have that information at the time because you may be bidding a game that is actually doing well uh comparatively well to other android games so this is something that is very important to know um again um android retention is slightly lower generally um but it's also more affected by seasonal effects and other effects like that i couldn't exactly tell you why but this is what we noticed repeatedly um and you know um this makes it um i wanted to um focus a bit on hyper casual in particular because again it gives a certain picture that retention is still uh again slightly dropping on android and it's of a certain level but i wanted to focus a bit again on hyper casual and we use arcade uh to look at hyper casual because it's the genre we most identified with hyper casual so far we now recently just released a hyper casual genre per se so the next time you hear benchmarks from us uh you're going to just we're going to be able to look at just hyper
casual instead of our gate but at the time of this analysis um that was not that was not yes yet released because it's literally just hot off the press so um one thing to know is that in some genres like our casual which is a good demonstration of this the difference between the uh retentions is even higher so in the case of hyper casual um you get like from 21 on ios to 14 which means there's 50 more players on ios in day 7 than there are on android uh for um you know for the same number of installs so this is very very important to know when you do look at retention you do want to consider the genre of your game because different genres be have very different retention figures um and again even if you expect band rate to be lower you may be expecting it to be two three four five percentage point difference but it may be that seven percentage point difference is absolutely normal right uh the other thing is that you can also see here that there's a general drop in retention for android compared to the beginning of
the year um and again that this is more pronounced in around lockdown time but again that it's generally trending downwards uh more more strongly whereas again ios recovers very quickly very small draw barely perceptible um and generally doing very well so if you have launched android games this year and felt a little bit confused about what was happening and maybe performance wasn't what you what you expected from ios it's important to know that that's kind of it's you know you need to expect the unexpected essentially with um when releasing a game on android and compare it to you know proper industry benchmarks um the other thing is that there are you know there's more than just retention like retention is a great metric uh but actually uh there's other metrics where android is better playtime is one of them so people actually play fewer days on android but when they play they actually uh add up more time in the game um it's about i think twenty percent higher
yeah for uh android than for ios which considering that there are fewer days um played it's actually a pretty significant difference overall if you have like 50 lower d7 retention for instance and then you have 20 percent more time played so it does mean that if just people have a slightly different behavior when they play they play more uh but again here as well you see this slight um downward trend i would say though um it is also you can see here a slight downward trend on ios towards the end as well we expect that here actually this drop is compounded by just beginning of the summer typically in the summer simply because of the season people place somewhat less um so whereas they would be coming back generally retention may not be as affected over the summer uh play time will typically be lower so i think here we are seeing kind of a combination of just general trend uh with um an added seasonal effect of just it's warm outside people are going out spending less time on their phone so this is why you are seeing probably a
sharper drop um here and why also it's a present in in both cases so we are literally seeing people coming out of lockdown going outside is pretty much it um the other thing is that another interesting thing is that a session count um which probably explains the play time is completely inverted so there's 50 more sessions on android for top games than there are on ios um this is uh not only people don't look at session count as much the reason i think it's very important is because typically you know the first ad in a session for instance it is quite valuable um the more sessions you introduce the more sessions the player plays um can lead to different rewards and so on so it can affect how you engage with players in in your game and this surprised me personally that retention again is lower and maybe play time is higher but that session count is this much higher so essentially again people play fewer days but when on the days that they play they
have more sessions which leads to larger total uh play time so this is also kind of very very interesting to know that the picture is quite complex you can't just look at a metric and go oh you know ios is better and or you know people come back more on ios and so on you actually have to consider that for your ltv analysis it's important to look at ltv directly not just use any single metric uh we do well with our retention at game analytics so people retention is considered truly an industry benchmark like it is the standard retention that um many publishers and developers use um but still we are you know we're trying to pull in more information like ad revenue data in particular and a store iep we already have to help people actually measure ltv directly and understand not just you know what the engagement metrics are saying but effectively at the end of the day if you showed you know if there's an extra
session played and there's three more ads that you showed or there's another purchase over of you know a whole week how much money did that make you so it's very important i think uh although these metrics you know there's like down is up um one you know they have different strengths uh per platform uh the important thing to remember is that it does mean that the only overarching metric you can probably look at if you want to look at only one metric is ltv right and like i said we're doing more to provide more ltp analysis as well um secondly um so the next part just um helps us look at what other opportunities there are so okay there's opportunity to do more with android it's it's a solid you know platform i know people already launch an android but there's an opportunity to focus more on android um and to launch directly on android when you do something um as some publishers are already starting to do but secondly um again there's also a regional
opportunity um and i wanted to discuss that as well and the two are also slightly connected which will get you a bit later but um the point was um that um you know people tend to distinguish between like north america and europe and they have you know they're considered different markets um and we just looked at hyper casual to kind of keep comparing apples to apples um so this looks at average session length so how much um you know people are playing in general on a typical session um and the average session length uh is quite what we see is that for top performing games is much higher than people expect even in um you know um hyper casual so it's about 30 minutes of course it varies between something like seven um you know minutes uh or even let's say five seven minutes for the top fifteen percent of games um to of 30 minutes so essentially from in the top 15 percent of games the session length the average session length quadruples
from when you get into the top 15 to when you get to the top two percent so there's like a massive range over there um so it's it's also an important metric to optimize uh but again an interesting thing here is that north america is far more affected by seasonality uh than europe europe tends to be more more stable and also europeans tend to play more actually so again um you know north america is a top tier mark top tier market high ltvs um highest in the world sometimes um but again europe is like a solid still like a solid gaming market people actually play um slightly more uh it's also not a market that requires a lot of localization but it's a market because of where because traffic is you know not as easy to acquire uh in you know in a targeted way as it is which is like a larger territory like the us for instance our people don't always explore the full potential of europe so that's why um i wanted to bring this up because and also although
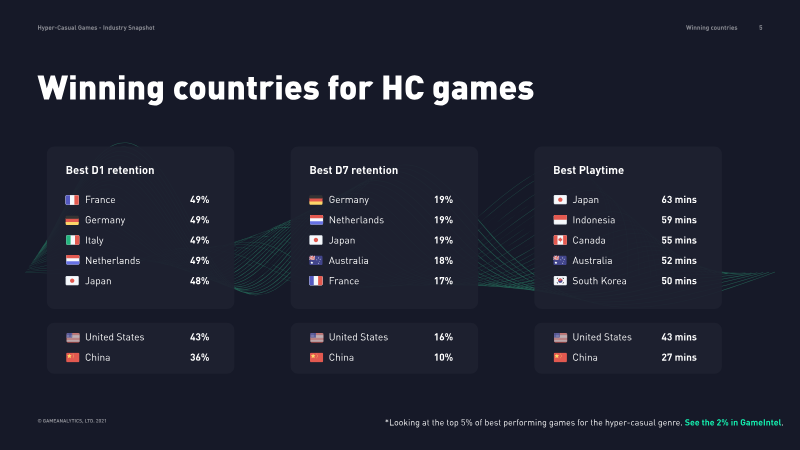
you know ecpms are slightly lower in europe so are cpis so um again a very kind of good opportunity to look at europe maybe more closely uh consider if more can be done there because and how the strategy could be changed they're considering people played slightly more even if ecbn's are slightly lower the other part is um we wanted to look slightly at asia and um you know asia is we consider it primarily in android market which is where kind of the intersection of the two comes in especially due to china where there are like i think 500 million more android gamers than ios gamers so the difference in volume is just absolutely massive they're like five times more android players um and in asia in general session times are actually lower um and the market behaves a bit more like the us than it does uh europe in general uh but again session times are still fairly stable uh pretty solid still kind
of in the 25 to 30 minute range for top games still in the kind of five again if you go into like uh the top 15 it's about seven minutes again to like 25 minutes so still like a good play time uh generally worth doing and now more people are kind of going to asia you know uh again tencent invested in voodoo quality launched an office there um so it's i it's starting to be taken you know a more um it's starting to be a bigger priority as a market which i personally think it always should have been but of course everybody has to do one thing at a time so now we're seeing this much bigger push stronger push for china and asia in general and many publishers now again launching there as a priority which you can also do as developer or you can ask your publisher to do or you can ask them about their china strategy if you want to kind of make the most of your launch of your time okay so
rounding up because that was a lot of figures and that's a lot of insights so one of the key points for today is metrics very measurable tvs like we saw retention um is higher retention d7 is higher for irs slower for android and retention in general is higher for ios than for android but both play time and session count are higher for android than for ios so do you get a really mixed picture it's very important to measure your ad revenue correctly and as much as possible at player level so you can tie and to tie it to campaigns and to see where are the territories the platforms where are the places where you are making money and your game is profitable um and again although con conventional wisdom stresses that you'll make most of your money in the us and you probably will but you can still make more from individual territories both in europe and in asia than if you just focus on the us as the only market that you can
care about the other thing to know this was a strange year in terms of metrics metrics behaved very differently typically um retention is and play time are higher are high in the cold season and they're lower in the warm season some interesting things happen here we're in the cold season if it is a holiday retention will actually drop so you'll see this when people go like traditionally when there is a whole day and people go back to work then all of a sudden they stop playing some of these effects that we saw did not apply this year at all so play time just increased as we were going into the summer instead of decreasing as you normally would with the warm season um there was just a flat line like there was no you know difference between the weekdays and the weekend whatsoever and then again that came back briefly in the fall and now it's going away again uh secondly again platforms are affected
differently so on android some of these effects will probably be more powerful than on ios where ios players tend to be a more stable group of users so again if you do soft launch an android game treat it kindly and verify that the numbers make sense it may be what you would expect to see for android games in that space um the other thing is again just launch in asia a lot like try it out i know people again launch ios games um in china in particular and they avoid android because even though there are 500 million players um there's such a fragmentation of the ecosystem but more and more publishers can take you there and we do advice just publishers who haven't gone there to just do it because the number of android mobile players in china is as much as the us and europe combined and it is a tier one market so um again a very different ecosystem
difficult but massive massive opportunity um which is worth which is worth exploring right and in terms of metrics if you found these metrics useful and you want to get more metrics like this and i'm not around to give you a talk um it's possible to just get these metrics yourself uh from our benchmarks tool you have a discount code here if you want to get it it's insights 20 it's just either benchmarks.plus or gameanalytics.com benchmarks um and um we just released subgenres uh so i'm going to tell you about uh that in a minute uh but the important thing is it helps you to compare your game at any stage um and to get an idea of where you are secondly we're working to provide more ad and ltv metrics for ingesting more ad data and helping people do more ltv and game analytics um if you do work with us please integrate your ad revenue it it helps to to create reports like this um and also we highly recommended people
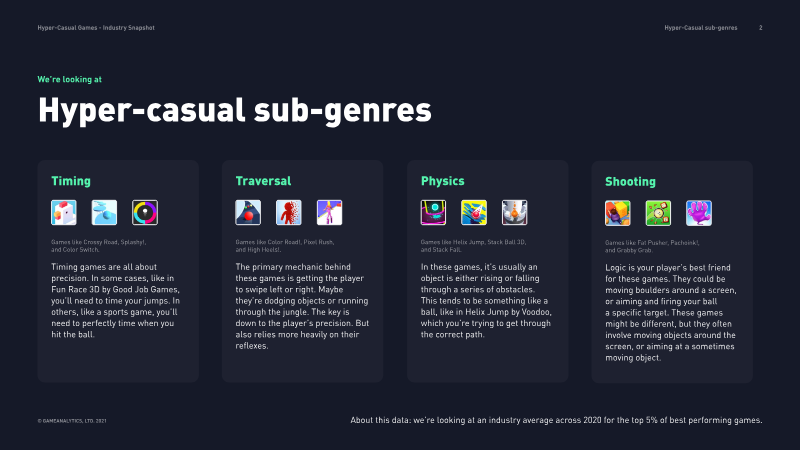
you know when they soft launched the a b test they used their ad revenue and ltv as part of their a b testing so um definitely it's possible to do all of these things right now even with a free tool like game analytics um and in terms of sub genres um so like i said next time you'll be hearing from us we're gonna go through like with much more granularity um and these are the sub genres that we just uh like recently a few days ago um released to benchmarks plus so now instead of looking at just arcade or action or adventure you will be able to look at platformer games for instance or tower defense um you know or shooter games and so on so you would be able to look at match free puzzles so it's it's a very powerful very specific data set where even if you can't look at one specific app right now um you will be able to just get a very good idea of where you and your game should be in terms of metrics and how the industry is performing at scale okay uh that's it for me um
another good thing to know uh uh people at gamelinks are very friendly so if you do have a question after this meeting i'm on the discord actually for pgc um for the rest of the day today but you can just also email us at insights at game analytics it's we genuinely answer that and great thank you so much and we actually have just a few minutes um you've got us a stack of questions piling up in the q a and i don't think we'll get to all of them but we'll get to the a few than the others you know join uh join uh ioana in the discord and uh uh you can ask your questions there ask away the first question you have is is the drop into retention in android seen in all geographies or is it more concentrated in some regions uh so that's a very good question it's across all geographies but it's slightly different than each geography so it's both so it's important to it's important to check and also it depends on the genre of game as well so
you may want to do a combination of what genre your game is versus what geo you're focusing on uh but yes that is a very worthwhile question to to ask and yes it's different all right so the other question is as in asia a lot of people play during the commute how did the lockdown and the work from home influence the data there okay so asia is interesting um typically yes we do see a very strong uh pattern in in actually in china in particular um where we also did focus on online because it's such a large market we did some targeted analysis on that where um the retention day seven was like the single most predictive metric people play during their commute but if they didn't come back at the weekend you're probably gone right now asia has actually normalized a lot faster than the rest of the world um in terms of metrics so like i said the rest of the world didn't really show this kind of um let's say weekly seasonal pattern
um and in asia it still appeared i would say it's slightly diminished from before so you can tell that maybe either people are working from home um it's not affecting them as much but it's i would say the behavior has been a more typical behavior than in the rest of the world great and i think we can maybe squeeze in a couple more questions so uh when users start playing for 30 minutes is it fair to say that hyper casual is getting closer data wise to casual games i would say um it depends there are still like that 30 minutes is still like the top two percent of games um so if you're looking at and you know games in the top 10 20 change so rapidly right now that some of them actually won't even make it in our top two percent right so um it's you're looking at the very very top over there so we do see games that still do very well and are like charting top 10 games which have lower
session length um you know average session length and they do like 10 minutes really again even seven minutes sometimes um but you also see them with 12 and 15 and so on so it uh it really depends if you look at the very very top versus just a regular charting game right great and so i think let's do one more question um so do you believe this new lockdown in europe will again influence people to play more games uh yes so i was looking at the uh at the benchmarks this morning to actually see if i can tell you guys something about this and again it's like a very you know it's very it's just one week but it's just going up so uh it's very exciting and i do think that and just consider it's always of course if we're going in the cold season so that has an effect as well so it's going to be quite pronounced probably that um especially you know as it's getting cooler and cooler so we've actually seen as the weather has gotten warmer in the past few years a shift in mobile gaming growing it used
to grow like in october uh like cold season used to start in october and now it starts like in november uh but and now we are in november again so now second half of november december we expect there to be kind of a very sharp growth at some point with the combination of just lockdown cold and anxiety related to lockdown that people control with mobile games that's great well there's a couple more questions but i'm going to encourage the people who ask them to join you on the discord the link is in the chat so if you folks want to uh you know go over there and ask some q a please do um thank you so much for that super enlightening talk that was very useful oh my pleasure anytime and yes like i said i'm on the discord so happy to answer any more uh quite more questions for you guys there thanks so much
you
Summary
This analysis of 2020 mobile gaming trends, presented by GameAnalytics, examines the impact of global lockdowns on industry performance across major platforms and regions. Utilizing a massive dataset of over two billion monthly players and 100,000 mobile games, the findings highlight how the COVID-19 pandemic disrupted traditional seasonal patterns, resulting in sustained increases in playtime and engagement throughout the first half of the year.
The data reveals a complex divergence between iOS and Android performance. While iOS maintains higher day-seven retention and exhibits greater stability, Android users demonstrate higher session counts and longer total playtime per session. Android metrics are notably more reactive to external factors, such as seasonal shifts and lockdown mandates, whereas iOS remains relatively consistent. The analysis emphasizes that these platform differences necessitate a move beyond single-metric evaluations; developers are encouraged to prioritize Lifetime Value (LTV) and integrate ad revenue data to accurately assess profitability and game health.
Regional analysis indicates that while North America remains a high-value market, Europe and Asia offer significant, often underutilized opportunities. Europe shows stable engagement levels, and Asia—particularly China—represents a massive, high-volume market dominated by Android. Despite the complexities of the Chinese ecosystem, the sheer scale of the user base makes it a critical territory for growth. The report concludes that the industry is increasingly moving toward granular sub-genre analysis to better benchmark performance. Ultimately, the findings suggest that developers should adopt a more nuanced, data-driven approach to soft launches and regional strategies, accounting for the unique behavioral patterns and platform-specific characteristics that define the modern mobile gaming landscape.
























Comments