1 free read left. Create a free account for unlimited reading + AI research.
Create free account
Can Showing Fewer Ads in Your App Lead to More Money?
Key insights
6 takeaways- 01Developers should shift focus from maximizing short-term per-user ad income to finding an equilibrium between user experience and monetization.
- 02Data-driven monitoring of eCPM decay curves allows developers to identify the specific impression threshold where additional ads yield diminishing returns.
- 03While rewarded video is popular, interstitial ads often align more effectively with the rapid, repetitive gameplay loops characteristic of the hypercasual genre.
- 04Reconciling granular impression-level data with aggregate API revenue reports is a critical technical requirement for accurate financial modeling.
- 05There is no universal benchmark for optimal ad frequency, necessitating a game-specific strategy that continuously analyzes the correlation between ad load and player behavior.
- 06Aggressive ad frequency in hypercasual games frequently triggers user attrition, which undermines total lifetime value (LTV) and long-term financial health.
Ask AI about this video
Transcript
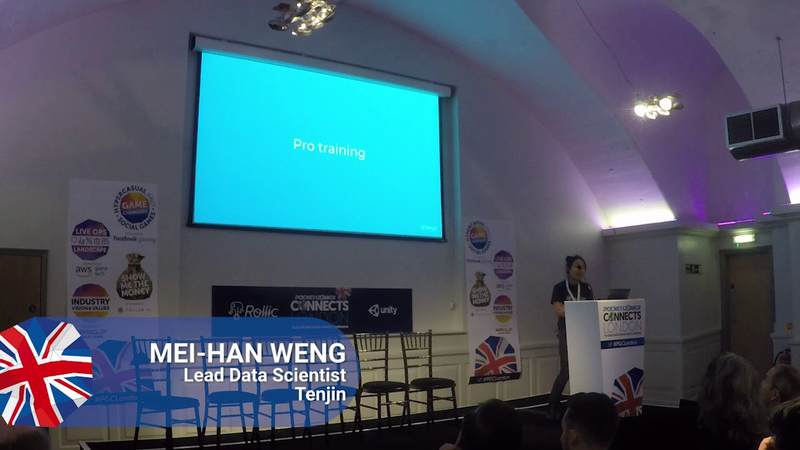
[Music] so today's topic is thank you can showing fury ads in your athletes to more money may sounds really generic I think but and it is a really broad question so we'll try to cater this classroom by divided into two different aspects so what are we gonna learn today for the first part we're gonna talk about why is that frequency important or was also what does that even mean second part will more talk about how to use data warehouse to run some like optimize report that you can easily adjust your African see and then share a sepm benchmark report if you
guys are interested so a bit of self marketing 10j what is tangent I have thing as like probably 100 times what is tend to actually mean so the word itself is actually anyone know what is tangent wing the word itself alright it's actually a Japanese word for god of wisdom and as for why do they choose this word you have to as our CEO here somewhere in this building and we need to finding that and he'll give you read like profoundly interesting answer so we provide tools and training for developers we're relatively small team so we try to cater to whatever things people are interesting and also learn with our customers so for the top chart 7 out of 10 czar actually our customers is something makes us happy because only when our customers curl we also draw so
we have some customers around the world mostly in Europe here in UK we have quality think Khloe and like now we are trying to also extend to more other region and then the three top reasons of choosing us we have a really lovely customer success ting like wine colleagues here Khanna and ebony they are both amazing they will have all kinds of schedule one and one with you to understand what's your PIN point and how come our product and actually cater to your needs and then for product what's like we're specializing is actually we have a data warehouse product called data fault it's more like you just don't have to build your own data warehouse if you don't want to and we have this data warehouse but if you think like your data warehouse is better you can also just ingest our data into your own data warehouse no matter it's on Google Cloud Russia or whatever the
third part is pricing because it's free to try when you send us too many pens we'll start to charge your money so here is our main customer success team I personally also I'm a data scientist file so working this thing with Carol we mainly do like data stuff and we have people in San Francisco our CEO Chris is facing some friends and other colleagues in Japan all spread out take care jump to the main topic so in order to cater what be super more money we need to define what the money mean so we need to first discuss what are the types of revenue data out there currently so the first part is like just a basic revenue data that your and network send you also what they send us so this is exactly the data you'll find our dashboard and then this is our user level data would be like we use session to calculate it in this data you won't
find impression live level the second one is like now a blobbing and ira so they are like start realizing this user level data you can have the user level data and then some has some sort of impression level via calculation the third part is something we're currently working with is a multiple impression data you can actually access impression data in our data warehouse currently and we have been seeing our customers doing really profoundly interesting things and then after knowing all these three types we can jump back to the topics can actually show in fury ads in your app make more money to you do you think it is true statement anyone yeah okay awesome so the truth is we don't know so we want to know so we realize the conventional ways
always show more ads get more money but you always will reach a point that you're afraid whether you annoy your users too much so you're starting to think is there a point where I can just stop annoying my users so much while still you know get all the monies I want to get so we all split our workshop into the basic part just talking about how to just use our tender data X folder for free and then also just add Network data to calculate the optimal frequency the second part we'll more talk about the methodology we have been seeing using our data warehouse to manipulate the impression level data so for the basic part we want to start a conversation like what metrics do you actually first track when you launch a new game yes perfect that's a bit quick so the first thing you have to track is
retention it's always a bit difficult first for people as is like if you know what's okay retention it's really hard to tell customer like okay if your retention always like 5% you really should think about something else like for day one but we know people treat everything like their baby it's like if I haven't about treated as a baby but you know sometimes it's sad to realize the truth we only have day one five percent retention it's Farias need to do something else the second one is like after your final retention you need to find out your cohort date and revenue which is called like time value LTV so this is how our dashboard looks like you can add the metrics put whatever you want so you can also put ROI rows anything you want when you add to like maybe 100 columns this gesture would look really ugly so just don't do that but the thing here
retention rate always has a direct correlation with impression per user this is something we plot we realize it's always true like when you annoy your users too much your retention rates would drop it's also like a normal thing like no one wants to watch 1 million adding 10 minutes but we are trying to figure out what the optimum point for ad frequency and then we realized actually we can plot a 3d plot so imagine you actually have set access and it's a 3d plot so you can plot your LTV value and when it's reaches the highest one that's your cutoff point and then in terms of how to use that chart or like how to plot that we can discuss after the talk either any of your bi tool will work either tableau periscope or anything so in order to
conduct analysis you need to pull some data and this is how data X folder looks like it's really start up like it but it works you can get the ending metrics you want there's a metrics and you can select anything you want and after you get all your data you can plot into our spreadsheet we'll share this Brushy later with a link it's for free and then there would be one tab where you put the data you download from there that's folder and this sheet is like where you can do your test so here we just want you to focus on the column intend to show X ad per user and this is where you can adjust a number to conduct your test and here is some test we did without customer here we change the name of the app because obviously we can say who they are but this is a F our founder produced called Fox a what personally I don't think it's a good one but it works for testing purpose intend
to show X adds this column is something we play with you can decide how many as you want to show user and a left part you'll see all the days are like two days apart and the reason for that is like we need to wait for day 1 retention so you cannot do it every day because then in essence you won't have a zero plus day 1 and this choice basically trying to say in this test we find out with our customer when they try to increase till 10 ads per user there you will see the total LTV actually drops the last column it drops right like three dollars but if we only measure the column next to the this column e yo see like I'll actually add revenue per user still increased by 2 cent this is a part where you need to I try to have a
rationale like when you show more ads your retention drops that's why the total user per 10 user drops so it's either you want to go down on this more ads and then maximize all the ads to get this ad revenue per user metric goes up or you can just focus on day 1 revenue and you see actually drops so it's personal taste I we personally think like people should focus on the last column but it's down like open for discussion because there is no way so here's a link for the scratchy I would say it's not beautiful but for any question or any like technical I you should encounter with the data X folder we are always here to help or send us an email anything so here the second part is a pro part we're gonna use impression
level data so we realize there are five kinds of analysis people usually do and usually you can get maybe each of them in ad network but you cannot get all five of them and duty is like actually we need all five of them to actually make a decision so here's the first part the impression level data we have in our data warehouse but not everyone has the time to you know to figure out how to write a query or like what does each color actually mean so what we provide is like we just produce the priorities for you so that you can run analysis it's something always ongoing because they're always something someone wants to do something different but we're relatively flexible so feel free to as though so the first part is like with the pro part because you have the data warehouse you can drive around the query to see
how many as you have been currently showing your users this is only one line not that interesting the second part is like determining the next like now everyone's doing rewarded video should I also do that with their warehouse you can also directly plotted line with these great things you can start to plot the format with per as user as for per user really difficult to say on this and so in this chart you'll see oh actually I show my vendors are increasing and the next thing you want to check site does that actually generate me more money oh is it just a waste of time to increase the banners and here you see is actually our real data but it's only for one app so maybe it's like also something we need to talk about so you'll see actually interstitial performs much well so that means like for each ads my interstitial is have a better performance and banners is just
like something slightly not that interesting and the four part with our data is something I plot in tableau you can see the revenue per del by country so here you'll see for example United States the dot is so tiny but wise that is just simply because a daily active user the denominator is quite big so even you have a lot of money but you have too much of population that that would become small so you'll see actually in Central America those starts become there is something really interesting to observe and then decides I which come country of region you want to prioritize when you launch your campaign why is this graph stopped on Taiwan is simply because I'm from Taiwan so I was tracking my country first no this one is also really interesting ones like we also start to calculate the variance
across the after and why is that because actually one of our comfort co-founder used to work in an investment thing so he always thinks like company is actually like an investment not everyone wants to buy I don't know not everyone wants to buy bitcoins some people just want to invest in Ireland so in this sense like we realized actually for US or Japan their parents are quite big but in this sense it's like you can always help down those whales while you actually have impaired really high risk well some countries like for example stop every car or like some other country like we usually not that interesting and they actually have a really low Ference meaning it's like you if you invest in this country the fairings is quite low so you don't impair them much of reason so because in general sense you don't put yourself into a high fluctuation investment but
as what you prefer it's based on personal taste some people just love to buy bitcoins so it's personal taste and the last part is like something thanks to our lovely colleagues who produce we start to plot the ECP and DK curve for customers who have impression level data this chart only shows partner 1 and partner too but in real life everyone will have like 10 at network channel and stuff so in real life this chart is really messy but what is interesting is like in real life we actually see usually when it's like impression number one the first ad you show to a user all of bits are relatively closed so in this and see both partner 1 and partner too late bid around $26 but when the more ads are showing you see partner two are kind of weak but there will be also cases for
example like after impression number 1 hungry actually partner one stops feeding so it's something really interesting to see how your network actually is trading you and then whether you want to prioritize certain network all this all this analysis and everything's we don't charge anything it's just simply if you have impression level data in your data warehouse which we also help HS will do it because we also like to see what is actually happening in the industry solo last part is the bonus we haven't really CPM benchmark for last year we intend to do it at a first quarter of this year which means people watch and here's a a CPM across the countries from our data
last year the general sentence is like [Music] now you invest in China there still cry seems to be a quite higher ECP unquote but if you look in the total sum of ad revenue it was like which country makes me the more money in still USA is always there they still make 10 times more than any other country so in general sense is like maybe because now China is growing you don't still don't have that much of user in your company so when you divide the lower denominator your current user is not that much you have a higher average of eCPM but if you are talking to the toto some USA is still growing and it's still really strong and that's the sharing for now any question you can
always send me an email or if you're afraid of email privacy you can send me a signal text and that's a any questions Oh Priya microphone to you I like the exercise so I do Thank You Oscar the eCPM at the last the average across what networks no it's so it's like for example this old user in China so that's why we think that's why it's a huge jump because now people just start to monetize in China so if you look at a total user in China it is in our own data warehouse compared to the total users in US us still have much more so this is a whole just data that you collected there yes so it doesn't differentiate and they work but if you want we can always run the the
splitting and network is it's just simply pull one column so I've got a second question that's down to level of impressions so you can actually split the ec game across every impression serve so the question here is more like because usually a network wouldn't show this data to the user we also don't know until now we have this data so we can start to plot the impression per number like oh this is our first ad and that's observed each and networks performance yeah yeah so in terms of mediation yeah if you pull data from ion source the one day mediating then networks can you cross compare them to pull the data from directly from the network I think Chris now we ingest data the current impression level data is coming from the mopar event Kobach it depends on whether
they split this into marketplace or mediation but usually they do split but in this sense we can talk about more details if late in split in certain network thanks yeah no problem much I think it was interesting particularly the base that you had comparing rewarded interstitial and banner I mean I have a long history of being involved in rewarded I'm wondering particularly if it's about the nature of the changing kind of usage of those ads in in the old ways of using rewarded ads it was a design technique it was something that players actively wanted and they chose in particular points of play but in the hyper casual scene that's not really the case that you you know really have the time to get people to step away from my view what do you think that might be why you're seeing a lot much lower return from rewarded than you would say interstitial this particular site exactly I'm so here just for one episode we don't want to make a
general like statement but it is interesting to see because now everyone's like rewarded video times 10 okay so it's just want to portray like it's not for every of internal sense in day to reward afeder performs really well but it's just not for every as it depends on you have an ad like that's like Fox a what which is not a really interesting game then like maybe makes to be adjusted yeah well I think is in but it is interesting I think it would be good to get this kind of I mean other people in the room who've had experience trying to use rewarded inside the hyper casual type or social type games anyone tried that so what would you mind if I ask you what your experience was that is it is it something which is useful or do you see a much lower take of them you might see in another game format I'll bring the mic to you yeah and so for us it was completely as you described not necessarily as
beneficial as very expectant so we are now looking at interstitials so my theory is that there's a there's a difference of behavior and I have a particular kind of view and I'd love to know what you think about this the what we're talking about with a hyper casual style end of gameplay is very much the fidgets spinner mindset it's the it's I need you satisfaction adhere do it now do it now do I do now dive do it now dude and I think in who takes you away from that flow he's potentially problem but the interstitial has this for me a magical quality where actually if I'm doing constant repetition like that I actually need to stop an industry should gives me time to pause that I don't have to choose it happens to me I put the phone down I go away come back pick it up again or whatever it might be is that does that fit with your
experience yeah I mean personally I I'm not sure I don't want to say something like I'm sure I'm not but what we see interesting is like for example like this plug we plotted with rewarded video but if you plot it in interstate show you'll see it performs really differently so each net and network each ad format with this hoe DK curve will look totally different and you can prioritize your resource in the a network we prefer with the right mix of format that's what I think but yeah I think it's always the case though and I'm interested getting into a lot of people in the audience you have a similar experience because my feeling is that you know getting the right balance the the ability to click out you know to kill an interstitial and I'd love to know if you have you ever seen any data that shows playable ads versus just pure video in hyper casual as opposed to normal use personally it has anyone in the room seen that I know it's
in a difference in terms of behavior with say an interstitial that is pure video versus in this issue which was playable difficult to measure but I think I would measure it through looking my sources and I probably cohort it based on sources that are providing pure playable versus sources of providing pure video I mean does that make sense so I guess the first thing would be how do you measure the exit point on the network right so I want to skip I want to skip truly but if the expert is not there as an industry we are we getting the level of data that maybe we should after that I think we've got another Tony fifteen minutes or so yeah so yeah I guess like don't have much more context but I for any impression level
data feel free to discuss with us because it's still an ongoing thing and then impression level data is a lot of data to ingest and then finally thanks or engineers like we manage the ingestion part but now it's a time to discover also with users like how to make the most because we collect all these they all need to get something out or they otherwise there is no point so this is the other question in which Eric's offer did a fantastic article and of em talking about how he felt like the Harper casual game was dead one of his arguments was that the value of a hyper casual user compared to a casual user is problematic what particular example you use programatic yeah so when is looking at the value of a player they're incorporating in that value the IEP purchases of that but that particular player obviously you can track that but the issue then means I'm terribly
paraphrasing a very good writer so apologies for that but issue for me that means if are we seeing hyper cacher will becoming less and less valuable as a as a game for monetization and is that therefore making it harder and harder for us to find new content and and maintain revenues yeah yeah I mean personally I haven't observed like hyper cash it's like dropping heavily against compared to casual but with the plot you can also like you can also plot to as next to each other and then see a wetter certain and then work performs differently and also how your app if you hack Chua we have one hyper cacher in capture you can totally do so you don't hear particularly this ability to look at the decay curves yeah I think it's an exercise the you know is incredibly powerful I already applies to comparing different apps with monetization providers I think you know absolutely agree this is a
really phenomenal way to do it is everyone doing that kind of of analysis are you doing comparisons with your game and other games and comparing formats anyone doing that kind of analysis I'll take it another but this is maybe the thing is that we're always trying to find ways to innovate we're trying to find ways to adapt and so anyway on that note it hasn't already final questions I have a question about the use of revenue level data and you said on the slide by it's only 70 to 80 percent accurate it's not just because it's a new thing and it's only going to get better or or a very hard thing hard things blocking it yeah potentially getting there under presenter so the thing is like actually impression label data is in jester event callback so each impression level data will come for this dollar sign something maybe it's like 80 cents but if compared to the first thing
the first thing every hour we call an ad network API and then they will send this oh this is how much money you make for this company and in this country but this thing always comes first right because this thing we call an API in each hour so we receive the data from an hour for the per that hour for that date and company country or how much money you make and later we process the impression level dollar sign a TSN and when you sum up it never matched it's an ongoing issue like we're trying to figure out but we're just trying to portray the fact that in ever matches due to just one like a few specific networks who about what date or is it across the board everyone it's across because like you have this general number and then it's depending on for two more news days like multiple you have some mechanism to do this calculation send you all this impression for example apple only watched something yesterday at Tempe and this worth 80
cent but for some reason all the impression adds up it doesn't match the directly hourly data we got but it's a point where we want to portray also like this data impression as revenue might be important for you to prioritize for example at frequency but for general sense of how much you make this is what matches your invoice like yeah thank you no problem they watch she's you were flipping back I saw an interesting when I was what gonna wants aggression about earlier the curve both you know opting number of ads yeah bit further back this with the you know you've got the kind of linear curve that shows the frequency about yeah Oh youth optimal frequency that's it so I'm really interested by this one and again I'm gonna come back to reward it to a certain extent because my my impression or means my memory of rewarding is that that kind of it works in different way
and actually often if you in a cattle game if you don't have enough rewarded that's you get complained at is that still the case but that was always the case up to a few years ago and so with this optimum after you can see curves that you're drawing here do you know if it's just a general principle that you're applying and showing here or have you seen any data that shows that different types of ads have different levels of optimum frequency for now for all like for example banner real birthday we observe the centrum but it also depends on your own makes I personally think it's more like generic because it's what we observe so we also highly recommend it to actually we can also plot this for you like just plug a three dimensional graph and you'll see whenever your LTV is too high as you cut o budgets like here we are not sure whether it's easy to impress a day so we just decide to do this I think this is a
dark appointment the number of times I've other clients and said cut down on the ads and they didn't just check more in and the game died what was the price and getting people actually pay attention to their frequency and like not just in terms of the kind of retention rate in this sort of immediate but also the long-term retention right my impression is that if we don't pay attention to both the short term and long term retention rates we end up in big trouble that's hard to do in hyper cacher because our long-term retention rates probably 7 to 14 days 14 days is I probably the dream I mean it depends on the game obviously but a lot of games are very very much short-lived so I think knowing what you're looking at applying a common sense to this kind of mindset I think is gonna be really powerful yeah any last questions on that note I'm going to say thank you very much thank you and thank you [Applause]
you [Music]
Summary
Maximizing revenue in the hypercasual gaming sector requires shifting focus from short-term ad frequency to long-term user lifetime value. While conventional wisdom often suggests that increasing ad volume directly correlates with higher earnings, excessive ad exposure frequently triggers a decline in user retention. This attrition ultimately undermines total lifetime value, proving that aggressive monetization strategies can be counterproductive to the overall financial health of a title. Developers should prioritize the equilibrium between user experience and revenue generation rather than chasing marginal gains in per-user ad income.
Achieving this balance necessitates a rigorous, data-driven methodology centered on tracking retention and impression-level performance. By utilizing data warehousing to monitor eCPM decay curves, developers can identify the specific threshold where additional impressions yield diminishing returns. While rewarded video remains a popular format, interstitial ads often align more effectively with the rapid, repetitive gameplay loops characteristic of hypercasual titles. However, reconciling granular impression-level data with aggregate API revenue reports remains a persistent technical hurdle that requires careful oversight to ensure accurate financial modeling.
Ultimately, there is no universal benchmark for optimal ad frequency, as performance varies significantly across different genres and formats. A nuanced, game-specific strategy is essential to avoid the common pitfall of over-monetization, which can prematurely shorten a game's lifecycle. By continuously analyzing the correlation between ad load and player behavior, studios can implement sustainable monetization models that protect retention while maximizing long-term profitability. This analytical approach replaces guesswork with precision, ensuring that ad strategies support, rather than degrade, the player experience.

















Comments