
Tencent Holdings Limited demonstrated robust financial expansion during the first half of 2011, characterized by a 47% year-over-year revenue increase to RMB 13.08 billion. This growth was primarily fueled by the strong performance of Internet value-added services and online gaming segments. Despite this top-line success, the company experienced margin compression, with net margins falling to 34.8% in the second quarter compared to 41.4% in the same period of 2010. This decline was largely attributed to heightened administrative expenses, increased investment in research and development, and costs associated with the acquisition of a majority stake in Riot Games for approximately RMB 1.68 billion.
The company’s strategic focus during this period centered on transitioning toward an open platform model and diversifying its digital ecosystem through aggressive investments in e-commerce, software, and content. By June 30, 2011, the carrying value of investments in associates had risen to RMB 2.78 billion. To support these initiatives and infrastructure requirements, Tencent increased its short-term borrowings to RMB 8.15 billion through bank loans and USD-denominated bond issuances. While maintaining a solid liquidity position, the firm faced external headwinds, including regulatory shifts in the mobile value-added services sector and a broader deceleration in China’s internet user growth.
Geographically concentrated in the People’s Republic of China, the company continued to leverage preferential tax rates for its High/New Technology Enterprise subsidiaries. Operational scaling was evident in the workforce, which expanded to 12,904 employees, leading to a rise in total remuneration costs. Management remains committed to long-term shareholder value, evidenced by active share repurchase programs and the utilization of share-based compensation schemes to retain talent. Moving forward, the company balances these capital-intensive growth strategies against potential risks related to foreign currency fluctuations and the evolving revenue models inherent in its open platform transition.
Tencent · 2024
Tencent · 2024

Tencent · 2022
Tencent · 2021

Tencent
Tencent
Tencent
Tencent
Tencent
Tencent
Tencent
Tencent
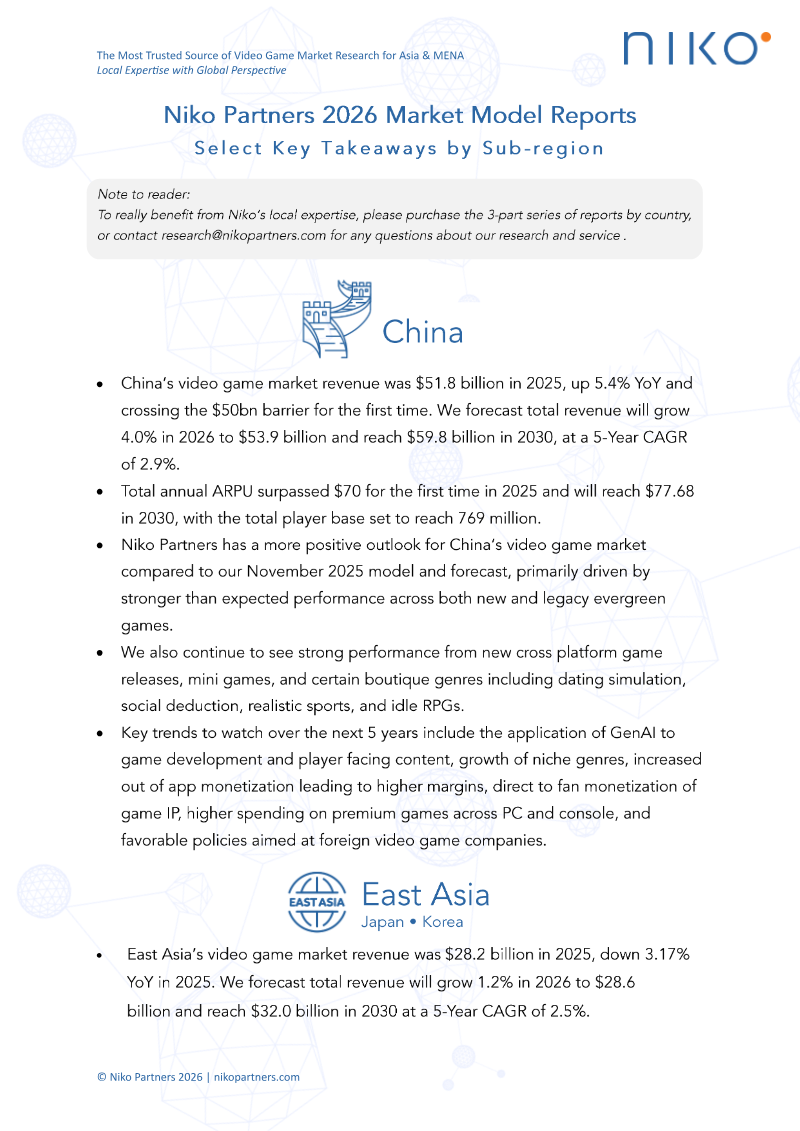
Niko Partners · 2026
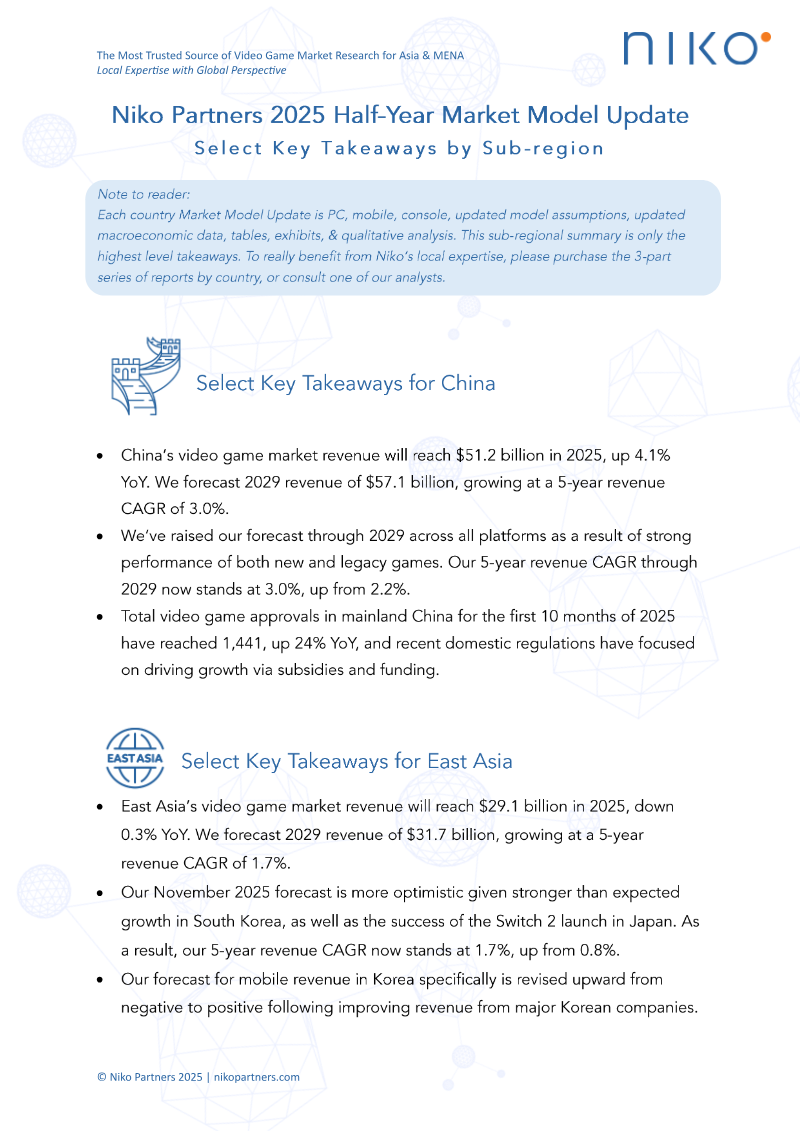
Niko Partners · 2025
Pangle · 2021
Niko Partners · 2020
Tencent
GREE
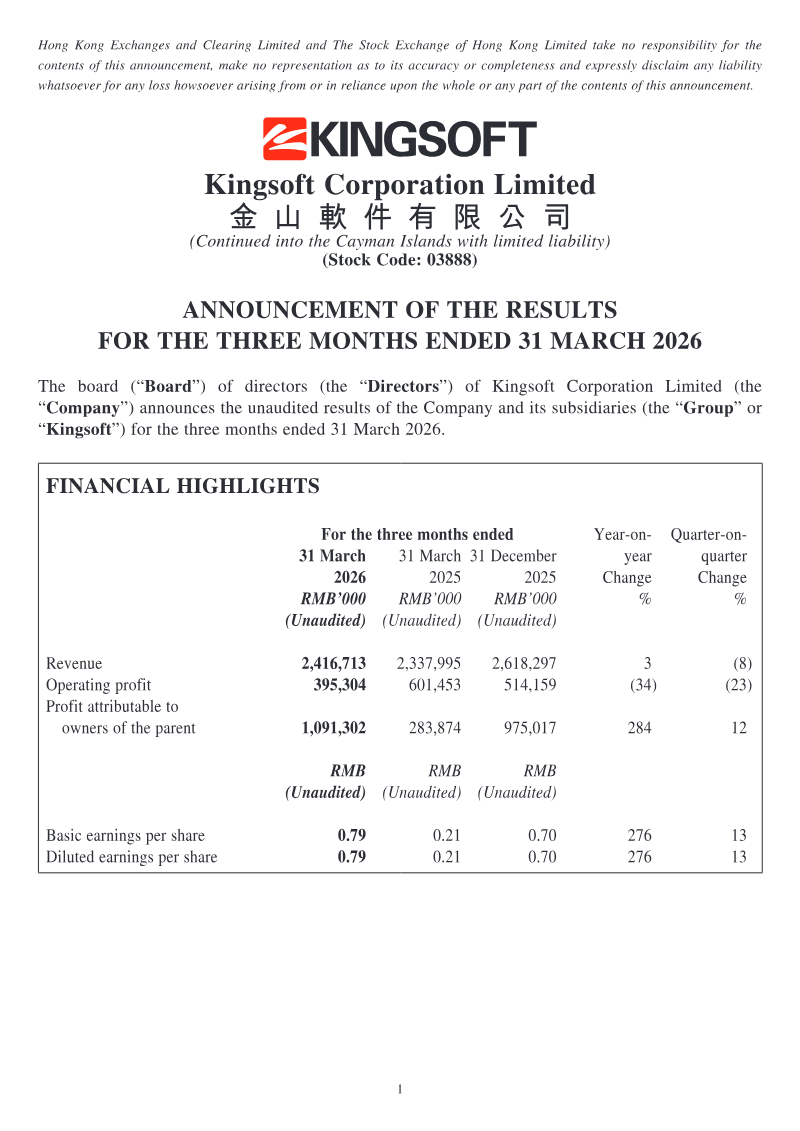
Kingsoft Corporation
Tencent
Giant Network Group · 2026

Archosaur Games · 2026

Niko Partners · 2026
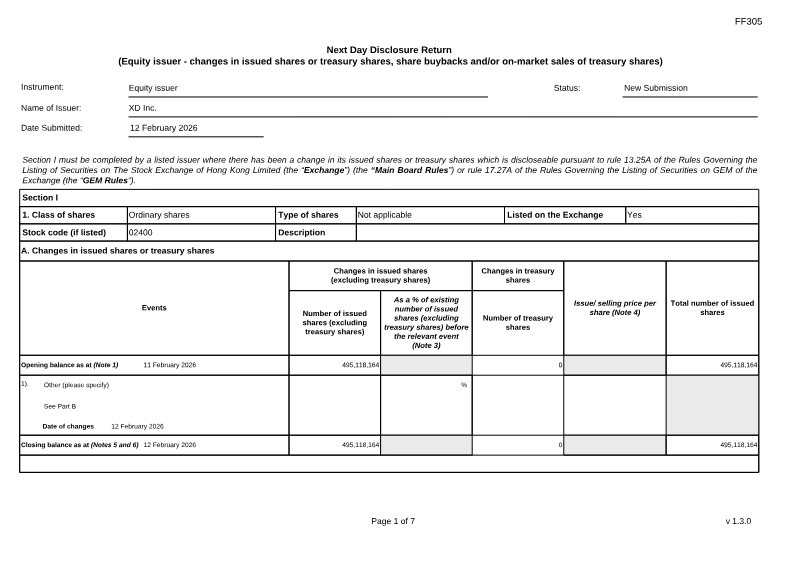
Stock Exchange of Hong Kong · 2026