Tencent Holdings Limited demonstrated exceptional financial performance during the first half of 2009, characterized by robust revenue growth and a significant expansion of its user base. Total revenues reached RMB 5.38 billion, representing a 77.5% increase over the same period in 2008, while profit attributable to equity holders rose to RMB 2.23 billion. This growth was primarily fueled by the strong performance of Internet value-added services, mobile telecommunications, and online advertising. Specifically, the successful monetization of licensed online games such as DNF and Cross Fire served as a primary catalyst for second-quarter gains, helping the company maintain a healthy net margin of 41.8% despite rising operational costs associated with bandwidth, revenue sharing, and research and development.
The company’s operational scale grew in tandem with its financial success, with active user accounts reaching 448 million by June 2009. To support this trajectory, the workforce expanded to 6,421 employees, leading to increased remuneration costs. Management maintained a disciplined approach to capital structure and liquidity, ending the period with RMB 4.06 billion in cash and cash equivalents and a stable gearing ratio of 31%. While the broader economic environment remained challenging, the company demonstrated strategic foresight by prioritizing long-term content quality, opting to delay the launch of two in-house massively multiplayer online games until 2010.
Corporate governance and shareholder value remained central to the company’s strategy throughout this period. Tencent continued to utilize share-based compensation schemes, including a 15-year extension of its Share Award Scheme, to incentivize staff and align employee interests with long-term growth. Furthermore, the company actively managed its equity through share repurchases and the exercise of options, while maintaining transparent reporting on tax obligations and financial liabilities. With major shareholders like MIH China (BVI) Limited providing stable backing, the company concluded the first half of 2009 in a strong position to navigate future market demands.
Tencent · 2024
Tencent · 2024

Tencent · 2022
Tencent · 2021
Tencent
Tencent
Tencent
Tencent
Tencent
Tencent
Tencent
Tencent
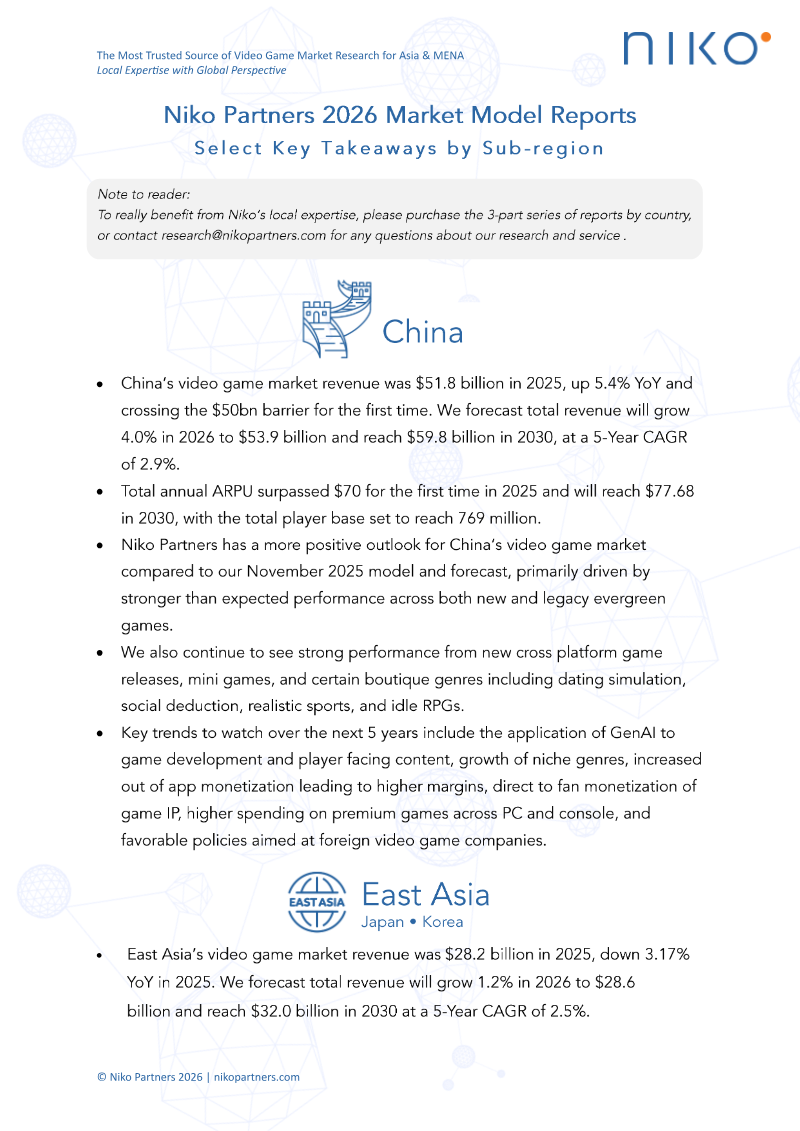
Niko Partners · 2026
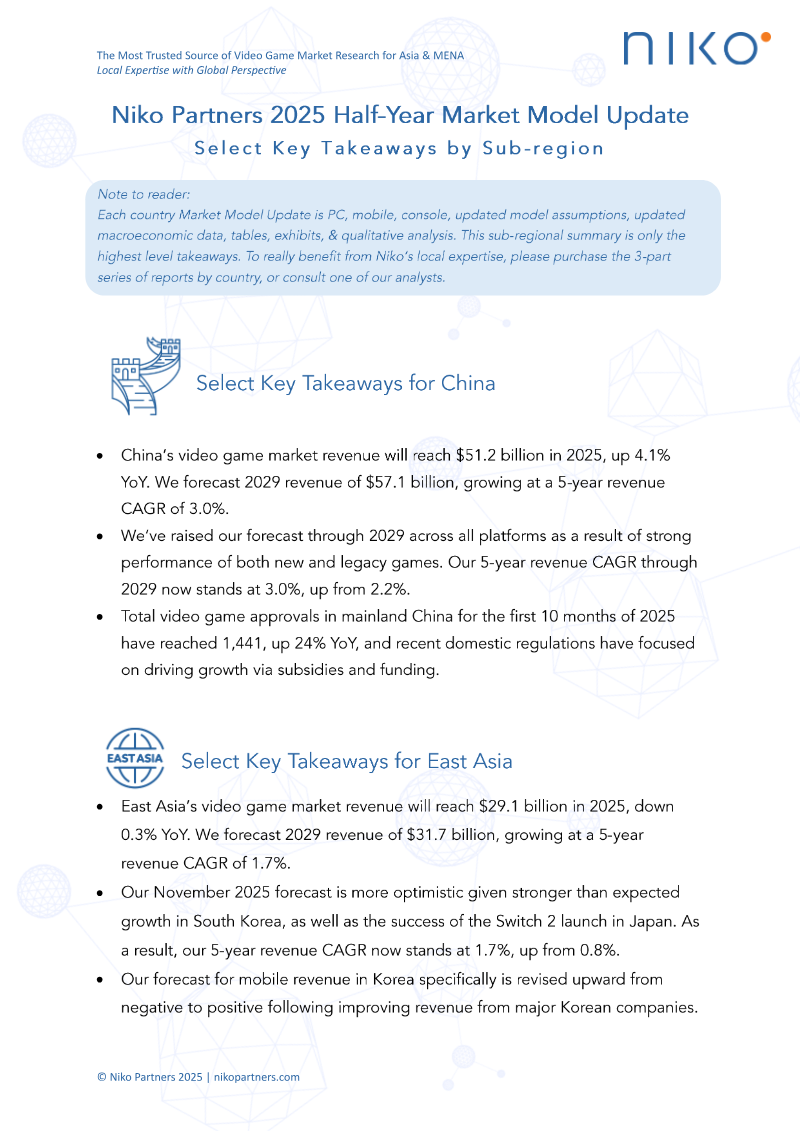
Niko Partners · 2025
Pangle · 2021
Niko Partners · 2020
Tencent
GREE
Tencent
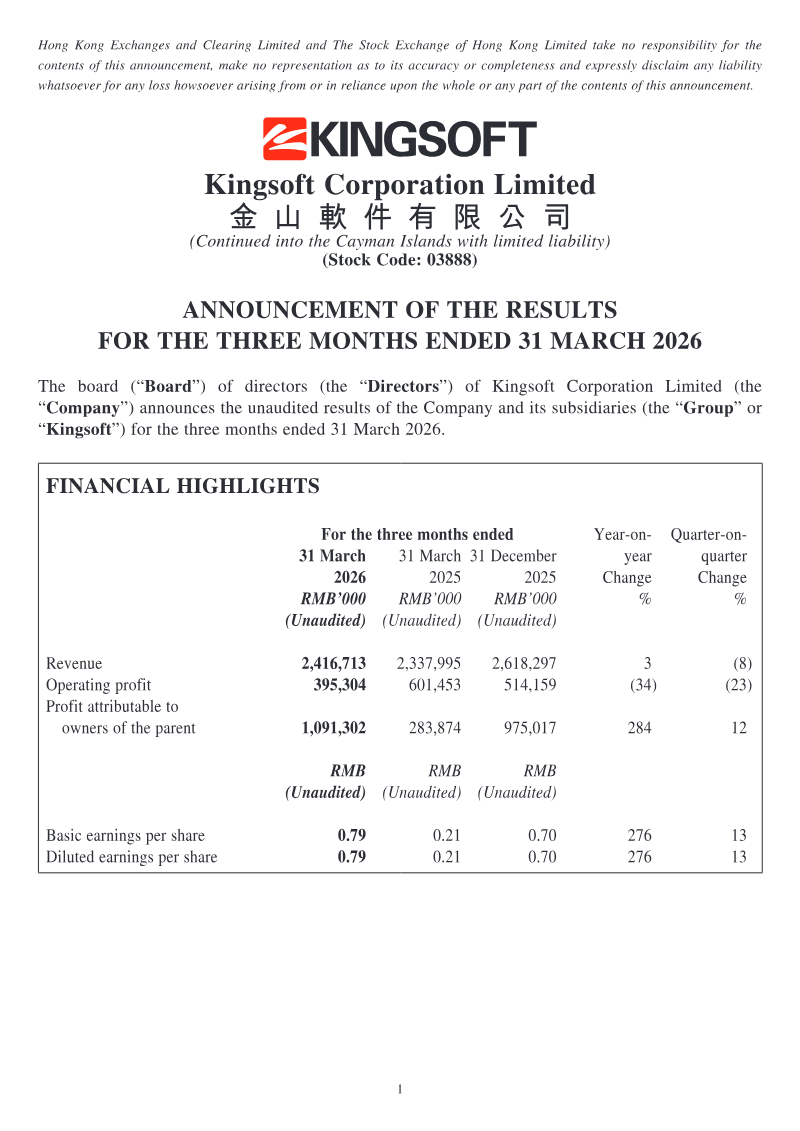
Kingsoft Corporation
Giant Network Group · 2026
Archosaur Games · 2026

Niko Partners · 2026
Stock Exchange of Hong Kong · 2026