Disney
CompanyUnited States
Documents about Disney
Square Enix Holdings: Results Briefing for the Fiscal Year Ended March 31, 2009
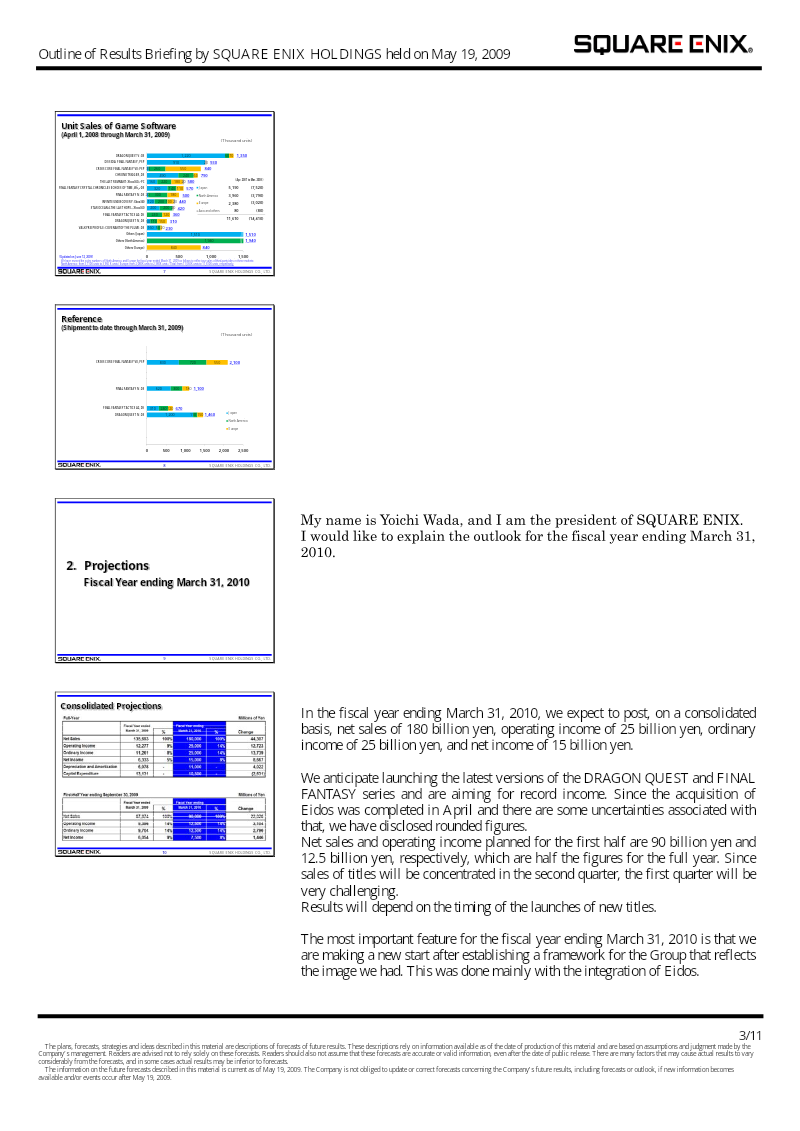
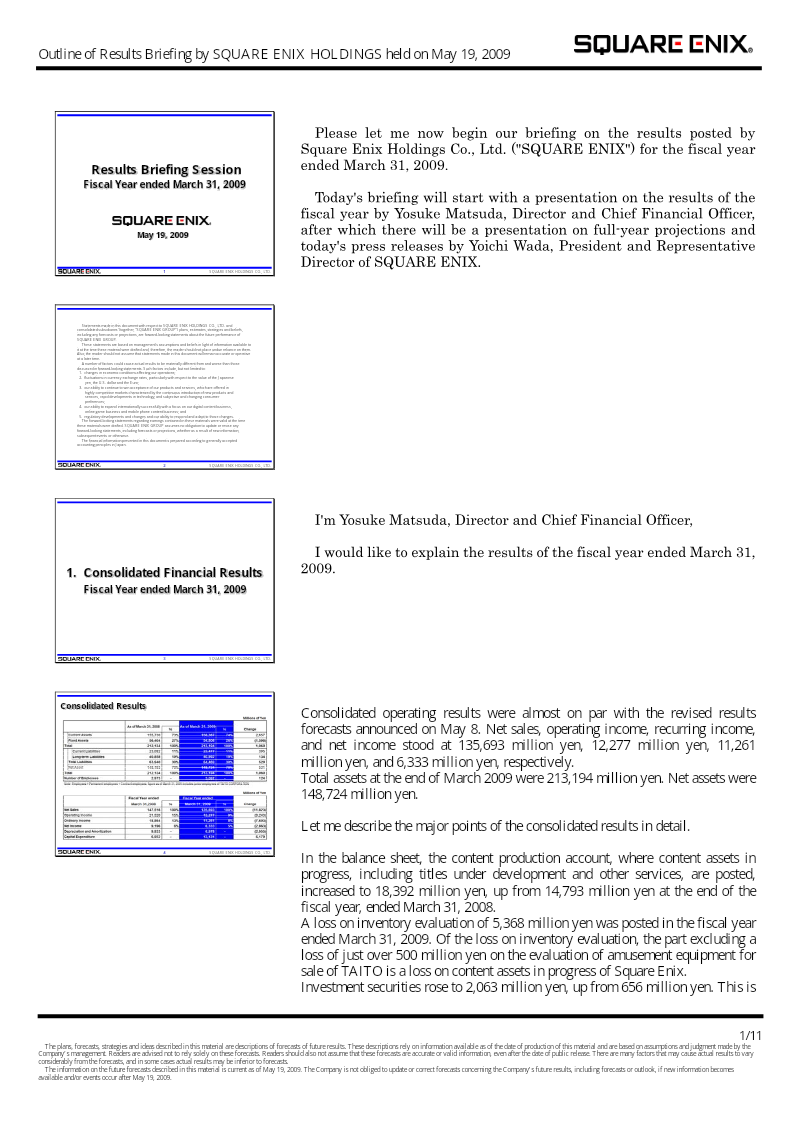
Square Enix concluded the fiscal year ending March 31, 2009, with net sales of 135.7 billion yen and a net income of 6.3 billion yen.
- Square Enix reported net sales of 135.7 billion yen and a net income of 6.3 billion yen for the fiscal year ending March 31, 2009.
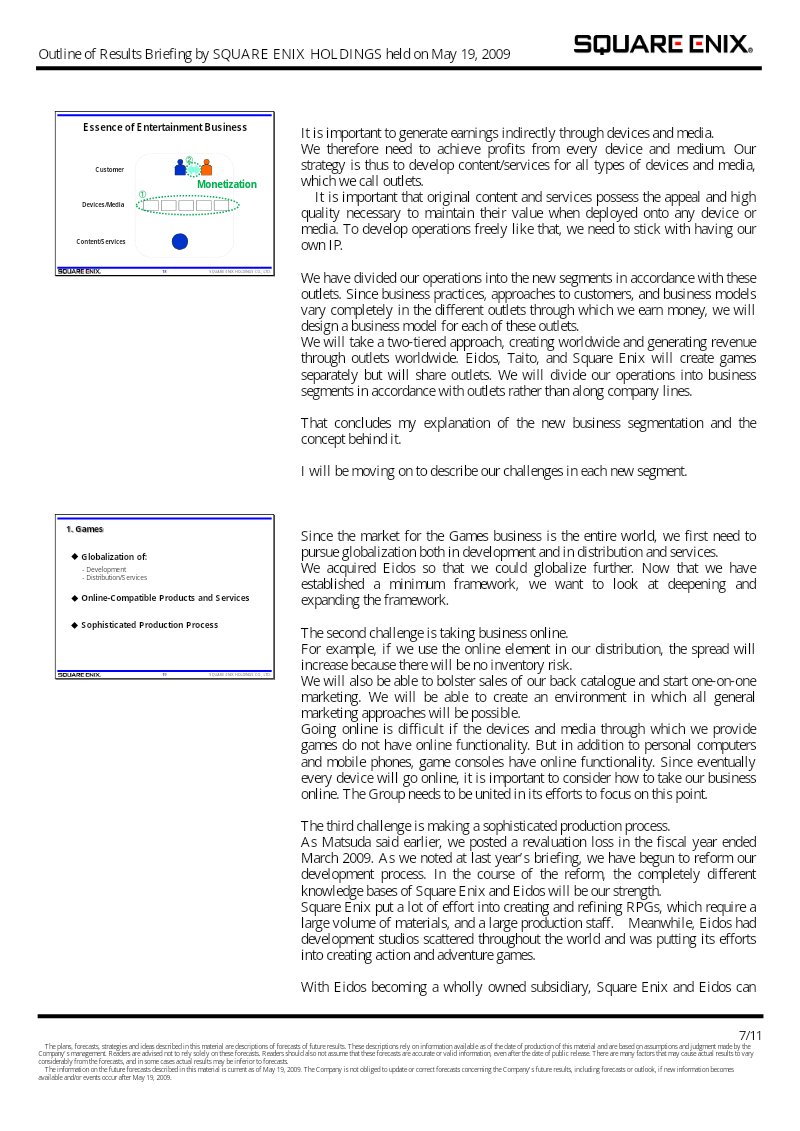
- The company acquired Eidos Ltd. to integrate international development expertise and accelerate its global market penetration strategy.
- Management is pivoting the mobile division toward smartphone platforms to overcome the technical limitations associated with previous porting methods.
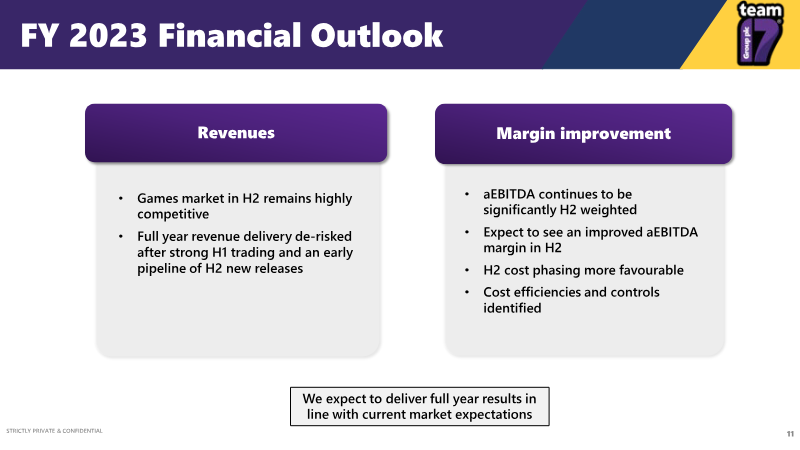

Team17 Group H1 2023 Results
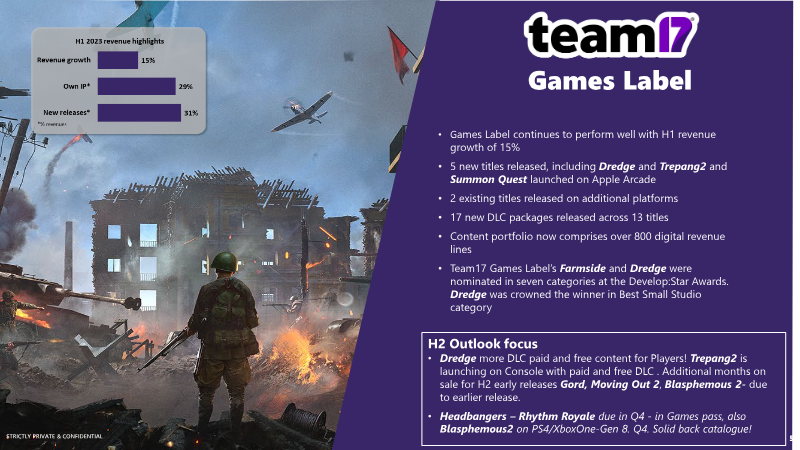
Team17 Group reported strong financial growth for the first half of 2023, achieving total revenues of £69.7 million, a 31% increase compared to the previous year.
- Team17 Group achieved £69.7 million in H1 2023 revenue, representing a 31% year-over-year increase.
- Adjusted EBITDA declined to £16.5 million from £18.2 million, driven by higher administrative and marketing costs, royalty payments, and shifts in sales mix.
- The back catalogue remains the company's primary revenue driver, accounting for 79% of total earnings.
GungHo Online Entertainment Consolidated Financial Results for the Fiscal Year Ended December 31, 2016
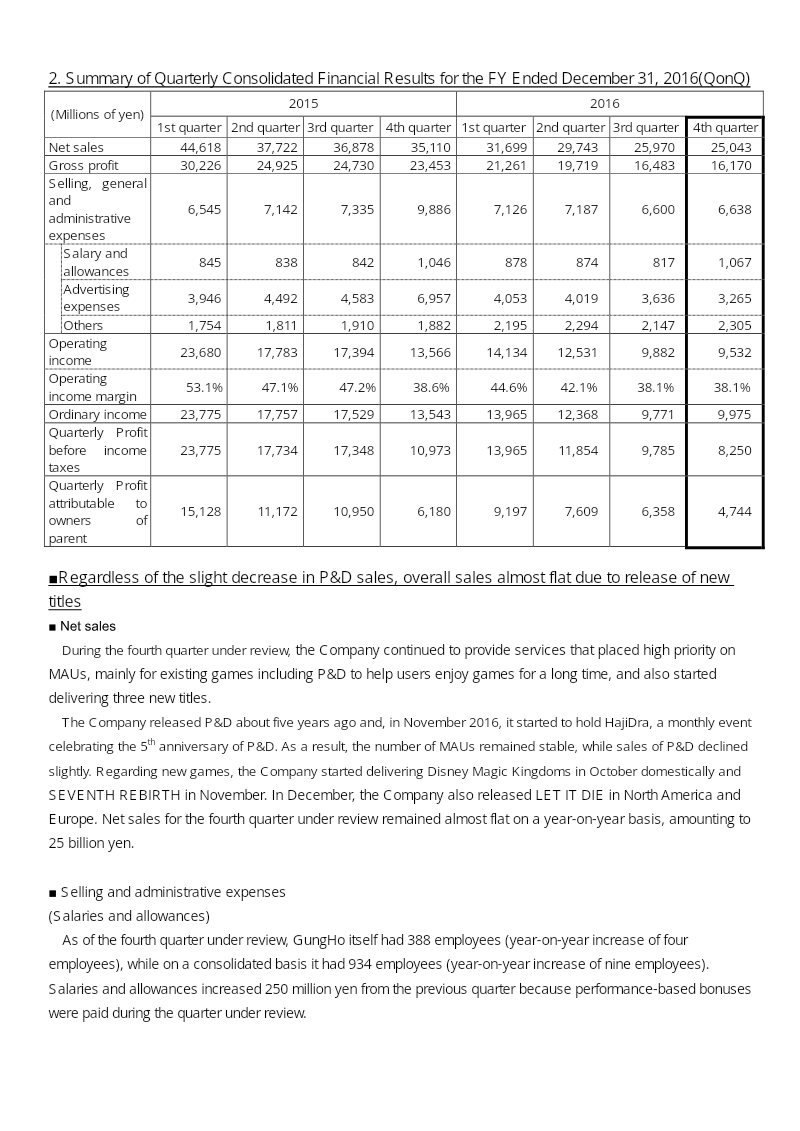
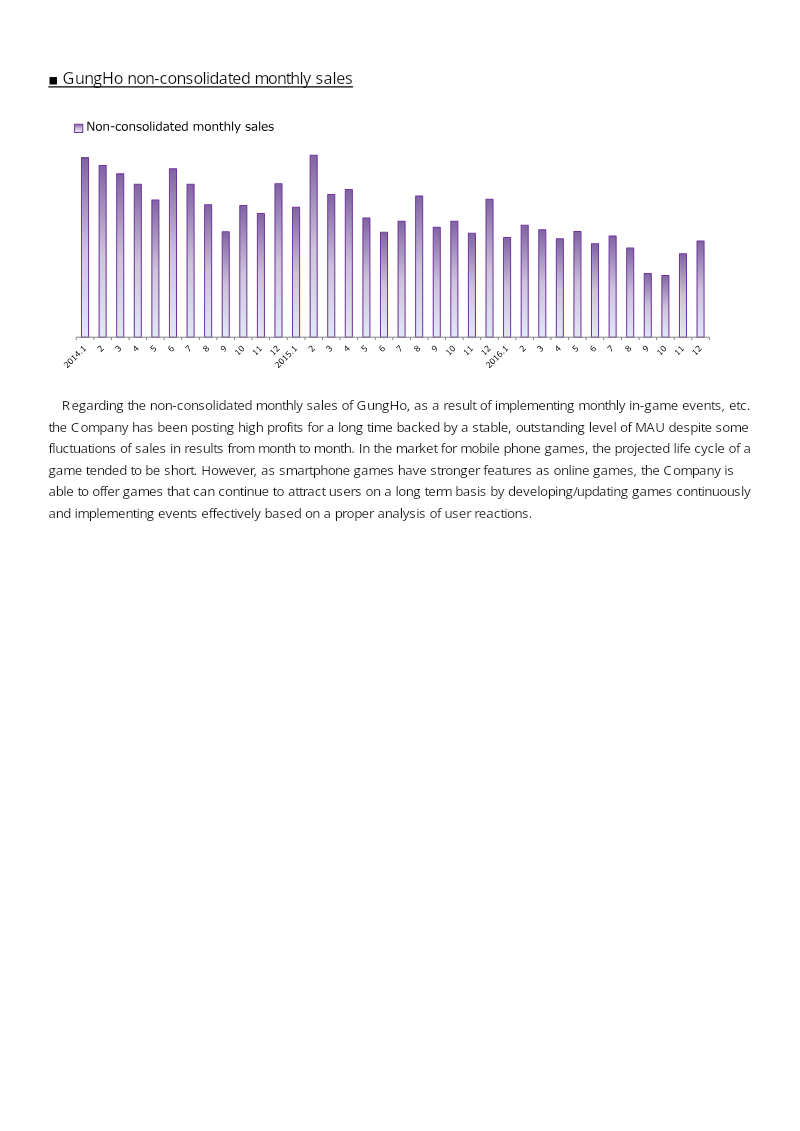
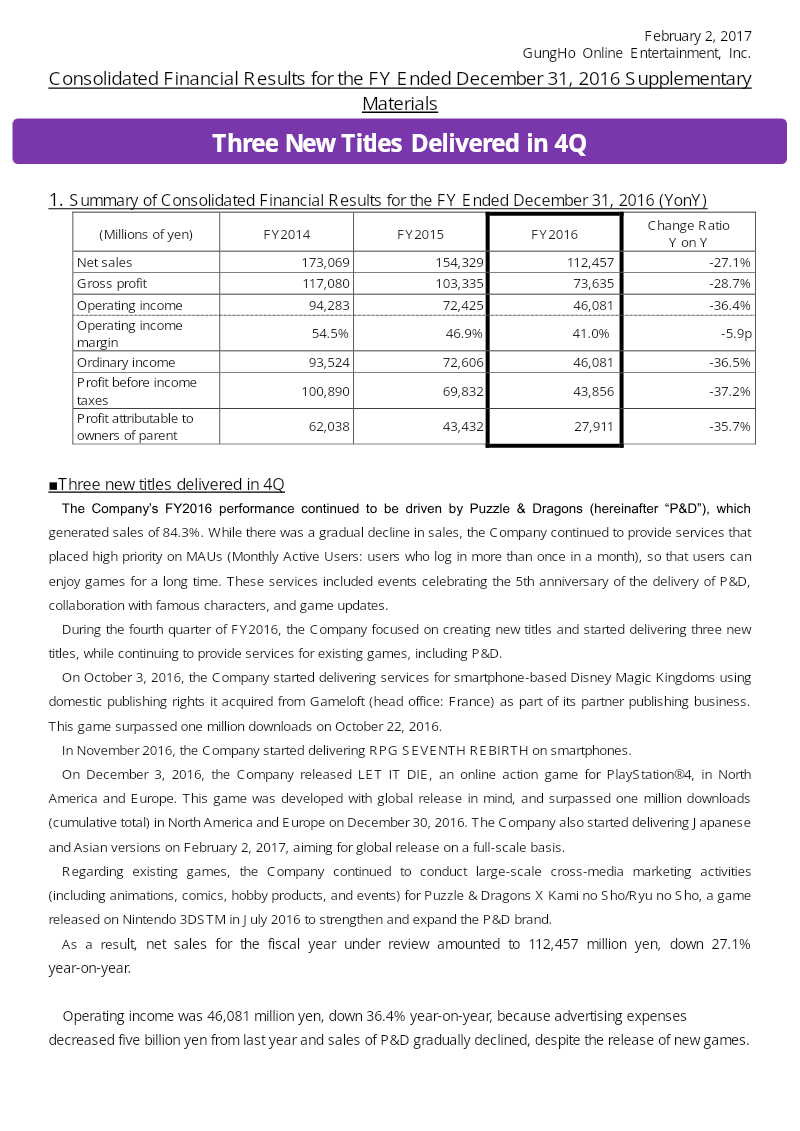
GungHo Online Entertainment’s consolidated financial results for the fiscal year ended December 31, 2016, reflect a period of transition characterized by a significant year-over-year decline in core revenue alongside a strategic pivot toward diversifying the company’s portfolio.
- GungHo Online Entertainment reported net sales of 112,457 million yen for the 2016 fiscal year, a 27.1% decrease from the previous year.
- Operating income fell by 36.4% to 46,081 million yen, attributed to the maturation of the flagship title Puzzle & Dragons and a 5 billion yen reduction in advertising spend.
- Puzzle & Dragons remains the company's core asset, accounting for 84.3% of total annual sales and reaching over 44 million downloads in Japan by year-end.
FY26 Financial Results: Evolution and Growth
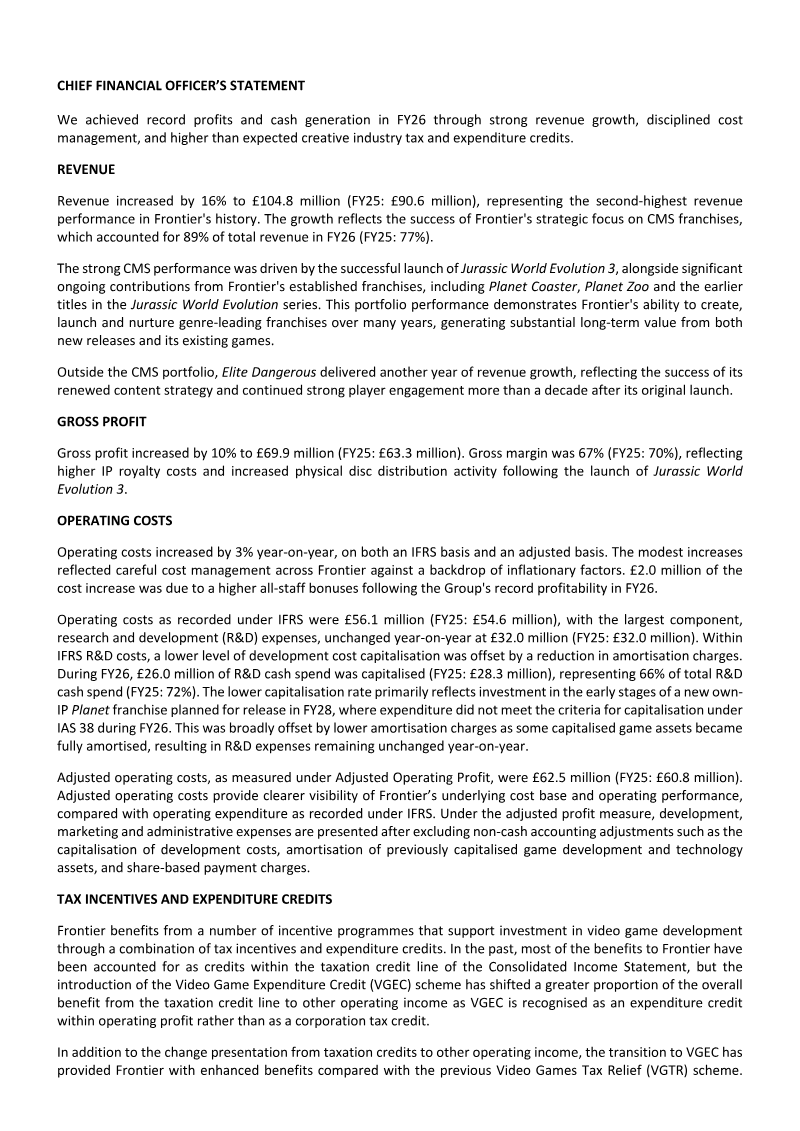
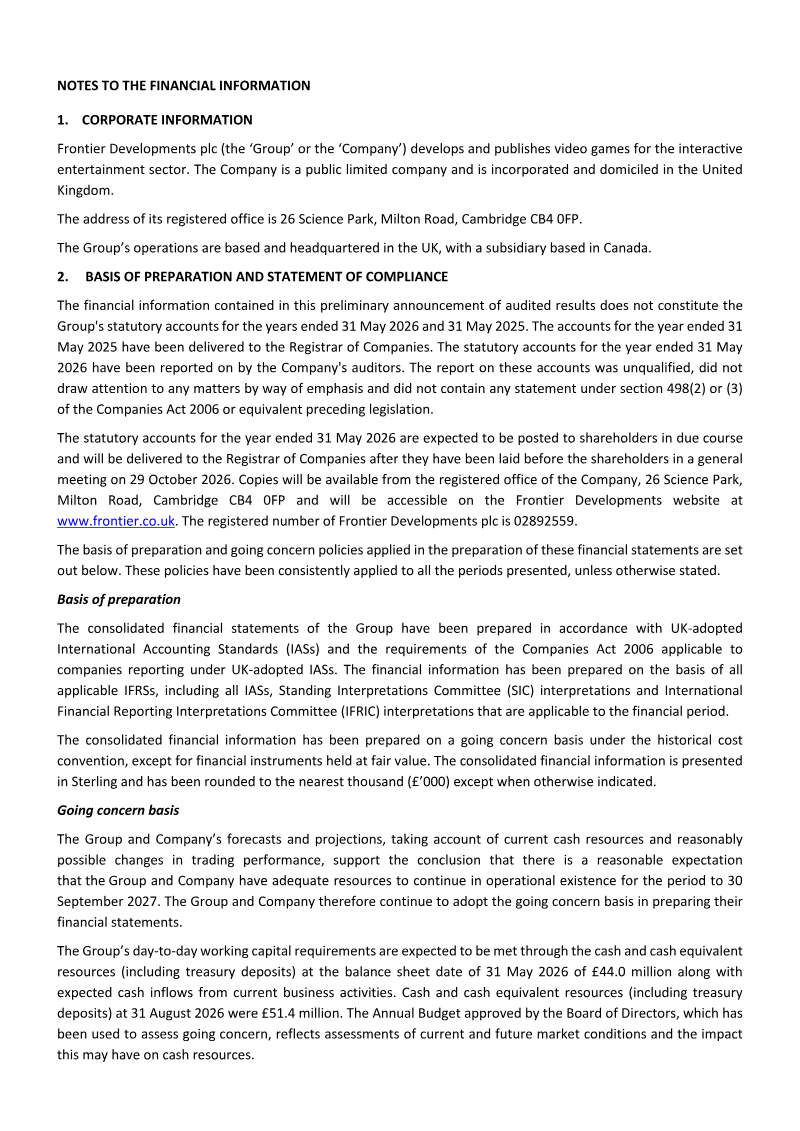
Frontier Developments achieved record-breaking financial performance in fiscal year 2026, characterized by a 16 percent revenue increase to £104.8 million and a 62 percent surge in adjusted operating profit to £21.4 million.
- Frontier Developments reported record FY26 revenue of £104.8 million, a 16% increase, and a 62% surge in adjusted operating profit to £21.4 million.
- Basic earnings per share rose to 74.6p from 42.4p, driven by the success of the Creative Management Simulation portfolio and the launch of Jurassic World Evolution 3.
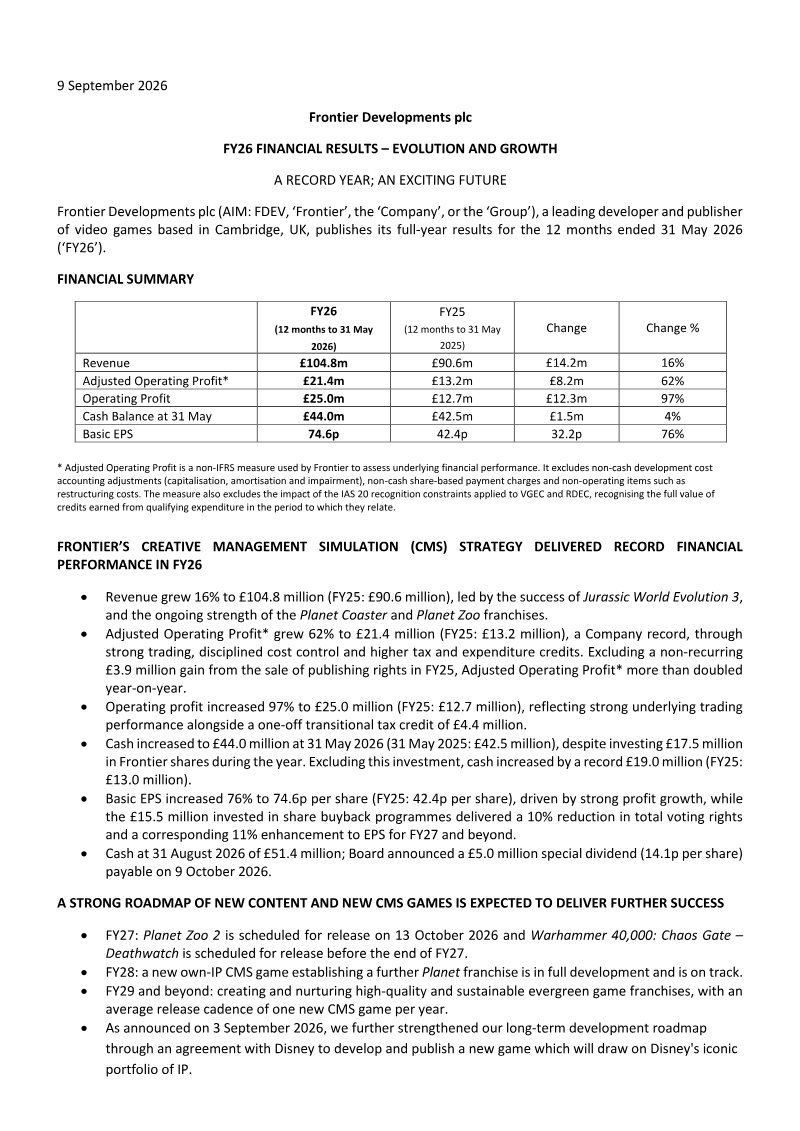
- The company maintains a debt-free balance sheet with £51.4 million in cash and cash equivalents, supporting a £15.5 million share buyback and a £5 million special dividend.

Notice of Annual General Meeting: 2026
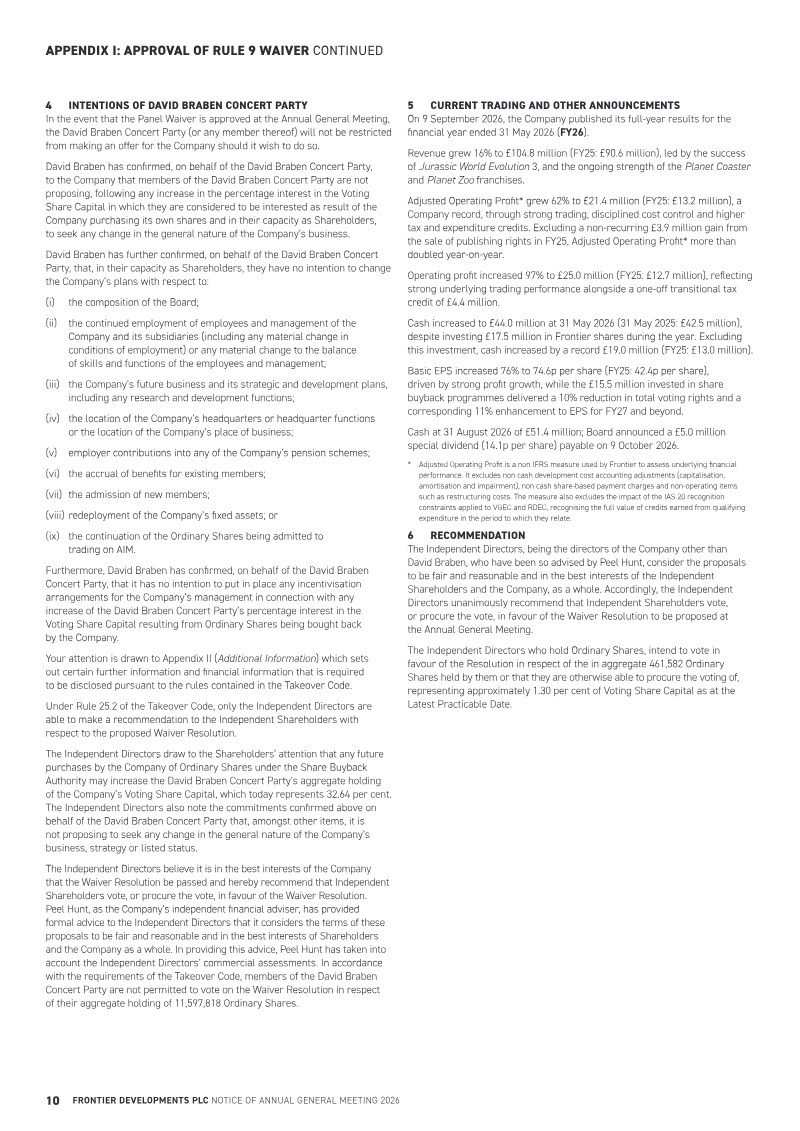
Frontier Developments PLC is convening its 2026 Annual General Meeting to formalize corporate governance structures and ratify strategic financial initiatives.
- Frontier Developments reported strong fiscal year 2026 performance with revenue growing 16% to £104.8 million and adjusted operating profit surging 62% to £21.4 million.
- Founder David Braben will transition to a non-executive role effective October 2026 as part of the company's leadership evolution.
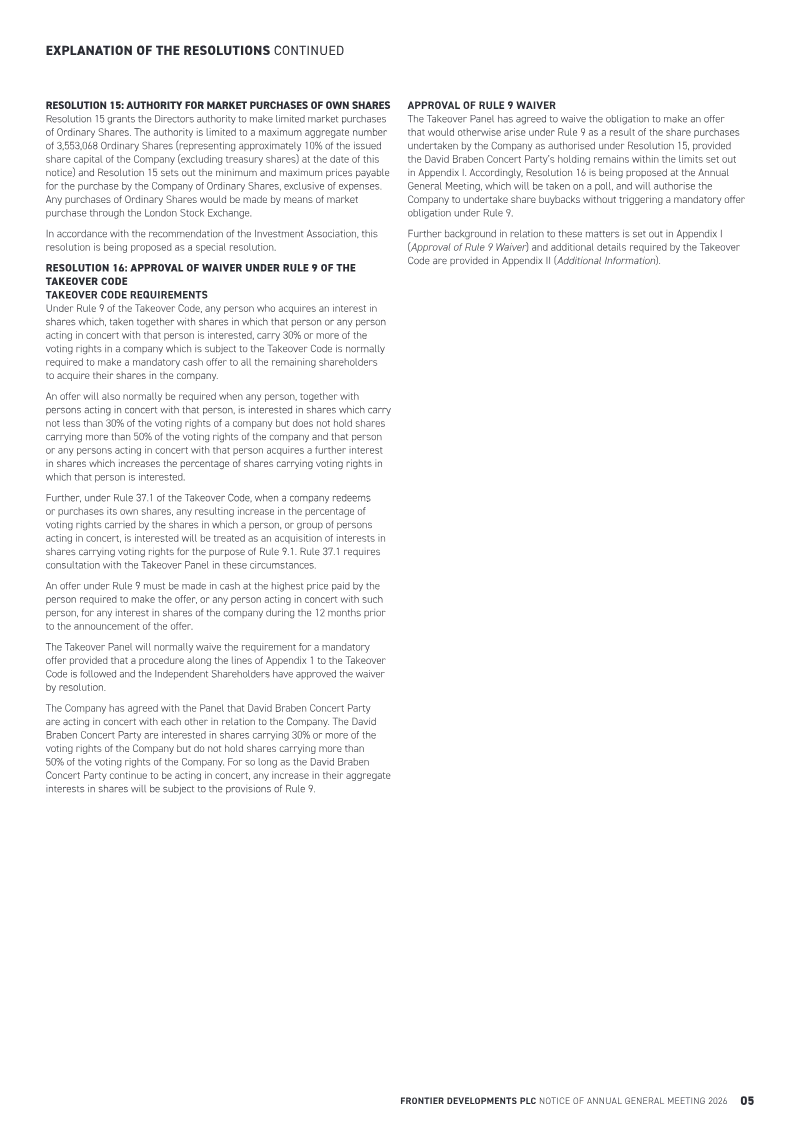
- Shareholders are asked to authorize a share buyback program of up to 10% of issued share capital, totaling 3,553,068 ordinary shares.

Playtika Holding Corp. Second Quarter 2026 Results
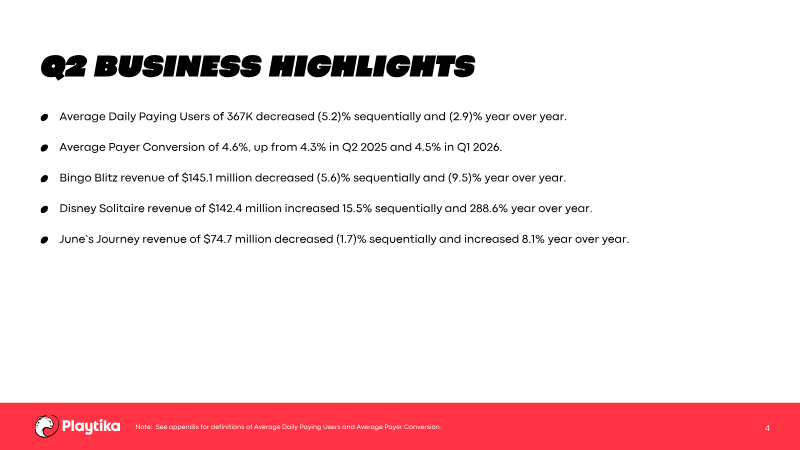
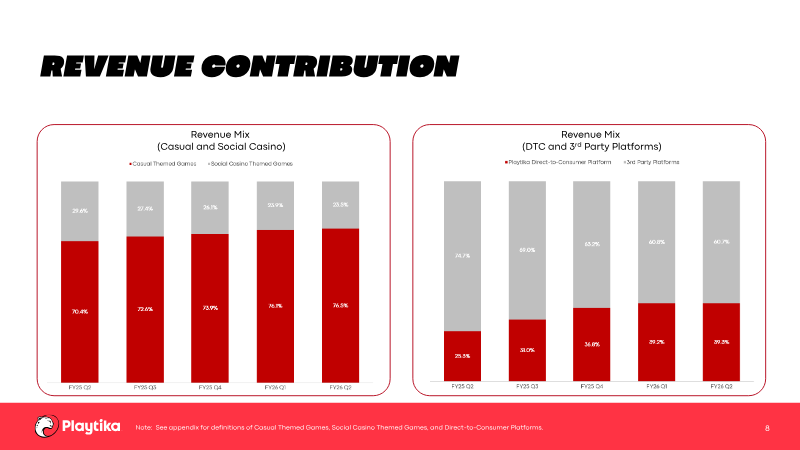
Playtika Holding Corp.’s second quarter 2026 financial results demonstrate a return to profitability and improved operational efficiency, despite a slight sequential decline in total revenue.
- Playtika returned to profitability in Q2 2026 with $48.0 million in net income, recovering from a net loss in the previous quarter.
- Total revenue reached $731.1 million, marking a 5.0% year-over-year increase despite a 1.8% sequential decline.
- Adjusted EBITDA grew 23.4% year-over-year to $206.1 million, resulting in an improved profit margin of 28.2%.