Reports in the Market (Overall) category.
The mobile puzzle game market is undergoing a significant structural evolution, characterized by a shift in product models and a notable rise in hybridcasual gaming. This analysis, covering global data from January 2018 through June 2023, examines the performance of various puzzle sub-genres, including swap, blast, chain, and pair mechanics. By leveraging store intelligence and download estimates from the Apple App Store and Google Play, the findings highlight how developers are increasingly integrating meta-features and diversified monetization strategies to sustain revenue in a maturing landscape.
A central finding is the remarkable growth of the hybridcasual product model, which saw a 430% increase in revenue between early 2022 and early 2023. While traditional casual games continue to dominate overall market share through consistent operations and robust meta-features, they have experienced modest declines in both downloads and revenue. Conversely, hybridcasual titles—particularly within the pair sub-genre—have successfully captured user interest by blending accessible gameplay with more sophisticated monetization tactics, such as in-app purchases, which were previously less common in hypercasual-leaning segments.
The data indicates that sub-genres like pair have emerged as high-growth areas, with hybridcasual revenue in this category rising from $7 million in the first quarter of 2022 to $40 million by the first quarter of 2023. Meanwhile, other established sub-genres, such as merge and physics, have seen download declines as their reliance on hypercasual models wanes. Successful top-tier games across all categories now frequently employ a combination of live operations, season passes, and social clans to drive engagement. Ultimately, the puzzle market is moving toward a hybrid approach, where the simplicity of casual mechanics is increasingly supported by the deeper monetization and retention frameworks typically associated with mid-core titles.
Steam wishlists serve as a critical metric for predicting commercial success in the video game industry, functioning as a primary indicator of pre-launch momentum. Data analysis reveals that wishlist distribution is highly top-heavy, with a significant majority of games launching with fewer than 10,000 wishlists, while only a small fraction of titles achieve the 100,000-plus threshold required to reliably forecast a breakout performance. There is a strong 70% correlation between pre-launch wishlist counts and first-month unit sales, particularly for titles that surpass the 100,000-wishlist milestone.
Genre-specific trends highlight that action and adventure titles consistently generate the highest levels of pre-release buzz, often benefiting from the brand equity and marketing budgets of AAA and AA publishers. Conversely, casual and MMO titles frequently rely on post-launch engagement, such as live updates and community building, rather than pre-release wishlist accumulation. Regardless of genre, the timing of a Steam page launch is vital; top-performing games typically establish their presence six to twelve months before release, utilizing a steady stream of trailers and development updates to build and maintain audience interest.
The findings are based on an analysis of games launched on Steam from March 2024 onwards, utilizing proprietary estimation models and industry data. The research emphasizes that while wishlists are not a guarantee of success for every title, they act as a essential barometer for market interest. For developers and publishers, the data underscores that early visibility and sustained marketing efforts are necessary to reach the wishlist tiers that statistically correlate with long-term commercial viability.
Achieving sustainable mobile app growth in a privacy-centric digital landscape requires a sophisticated integration of precise measurement tools and advanced advertising optimization. The primary objective of modern mobile marketing is to shift focus from simple installation metrics toward high-value user engagement and long-term profitability. By leveraging Mobile Measurement Partners (MMPs) in tandem with platform-specific optimization features, brands can navigate complex cross-channel user journeys, mitigate ad fraud, and significantly improve their return on ad spend.
Data-driven strategies, specifically those utilizing App Event Optimization and Value-Based Optimization, serve as the foundation for scaling performance. These methodologies allow advertisers to move beyond broad acquisition tactics, instead employing granular audience segmentation and real-time tracking to identify and retain high-value users. Case studies involving major global brands such as Burger King, Rappi, and Carrefour demonstrate that this technical synergy consistently yields substantial improvements in conversion rates and overall revenue. For instance, integrated campaigns have successfully driven multi-fold increases in return on investment, proving that technical precision directly correlates with commercial success.
The scope of these strategies encompasses global mobile markets, focusing on the intersection of social media advertising and third-party attribution. Success in this environment relies on a structured, agile approach that prioritizes diversified creative testing and consistent budget management. By combining the analytical depth of an MMP with the reach and targeting capabilities of platforms like TikTok, developers can effectively lower customer acquisition costs while maximizing user lifetime value. Ultimately, the integration of these technologies is essential for any organization seeking to maintain a competitive edge in the evolving mobile ecosystem.
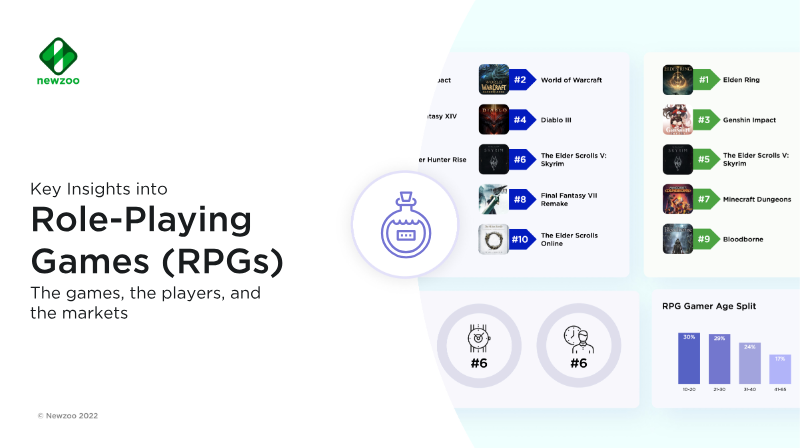
Role-Playing Games (RPGs) represent the highest-revenue genre in the global gaming market as of 2022. The genre is characterized by deep character development, party-based mechanics, and progression systems centered on quests and combat. While RPGs are played across all platforms, they maintain a strong presence on PC and console, where they consistently rank among the top genres for monthly active users.
The demographic profile of the RPG audience is predominantly male, accounting for 58% of players, and skews toward younger age groups, with 59% of the player base falling between the ages of 10 and 30. Engagement patterns reveal that RPG players are highly active, averaging 18.8 sessions per month. The genre also demonstrates significant cross-genre appeal, with high player overlap in the adventure, shooter, and battle royale categories. High magical fantasy remains the most popular thematic element, utilized by 63% of the player base, while skill and talent trees serve as the most prevalent gameplay mechanic.
Monetization within the RPG space is dominated by pay-to-play models, which reach 97% of the player base, followed closely by in-app purchases at 90%. Geographically, the United States and Japan lead in monthly active users on PC and console. The genre also maintains a robust live-streaming presence, generating 205 million hours watched across platforms like Twitch and Facebook Gaming in June 2022. These insights are derived from data covering 37 markets, excluding China and India, and utilize proprietary gamer segmentation to analyze player motivations, viewing habits, and engagement metrics across the broader gaming ecosystem.
The Global Games Market Report 2025 projects a steady expansion of the worldwide player base to 3.6 billion, with payers rising to 1.6 billion and total revenue reaching $188.8 billion, a 3.4 % increase year‑over‑year. Mobile dominates growth and revenue, contributing $103 billion (55 % of the market) and expanding 4.5 % YoY, while PC and console follow at 3.1 % and 2.5 %. The report notes that average spend per payer is expected to decline slightly through 2028 as the market matures, underscoring the importance of retention, innovative monetization and post‑launch content to sustain growth in an increasingly saturated ecosystem.
Geographically, the Asia‑Pacific region leads with a 4.2 % YoY increase, and North America remains strong for console sales (5.4 %). Key growth drivers include the launch of Nintendo Switch 2, continued success of live‑service titles on PC, and a shift toward direct‑to‑consumer monetization in mobile. Discoverability challenges and content fragmentation are identified as notable hurdles across all platforms.
Single‑player AAA titles released in the February–May window outperform those launched August–November by an average of 34 %, largely due to crowded holiday windows and cannibalization. Early Access titles that transition to full release within 4–9 months generate the highest new‑player lift, while staggered cross‑platform releases capture only about 13 % of the total player base. Player attrition drops sharply in weeks 2–5 and stabilizes after week 12, indicating that longer main‑story content (20–40 hours) and simulation elements help retain players over the long term.
The commercial life of single‑player titles is increasingly driven by post‑launch content, strategic discounting and community engagement rather than initial premium spend. DLC revenue shares evolve over a game’s lifecycle, with genres aligning to specific monetization models and subscriptions gaining influence on long‑term engagement. Post‑launch content is identified as the key determinant of discoverability, retention and profitability across a game’s back catalogue.
Methodologically, the report employs a top‑down, data‑driven model that blends proprietary engagement metrics (Game Performance Monitor, Steam data), public economic indicators and partner insights to forecast platform‑specific player, payer and revenue figures through 2028. The approach excludes taxes, hardware and gambling from revenue calculations and provides detailed platform‑by‑platform forecasts (PC, console, mobile, cloud, VR) alongside analytical tools for market segmentation, genre trends and post‑launch monetization strategies.
The survey of more than 3,000 global developers in 2025 reveals a gaming industry grappling with persistent instability while making modest progress on diversity. Layoffs have risen, with one‑tenth of respondents reporting job losses in the past year and 58 % worried about future cuts. Women and non‑binary developers now account for 32 % of the workforce, up from 29 % in 2024, and LGBTQ+ representation reached 24 %, yet white males still dominate at 66 %. Revenue pressures and market shifts continue to drive restructuring, underscoring the sector’s vulnerability.
Generative AI has transitioned from a niche experiment to an integral part of many studios, with 36 % of developers using it personally and 52 % reporting company‑wide adoption. However, enthusiasm has cooled: only nine percent of companies plan to expand AI use, and negative perceptions have climbed to 30 % from 21 %. Ethical concerns, intellectual‑property risks, and fears of job displacement now affect more than half of respondents. Internal AI policies have expanded to 64 % of studios, and optional use has become more common, though a small minority mandate AI tools.
Live‑service development remains polarised. While 42 % of studios already produce live titles, only 13 % intend to launch one next year. AAA developers are more inclined (33 %) due to potential financial upside and sustained player engagement, yet worries about market saturation, creative fatigue, predatory monetization, and burnout persist. Media adaptations interest 36 % of AAA studios, whereas internal pitch activity has fallen. Self‑funding remains the dominant financing method (56 %), though success rates vary across funding models.
Work‑hour patterns signal growing strain: the share of developers working over 50 hours a week has risen from 8 % to 13 %, and half of respondents now view excess hours as problematic. Union support remains robust at 69 %, with 58 % advocating industry unionisation, yet only 22 % have discussed it in the past year. These findings illustrate a sector negotiating between rapid technological change, creative ambition, and labour‑market pressures across diverse geographic regions and studio sizes.
The document presents a comprehensive analysis of the mobile match‑3 puzzle segment for Q1 2021, focusing on revenue performance, genre characteristics, and player motivations. It identifies the top five match‑3 titles—Candy Crush Saga, Homescapes, Project Makeover, Gardenscapes, and Toon Blast—detailing their market share changes, revenue per download (Rev/DL), and year‑over‑year growth. Candy Crush Saga leads with a 16.74% share and a Rev/DL of $11.27, while Project Makeover shows the strongest growth at 10.57% share and a Rev/DL of $45.51, reflecting its premium monetization strategy.
The analysis breaks down genre features, noting that Royal Match and Project Makeover exemplify modern match‑3 design: fast‑paced gameplay, quick animations, and a progression system tied to home or makeover themes. Monetization models emphasize consumable boosters, lives, and continue options, with special events such as guilds, recurring tournaments, and exclusive levels driving engagement. The document also highlights unique mechanics—bonus “no‑fail” levels, mystery boxes, and avatar customization—that differentiate titles within the subgenre.
Player motivation data from a US sample classify drivers into escapism, mastery, social interaction, and management. Match‑3 games score high on mastery (completing milestones) and escapism, while social competition scores lower. The report’s methodology relies on GameRefinery’s SaaS dashboard, aggregating download and revenue metrics across the US market for Q1 2021. Overall, the document underscores that successful match‑3 titles combine rapid core loops with layered progression and event systems to sustain high monetization rates.
The report argues that user‑generated content (UGC), artificial intelligence (AI) and cloud gaming are reshaping the industry by lowering entry barriers, democratizing creation and expanding cross‑platform reach. Data show that Gen Alpha and Gen Z spend a majority of their daily gaming time, with UGC platforms such as Roblox attracting 85 million active users and cloud‑gaming subscribers rising from 62.5 million to nearly 396 million in four years. AI‑driven tools are projected to generate $4.2 B by 2029, while cloud‑gaming revenue grew from $1.1 B in 2020 to $6.9 B in 2024 and is expected to reach $18.7 B by 2027.
Indie developers benefit from cloud infrastructure that allows anyone to play AAA titles and AI engines such as Unity Muse or Unreal Engine that reduce development costs. Indie releases on Steam generated $4 B in 2024, matching AAA revenue streams, and UGC has extended the life of titles like Fortnite and Roblox, boosting retention by up to 10 % in some cases. However, quality control, cross‑platform compatibility and monetization remain challenges; dedicated mod QA teams, “mod hub” interfaces and transparent pricing are recommended to sustain high‑quality ecosystems.
Player surveys reveal mixed feelings about AI, with 54 % seeing more benefits than drawbacks but 52 % feeling nervous. Creators view AI as a productivity aid, with 83 % adopting it and reporting improved content quality (66 %) and asset variation speed (70 %). Cloud gaming is praised for cost savings (47 %) and accessibility (44 %), yet latency (76 %) and bandwidth (68 %) issues persist, underscoring the need for edge computing, AI‑based compression and better economic models.
The analysis projects cloud gaming as the dominant play model within a decade, initially targeting B2B use cases before expanding to consumers. Advances in 5G and internet infrastructure are expected to unlock low‑latency streaming, enabling cross‑platform play and the convergence of AI, UGC and live‑service models into socially connected gaming ecosystems. The report concludes that while continuous evolution and community engagement will drive growth, depth in specific genres may ultimately define the next wave of innovation.
The study demonstrates that genre is the primary factor influencing mobile game adoption, with puzzle and matching titles dominating in North America and East Asia, while card‑casino games lead elsewhere. Within these markets, strategy players—comprising 12–26 % of the player base—exhibit high retention when titles incorporate live events, achievements, and daily rewards. Their spending patterns favor direct purchases over random loot boxes, especially in Japan, and they tolerate rewarded ads only when infrequent and longer. Strategy games also deliver the highest lifetime value, largely through aggressive use of battle passes (present in 92 % of top titles) and character or gear upgrades.
Role‑playing games attract players motivated by accomplishment, collection, and social interaction; churn is driven by repetitive gameplay and aggressive monetization. Successful RPGs mitigate this through frequent live events, multiple leveling paths, robust guild systems, and a balanced mix of loot boxes and bulk‑discount options. Monetization sensitivity varies regionally: U.S. players accept rewarded videos when they provide tangible benefits, whereas Korean and Japanese audiences are more tolerant of longer, character‑centric ads.
Puzzle players skew female (≈70 %) and older (≈60 % aged 35+), favoring short solo sessions for stress relief. Retention gaps stem from boredom and slow progress; top performers address this with live events, diverse level goals, and event currencies. While community engagement is low overall, a majority welcome developer communication and leaderboard features. Hyper‑casual audiences similarly value frequent updates, social cues, and ad‑friendly monetization that avoids pay‑to‑win perceptions.
Across all genres, the analysis identifies key mechanics—battle passes, VIP tiers, guilds, live‑event currencies, and ladder systems—that create recurring revenue streams and community retention. Combining season‑based progression with social collaboration and limited‑time rewards maximizes player lifetime value and monetization potential.
The primary purpose of the analysis is to demonstrate how a strategic partnership between a mobile measurement partner (MMP) and TikTok’s advertising ecosystem can unlock profitable growth for app marketers. By integrating real‑time attribution, privacy‑preserving measurement, and value‑based optimization, brands can accurately credit campaigns, reduce fraud, and maximize return on ad spend (ROAS) across the entire customer journey.
Key findings show that cross‑platform visibility is essential for identifying high‑value users and optimizing acquisition budgets, especially amid tightening privacy regulations on iOS and Android. AppsFlyer’s comprehensive measurement suite, combined with TikTok’s SKAdNetwork tools and self‑reporting network, delivers precise audience targeting and cost‑effective user acquisition. Case studies from Burger King, Casas Bahia, and Carrefour illustrate tangible results: a 7× ROI for coupon activations, a 44 % lift in conversion rates with a 55 % ROI gain, and a 29 % increase in in‑app revenue with triple the return compared to other channels.
The document outlines best practices for app install and retargeting campaigns, recommending the use of App Event Optimization (AEO) and Value‑Based Optimization (VBO) to focus spend on high‑value actions. Automated Smart Performance Campaigns and real‑time ROAS measurement via AppsFlyer integrations further enhance efficiency and lifetime value.
Geographically, the insights apply globally across major mobile markets, with a focus on the U.S., Europe, and emerging regions where TikTok’s user base is rapidly expanding. The time frame covers current privacy‑driven advertising environments and anticipates ongoing downturns, positioning the partnership as a resilient growth strategy for 2024‑2026.
The report examines Generation Z (born 1997 and later) as the newest cohort of mobile gamers, highlighting their purchasing power, digital habits, and advertising preferences. Surveying 7,103 U.S. respondents aged 18‑24 on the Tapjoy network in February 2021, it finds that 86 % of Gen Z use mobile devices for gaming, far exceeding console (42 %) and PC (38 %) usage. Nearly one‑quarter first owned a smartphone before age 10, and 49 % replace devices every two to three years. Mobile shopping dominates their retail behavior: 68 % shop on phones one to four times per week, with 60 % ordering food delivery and 57 % making retail purchases. Preferred purchase channels include branded apps, e‑commerce storefronts, rewarded offers in games, and Instagram ads.
Advertising engagement shows a strong preference for rewarded mobile game ads (61 % enjoy offerwalls) and short, creative content such as memes (50.4 %) and humor‑driven brand posts (57 % value humor). Traditional formats—banner ads, non‑skippable videos, and celebrity endorsements—are largely ineffective. Gen Z follows brands that align with their values; 52 % discover new products via social media, and 67 % follow brands for product interest. The methodology involved opt‑in participation with age verification, automatic reward distribution, and a geographically targeted U.S. sample.
Overall, the findings portray Gen Z as highly engaged mobile gamers with significant discretionary spending, a preference for value‑based advertising, and a strong inclination toward brands that reflect their social and environmental values.
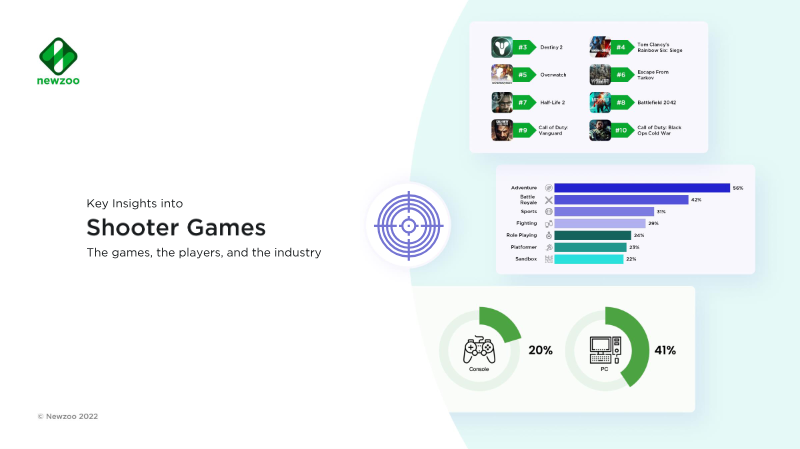
Shooter games represent the fifth highest‑earning genre worldwide, generating approximately $2.24 billion in 2022 across all platforms. The report focuses on the genre’s popularity, player demographics, engagement patterns, and monetization strategies within a global context that excludes China and India. Data derive from Newzoo’s Global Games Market, Consumer Insights – Games & Esports 2022, and the Newzoo Expert platform, covering 37 markets with a sample of 19,544 recent shooter players and 60,020 broader gamers.
Key findings show that shooters dominate PC and console play, with 68 % of monthly active users (MAU) on these platforms also engaging in shooter titles. Player overlap with other genres is high: 56 % of shooter players also play adventure games, while strategy and simulation overlap remains low. The contemporary war theme and level‑based mechanics are the most common in shooter titles. Monetization is overwhelmingly pay‑to‑play; 97 % of shooter players experience in‑app purchases, and advertising is the least used model.
Demographically, core personas—Ultimate Gamers and All‑Round Enthusiasts—account for the largest shooter player base, yet nearly all persona groups play shooters. Motivations to spend include social interaction and access to special offers, with 13,659 of the 19,544 shooter players identified as payers. Live‑streaming data indicate that shooters rank highly on Twitch and Facebook Gaming, reinforcing the genre’s strong community presence. The report underscores shooters’ robust revenue streams, broad demographic appeal, and central role in competitive online play.