Market Analysis
Documents

3Q FY2023 Presentation Material: Japan
3Q FY2023 Presentation Material The future information, such as earnings forecast, written in this document is based on our expectations and assumptions as of the date the forecast was made. Our actual results could differ materially from those described in this forecast because of various 1. Financial Summary<sub>(April-June 2023)</sub> 3. Internet Advertisement Business 6. Medium to long-term strategy FY2023 Media and Ads increased the sales.
- Overall Q3 FY2023 performance saw a significant drop in operating profit (down 86.2% YoY to 1.4 billion yen) despite sales remaining flat (down 0.2% YoY to 171.7 billion yen).
- The Game business experienced lower-than-expected earnings, with sales down 27.0% YoY to 33.7 billion yen and an operating loss of 0.1 billion yen, primarily due to a slowdown after major game anniversaries in Q2.
- The Media business, specifically ABEMA, saw improved performance, with sales up 13.1% YoY to 33.3 billion yen and a reduced operating loss of 1.5 billion yen (a 2.4 billion yen improvement YoY).
- The Ads business achieved record-high sales of 105.4 billion yen (up 9.1% YoY), but operating profit decreased by 37.4% YoY to 3.8 billion yen due to continued upfront investment.
- SG&A expenses increased by 5.2% YoY to 39.8 billion yen in Q3 FY2023.

1Q FY2024 Presentation Material
The presentation outlines CyberAgent’s fiscal‑year 2024 first‑quarter performance, emphasizing a robust rebound across its three core businesses—Internet advertising, media (ABEMA), and game development. Consolidated sales reached ¥193 billion, up 15.2 % year‑over‑year, while operating profit climbed to ¥6.28 billion, a 7.5‑point increase from the prior year’s loss. The advertising arm delivered ¥105.3 billion in revenue, up 10.1 % YoY, and an operating profit of ¥5.6 billion, reflecting a 13.3 % YoY gain and sustained improvement in operating‑margin efficiency (OPM). Media operations posted ¥42.7 billion, a 27.8 % YoY rise, though operating loss narrowed to ¥0.9 billion, driven by reduced losses in ABEMA‑related activities. Game sales hit ¥45.0 billion, up 10.1 % YoY and 6.5 % QoQ; operating loss fell to ¥3.4 billion, a 32.9 % YoY decline and 42.4 % QoQ improvement, thanks to a new hit title.
Financial statements show total assets of ¥468.7 billion and shareholders’ equity of ¥129.0 billion, with cash deposits at ¥184.8 billion. SG&A expenses rose 8.1 % YoY to ¥43.7 billion, while headcount increased to 7,336 employees.
Strategically, the company targets a “growth phase” with new digital ad platforms (e.g., ANA Moment Ads), continued investment in ABEMA, and a pipeline of high‑quality games such as “Jujutsu Kaisen Phantom Parade.” Forecasts indicate that FY2024 operating profit will reach ¥30 billion, with sales projected at ¥750 billion. The presentation stresses a commitment to enhancing monetization, AI‑driven advertising efficiency, and extending game lifecycles to secure long‑term profitability.
- CyberAgent returned to profitability in 1Q FY2024 with ¥6.28 billion in operating profit, a significant recovery from the prior year's loss, on consolidated sales of ¥193 billion.
- The company projects full-year FY2024 performance to reach ¥750 billion in sales and ¥30 billion in operating profit.
- The game development segment saw sales rise 10.1% YoY to ¥45.0 billion, with operating losses narrowing by 32.9% YoY to ¥3.4 billion, largely driven by the success of the new title 'Jujutsu Kaisen Phantom Parade.'
- The internet advertising business remains the primary revenue driver, contributing ¥105.3 billion in revenue—a 10.1% YoY increase—and ¥5.6 billion in operating profit.
- Media operations, anchored by ABEMA, grew revenue by 27.8% YoY to ¥42.7 billion, successfully narrowing the segment's operating loss to ¥0.9 billion.

FY2024 Presentation Material: January to March 2024
The presentation outlines CyberAgent’s FY2024 performance, emphasizing record sales and operating profit growth across its three core businesses—Internet Advertising, Media (ABEMA), and Game. Consolidated sales reached ¥215.1 billion in Q2, up 10.0% YoY, while operating profit rose to ¥21.0 billion, a 12.2% increase and the first time surpassing ¥20 billion in eight quarters. Internet Advertising sales climbed 7.1% YoY to ¥107.3 billion, with operating profit up 19.6%. The Media segment achieved a new high of ¥42.0 billion in sales, up 25.8% YoY, and turned profitable for the first time since Q2 2023; operating profit increased 0.7 billion yen. Game sales grew 8.1% YoY to ¥67.1 billion, driven by the launch of “Granblue Fantasy: Relink,” which sold one million units within eleven days, and by anniversary events for major titles; operating profit surged 19.8% YoY.
Financially, SG&A expenses increased modestly by 2.9%, while cash deposits and fixed assets grew significantly, reflecting investment in technology and talent. Net income attributable to shareholders rose 30.8% YoY to ¥10.3 billion, offset by a temporary extraordinary loss.
The company’s strategy focuses on leveraging generative AI and large‑language models (CyberAgentLM) to enhance ad creative, expand ABEMA’s sports content through partnerships with DAZN and WOWSPO, and sustain game revenue by launching new titles such as “Granblue Fantasy Versus” and “Umamusume Pretty Derby.” The overarching goal is to increase sales and profits, with FY2023 operating profit as a low point, and to position CyberAgent as a global digital media and technology leader.
- CyberAgent achieved consolidated Q2 FY2024 sales of ¥215.1 billion (up 10.0% YoY) and an operating profit of ¥21.0 billion, marking the first time profit has exceeded ¥20 billion in eight quarters.
- The Game segment grew 8.1% YoY to ¥67.1 billion in sales, bolstered by the launch of 'Granblue Fantasy: Relink'—which reached one million units sold in eleven days—and various anniversary events.
- The Media segment (ABEMA) reached a record ¥42.0 billion in sales, a 25.8% YoY increase, and achieved profitability for the first time since Q2 2023 with an operating profit of ¥0.7 billion.
- Internet Advertising sales rose 7.1% YoY to ¥107.3 billion, with operating profit significantly outpacing revenue growth at a 19.6% increase.
- Net income attributable to shareholders grew 30.8% YoY to ¥10.3 billion, despite being partially offset by a temporary extraordinary loss.

FY2024 Presentation Material: October 2023 to September 2024
October 2023 to September 2024 The future information, such as earnings forecast, written in this document is based on our expectations and assumptions as of the date the forecast was made. Our actual results could differ materially from those described in this forecast because of various risks and uncertainties. 1. FY2024 Full Year Results (October 2023 -September 2024) 2. FY2025 Forecast (October 2024 -September 2025) 3. Internet Advertisement Business 6. Medium to Long-Term Strategy 7.
- Consolidated sales for FY2024 reached 802.9 billion yen, an 11.5% increase year-over-year, marking the 27th consecutive year of sales growth driven by strong performance in three key businesses.
- The company's full-year sales were 436.3 billion yen, up 7.6% year-over-year, indicating market share growth by outpacing overall market expansion.
- The dividend forecast has been raised to 16 yen from 15 yen, with a Dividend on Equity (DOE) guidance of 5%, and the company's ROE, dividend payout ratio, and DOE all exceed the TSE average.
- Operating loss significantly improved year-over-year, with FY2024 showing a 9.5 billion yen increase in operating income compared to the previous year.
- Sales from ABEMA and related businesses grew by 22.4% year-over-year to 107.5 billion yen in FY2024, primarily driven by ABEMA-related businesses and advertising.

2Q FY2025 Financial Presentation Material
2Q FY2025 Presentation Material We corrected past annual securities reports and others due to the discovery of an inappropriate accounting treatment at the consolidated subsidiary. Please refer to the “Notice on Submission of Correction Reports of Past Annual Securities Reports and Amendments of Financial Statements for Past Fiscal Years” released on May 15, 2025, for details.
- The company achieved record-high sales of 217.3 billion yen in FY2025 Q2, up 1.2% YoY, with operating profit increasing by 0.7% YoY to 20.8 billion yen, primarily driven by Media & IP and Ad businesses.
- An inappropriate accounting treatment at a consolidated subsidiary led to corrections of past annual securities reports and amendments of financial statements, with details released on May 15, 2025.
- The Media & IP business saw significant growth, with sales up 14.4% YoY to 57.0 billion yen and operating profit increasing 6.5x YoY to 3.3 billion yen, through building a multi-layered revenue stream and investing in anime production.
- The Ad business maintained a high sales increase rate, up 9.9% YoY to 117.5 billion yen, and operating profit increased by 8.7% YoY to 6.0 billion yen, with an operating profit margin of 5.1%.
- Sales and profit in the game console game sector declined 23.4% YoY to 51.4 billion yen and 15.7% YoY to 15.3 billion yen respectively, despite a significant QoQ increase (34.6% in sales, 4.6x in OP) due to a game release in February 2024.

1Q FY2025 Presentation Material
The presentation outlines CyberAgent’s FY 2025 financial outlook, operational highlights, and strategic priorities across its Media & IP, Internet Advertising, and Game divisions. FY 2025 revenue is projected at ¥820 billion with operating profit of ¥42 billion, representing 24.9 % and 19.8 % of the year‑to‑date targets, respectively. First‑quarter results show a 5.6 % YoY sales increase to ¥203.8 billion and a 32.1 % rise in operating profit to ¥8.3 billion, driven largely by a 10.5 % lift in Media & IP sales (¥55.6 billion) and an 11.8 % growth in Internet Advertising sales (¥117.7 billion). The Game segment, however, posted a 15.1 % YoY decline to ¥38.2 billion and a 4.1 % drop in operating profit, attributed to slower releases despite strong performance of new titles.
Operating margins improved from 3.3 % in FY 2024 to 4.1 % in FY 2025, supported by a 32 % increase in operating income. SG&A expenses rose 4.4 % YoY to ¥45.7 billion, while cash deposits increased 11.3 % YoY to ¥205.6 billion, reflecting liquidity strengthening.
Strategically, the company is shifting from a Media‑only model to an integrated Media & IP business, aiming to generate global IPs through ABEMA and new production units such as CA Soa Inc. The medium‑to‑long‑term plan emphasizes investment in high‑profit IP content, game development, and advertising technology leveraging AI to enhance ad effectiveness. The presentation also lists a pipeline of over six new games for FY 2025, including international releases, and outlines organizational changes to support the expanded IP focus.
- CyberAgent reported a 5.6% YoY revenue increase to ¥203.8 billion and a 32.1% rise in operating profit to ¥8.3 billion for 1Q FY2025.
- The Game segment underperformed, recording a 15.1% YoY revenue decline to ¥38.2 billion and a 4.1% drop in operating profit due to a slower release cadence.
- Growth was primarily driven by the Media & IP segment, which saw a 10.5% sales increase to ¥55.6 billion, and the Internet Advertising segment, which grew 11.8% to ¥117.7 billion.
- The company is pivoting to an integrated Media & IP strategy, utilizing ABEMA and new production units like CA Soa Inc. to develop global intellectual property.
- CyberAgent plans to bolster its gaming portfolio with a pipeline of over six new titles in FY2025, including several international releases.
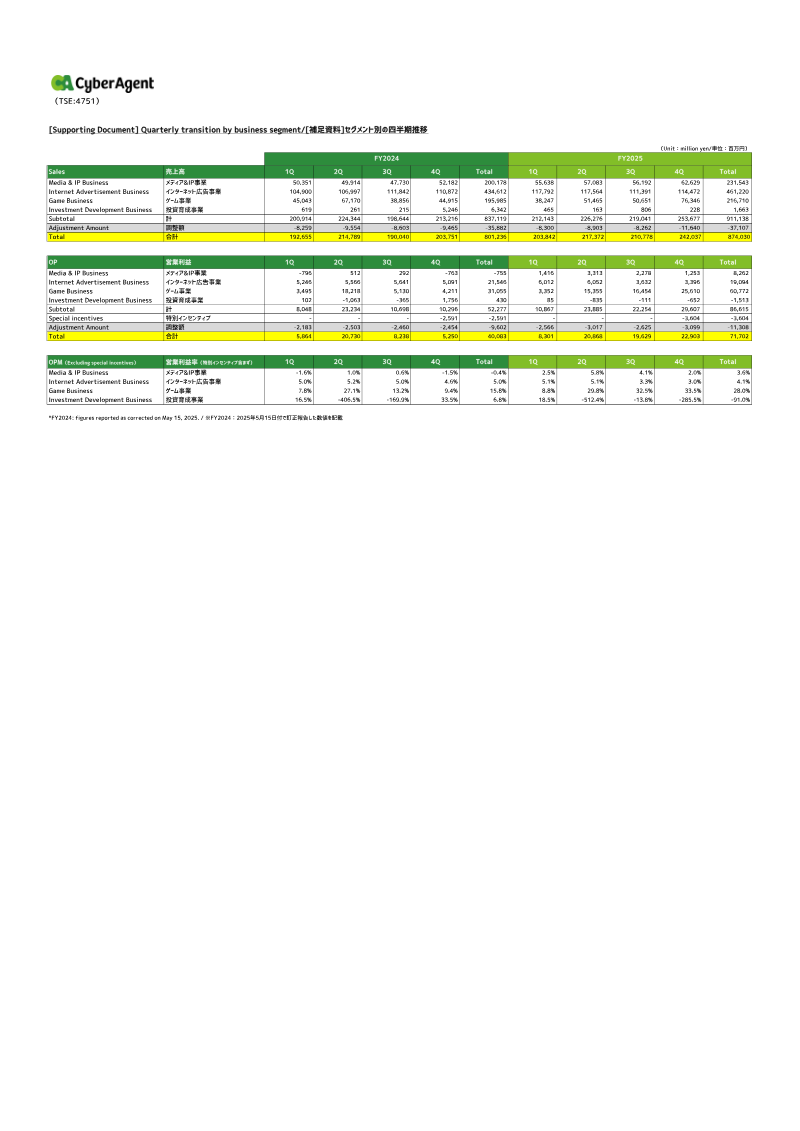
Quarterly Transition by Business Segment: Japan
The quarterly transition analysis for Japan’s business segments presents detailed financial performance for FY2024 and FY2025, focusing on Media & IP, Internet Advertisement, Game, and Investment Development divisions. Sales figures reveal that the Internet Advertisement Business consistently leads with a FY2024 total of ¥434,612 million and a FY2025 total of ¥461,220 million. The Game Business shows the most volatility, peaking in Q2 FY2024 at ¥67,170 million before declining to ¥38,856 million in Q3. Media & IP sales remain relatively stable around ¥50–52 billion per quarter, while Investment Development remains a minor contributor with totals under ¥7 billion.
Operating profit (OP) highlights divergent profitability across segments. The Game Business delivers the highest OP, reaching ¥31,055 million in Q1 FY2024 and sustaining strong quarterly results thereafter. Internet Advertisement maintains steady OP around ¥5–6 billion each quarter, whereas Media & IP oscillates between losses and modest gains, culminating in a FY2024 total OP of ¥8,262 million. Investment Development experiences significant swings, with a notable loss in Q2 FY2024 but a recovery to ¥1,756 million in Q4.
Operating profit margins (OPM) excluding special incentives illustrate segment efficiency. Game Business achieves the highest margin, peaking at 33.5% in Q3 FY2024 and maintaining a FY2025 average of 28%. Internet Advertisement sustains margins around 5%, while Media & IP remains near break‑even, fluctuating between –1.6% and 5.8%. Investment Development shows extreme volatility, with a negative margin of –406.5% in Q2 FY2024 and a positive 33.5% in Q4, resulting in an overall FY2024 margin of 3.6%.
The data cover the Japanese market over two fiscal years, with quarterly granularity and corrections applied as of May 15 2025. The analysis relies on internal financial statements, presenting a comprehensive view of segment performance and profitability trends.
- The Game Business is the company's most profitable segment, maintaining a FY2025 average operating profit margin of 28% and peaking at 33.5% in Q3 FY2024.
- Internet Advertisement is the largest revenue generator, growing from ¥434,612 million in FY2024 to ¥461,220 million in FY2025, though it operates on thin margins of approximately 5%.
- Game Business revenue is highly volatile, experiencing a sharp decline from a peak of ¥67,170 million in Q2 FY2024 to ¥38,856 million in Q3 FY2024.
- Media & IP remains a stable but low-margin segment, with quarterly sales consistently between ¥50 billion and ¥52 billion and operating profit margins fluctuating between –1.6% and 5.8%.
- Investment Development is a minor contributor with annual revenue under ¥7 billion and extreme performance volatility, ranging from a –406.5% margin in Q2 FY2024 to a 33.5% margin in Q4 FY2024.

Presentation Material: Q1 FY2026
The future information, such as earnings forecast, written in this document is based on our expectations and assumptions as of the date the forecast was made. Our actual results could differ materially from those described in this forecast because of various risks and uncertainties. 1. Summary (October - December 2025) 4. Internet Advertisement Business 6.
- For Q1 FY2026, overall sales increased by 14.0% year-over-year to 232.3 billion yen, and operating profit surged 2.8x year-over-year to 23.3 billion yen, marking a strong start to the fiscal year.
- The Game business was a primary driver of growth, with sales up 69.2% year-over-year to 64.7 billion yen and operating profit increasing 5.3x year-over-year to 17.6 billion yen, fueled by existing titles and global expansion.
- The Media & IP business also contributed significantly, achieving a 12.5% year-over-year increase in sales to 62.6 billion yen and a 3.5x year-over-year increase in operating profit to 4.9 billion yen.
- Net income for Q1 FY2026 rose 2.5 times year-over-year to 12.4 billion yen.
- Ad Sales experienced a slight decrease of 2.7% year-over-year to 114.6 billion yen due to the loss of a large client, though the trend is showing gradual improvement.
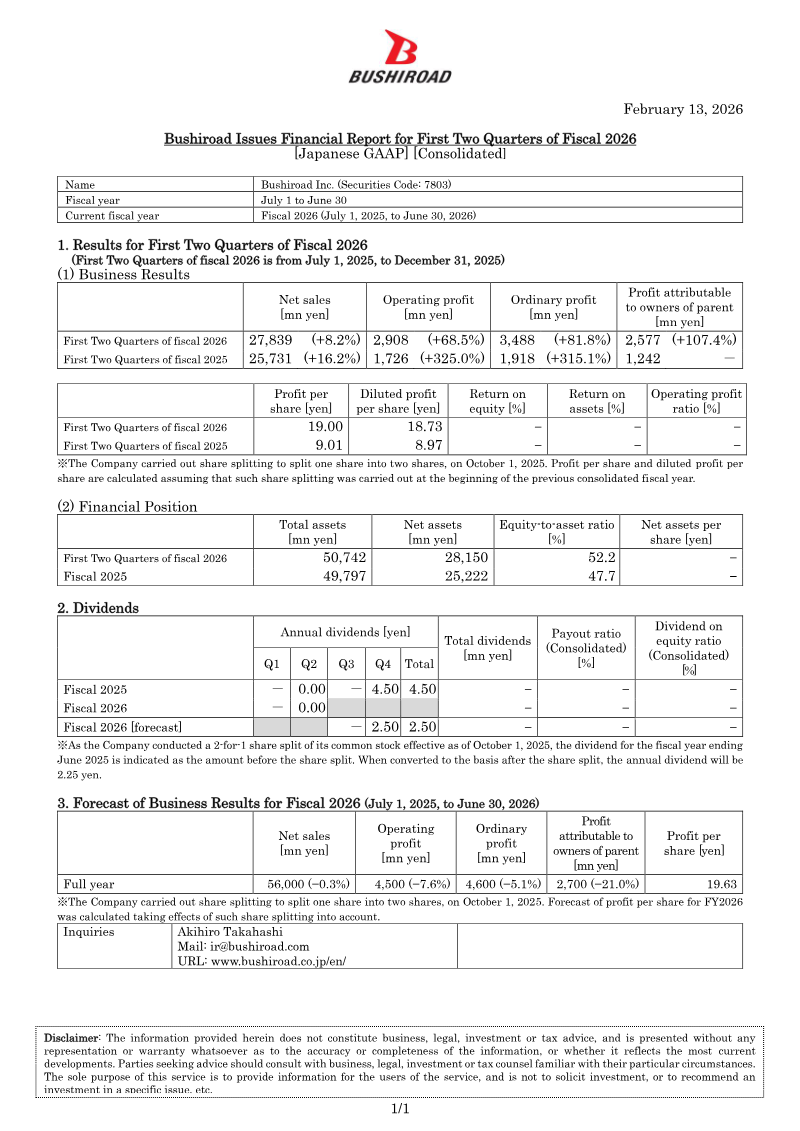
Financial Report for First Two Quarters: Fiscal 2026
Bushiroad Inc. reports consolidated financial results for the first two quarters of fiscal 2026 (July 1–December 31, 2025). Net sales rose 8.2 % to ¥27,839 million, while operating profit increased 68.5 % to ¥2,908 million and ordinary profit grew 81.8 % to ¥3,488 million; profit attributable to owners of the parent company surged 107.4 % to ¥2,577 million. Earnings per diluted share reached ¥19.00, a significant jump from ¥9.01 in the same period of fiscal 2025, reflecting both higher profitability and a 2‑for‑1 share split executed on October 1, 2025. Total assets expanded to ¥50,742 million and net assets climbed to ¥28,150 million, raising the equity‑to‑asset ratio from 47.7 % to 52.2 %.
The company’s dividend policy for fiscal 2025 included a ¥4.50 million payout, while no dividends were declared in the first half of fiscal 2026; a forecast for the full year projects no dividend distribution.
For the full fiscal year 2026, Bushiroad forecasts net sales of ¥56,000 million (a slight decline of 0.3 % from the prior year), operating profit of ¥4,500 million (down 7.6 %), ordinary profit of ¥4,600 million (down 5.1 %), and profit attributable to the parent of ¥2,700 million (down 21.0 %). Earnings per share are projected at ¥19.63, adjusted for the share split.
These figures cover Bushiroad’s domestic Japanese operations under Japanese GAAP, with the fiscal year running from July 1 to June 30. The report relies on consolidated financial statements and includes a forward‑looking forecast based on current management expectations.
- Bushiroad Inc. reported strong growth for the first two quarters of fiscal 2026 (July 1–December 31, 2025), with net sales rising 8.2% to ¥27,839 million and operating profit surging 68.5% to ¥2,908 million.
- Profit attributable to owners of the parent company more than doubled, increasing 107.4% to ¥2,577 million compared to the same period in fiscal 2025.
- Earnings per diluted share reached ¥19.00, bolstered by improved profitability and a 2-for-1 share split implemented on October 1, 2025.
- The company’s balance sheet strengthened during the first half of the fiscal year, with total assets reaching ¥50,742 million and the equity-to-asset ratio improving to 52.2%.
- Despite the strong first-half performance, management forecasts a decline for the full fiscal year 2026, projecting net sales of ¥56,000 million (down 0.3%) and profit attributable to the parent of ¥2,700 million (down 21.0%).
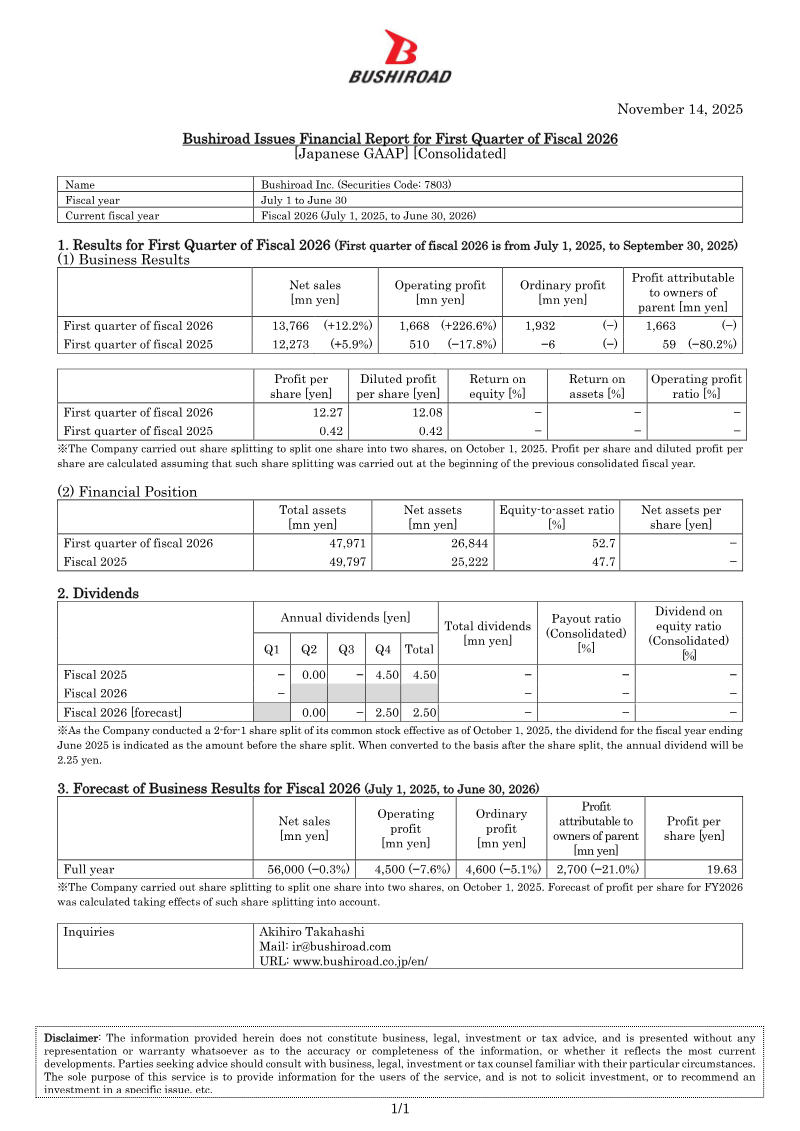
Financial Report for First Quarter of Fiscal 2026: Japan
Bushiroad Inc., a Japanese entertainment company, reported first‑quarter fiscal 2026 results for the period July 1 to September 30, 2025. Net sales rose 12.2% year‑over‑year to ¥13,766 million, driven by stronger performance across its core card game and event‑ticket businesses. Operating profit surged 226.6% to ¥1,668 million, while ordinary profit reached ¥1,932 million, a reversal from the previous year’s operating loss of ¥510 million. Profit attributable to owners of parent companies stood at ¥1,663 million, up from a loss of ¥59 million in the same quarter of fiscal 2025. Earnings per share, adjusted for a 2‑for‑1 stock split effective October 1, 2025, climbed to ¥12.27.
Total assets for the quarter were ¥47,971 million, with net assets of ¥26,844 million, reflecting an equity‑to‑asset ratio increase to 52.7% from 47.7% in fiscal 2025. Net assets per share were not disclosed due to the recent split.
Dividend policy for fiscal 2025 showed a single payout of ¥4.50 per share in Q3, with no dividends announced for fiscal 2026 yet; a forecast indicates a potential ¥2.50 per share in Q4 after the split. The company projects full‑year 2026 net sales of ¥56,000 million (a slight decline of 0.3% from the prior year), operating profit of ¥4,500 million (down 7.6%), and ordinary profit of ¥4,600 million (down 5.1%). Forecasted earnings per share for FY2026 are ¥19.63, reflecting the impact of the share split.
These figures illustrate a rebound in profitability after a challenging prior year, with modest sales growth and an improving capital structure. The company’s guidance signals continued pressure on operating margins, likely due to rising content development costs and competitive market dynamics within Japan’s entertainment sector.
- Bushiroad Inc. achieved a significant financial turnaround in Q1 fiscal 2026, reporting an operating profit of ¥1,668 million compared to an operating loss of ¥510 million in the same period last year.
- Net sales for the quarter ending September 30, 2025, grew 12.2% year-over-year to ¥13,766 million, fueled by strong performance in the company's card game and event-ticket divisions.
- Profit attributable to owners of the parent company reached ¥1,663 million, marking a substantial recovery from the ¥59 million loss recorded in Q1 fiscal 2025.
- The company’s capital structure improved, with the equity-to-asset ratio rising to 52.7% from 47.7% in the previous fiscal year.
- Full-year fiscal 2026 projections anticipate a slight decline in performance, with forecasted net sales of ¥56,000 million and operating profit of ¥4,500 million, representing decreases of 0.3% and 7.6% respectively.
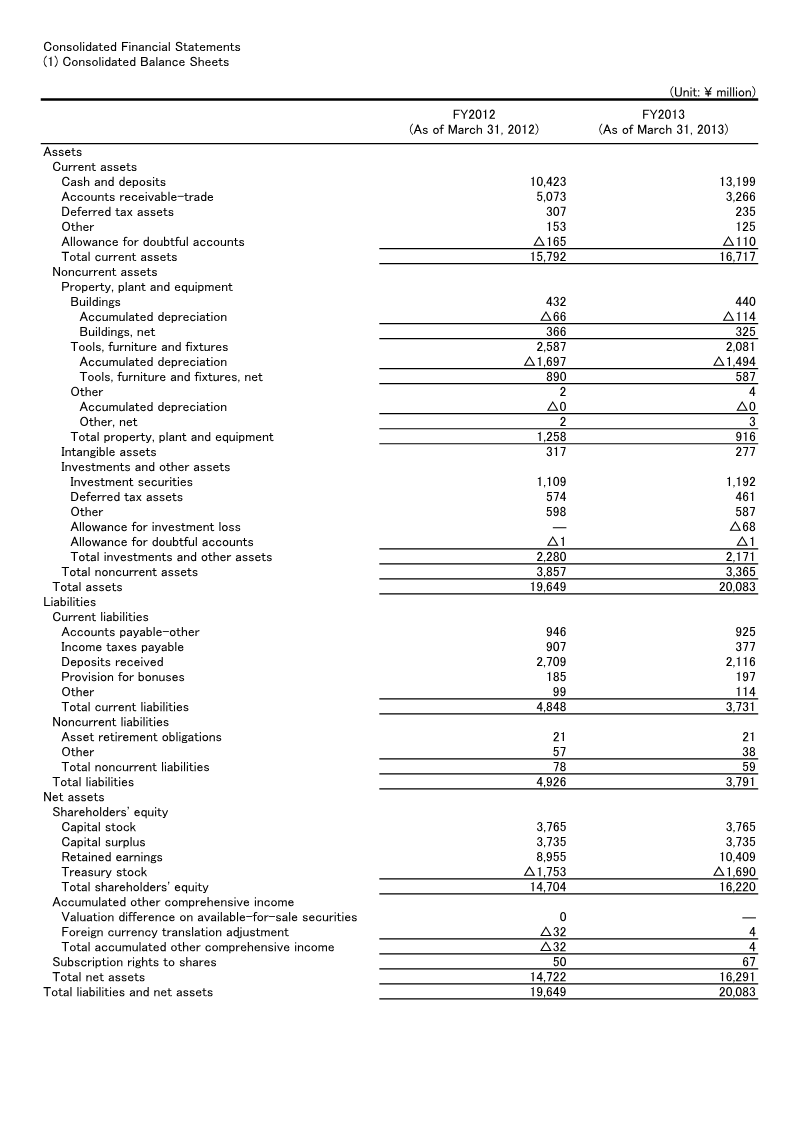
Consolidated Balance Sheets: FY2012-FY2013
The consolidated financial statements cover the fiscal years ending March 31, 2012 and March 31, 2013. Net sales fell from ¥13,334 million to ¥12,632 million, yet operating income rose from ¥2,194 million to ¥2,574 million, reflecting lower cost of sales and improved operating efficiency. Net income more than doubled, increasing from ¥749 million to ¥1,654 million, largely driven by a substantial extraordinary gain of ¥406 million on the sale of subsidiary shares and reduced operating expenses. Comprehensive income grew from ¥732 million to ¥1,691 million; foreign‑currency translation adjustments swung from a negative ¥5 million to a positive ¥36 million, offsetting other comprehensive losses.
Assets increased from ¥19,649 million to ¥20,083 million. Current assets grew modestly, with cash and deposits rising by ¥2,776 million. Non‑current assets declined due to a reduction in property, plant and equipment net balance from ¥1,258 million to ¥916 million, reflecting asset disposals and depreciation. Liabilities fell from ¥4,926 million to ¥3,791 million, driven by lower current liabilities and a reduction in non‑current obligations. Shareholders’ equity expanded from ¥14,722 million to ¥16,291 million; retained earnings grew by ¥1,453 million, while treasury stock decreased in net value from a negative ¥1,753 million to a negative ¥1,690 million.
Cash flow analysis shows operating cash inflows rising from ¥1,043 million to ¥2,836 million. Investing activities remained negative, with a net outflow of ¥2,971 million in 2012 and ¥946 million in 2013, largely due to property, plant and equipment purchases. Financing cash flows were negative in both years, with treasury stock repurchases offset by modest dividend payments. The company’s liquidity improved, as cash and equivalents increased from ¥11,293 million to ¥9,199 million despite the net cash outflow in 2012. Overall, the firm strengthened profitability and equity while managing asset composition and cash flows over the two‑year period.
- Net income more than doubled from ¥749 million in FY2012 to ¥1,654 million in FY2013, bolstered by a ¥406 million extraordinary gain from the sale of subsidiary shares and reduced operating expenses.
- Operating income increased from ¥2,194 million to ¥2,574 million despite a decline in net sales from ¥13,334 million to ¥12,632 million, indicating improved operational efficiency and lower cost of sales.
- Shareholders' equity grew from ¥14,722 million to ¥16,291 million, supported by a ¥1,453 million increase in retained earnings.
- Total liabilities decreased significantly from ¥4,926 million to ¥3,791 million, reflecting reductions in both current and non-current obligations.
- Operating cash inflows saw substantial growth, rising from ¥1,043 million in FY2012 to ¥2,836 million in FY2013.
Quarterly Consolidated Balance Sheets: 2Q FY2013
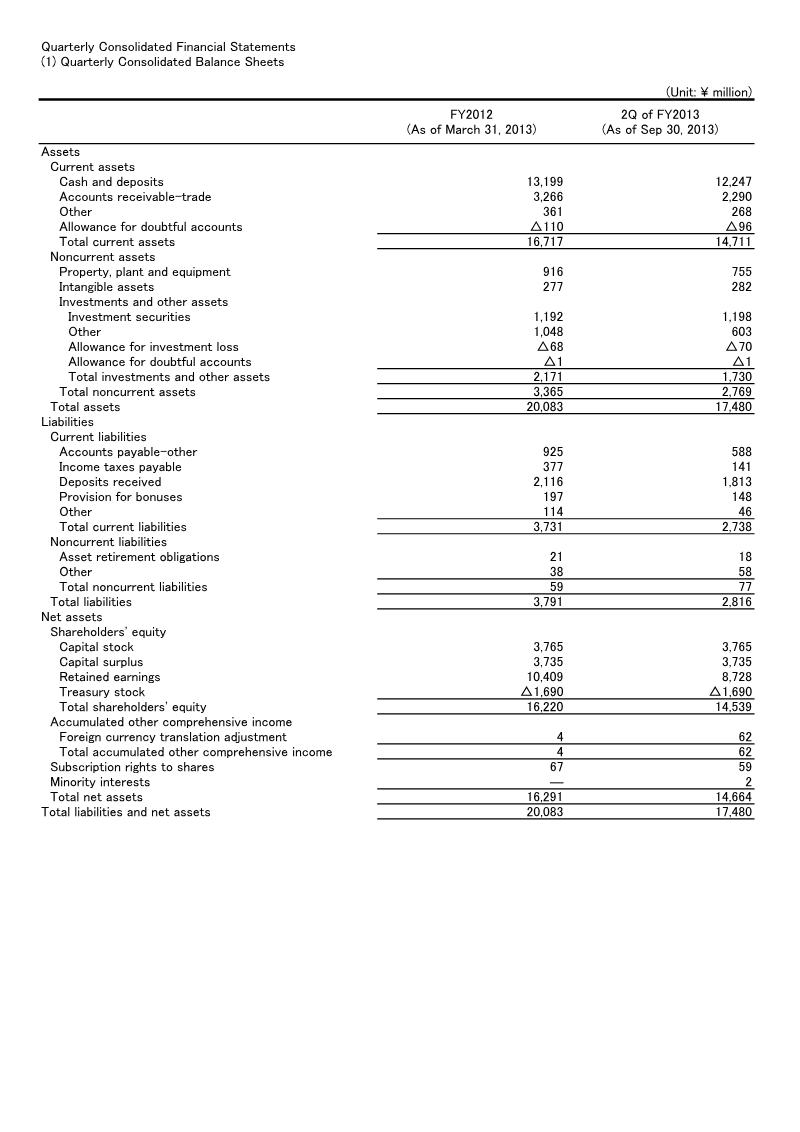
The quarterly consolidated balance sheet and income statements for the second quarter of fiscal year 2013 reveal a contraction in both operating performance and financial position compared with the same period of fiscal year 2012. Total assets fell from ¥20,083 million to ¥17,480 million, largely due to a reduction in current assets and non‑current investments. Current liabilities decreased from ¥3,731 million to ¥2,738 million, but shareholders’ equity declined from ¥16,291 million to ¥14,664 million, driven by a lower retained earnings balance and the continued impact of treasury stock.
Operating income swung from ¥1,612 million in 2Q FY2012 to a loss of ¥398 million in 2Q FY2013, reflecting higher selling, general and administrative expenses relative to sales. Net sales dropped by 41% from ¥6,817 million to ¥3,979 million, while cost of sales fell proportionally. Non‑operating losses increased sharply due to a ¥126 million loss on equity in affiliates and a ¥21 million loss on investments, offset only partially by foreign exchange gains of ¥20 million. Ordinary income turned negative, with a loss of ¥525 million in 2Q FY2013 versus a profit of ¥1,583 million previously.
Comprehensive income mirrored the net loss trend, reporting a ¥1,293 million loss attributable to owners of the parent in 2Q FY2013 versus a ¥1,184 million profit in 2Q FY2012. Cash flow analysis shows operating cash outflows of ¥448 million, a significant rise in investing cash inflows to ¥2,774 million—largely from sales of subsidiary shares—and financing outflows of ¥327 million due to dividend payments. Overall, the company experienced a notable decline in profitability and equity during the second quarter of FY2013.
- Net sales plummeted 41% year-over-year, falling from ¥6,817 million in 2Q FY2012 to ¥3,979 million in 2Q FY2013.
- Operating income shifted from a ¥1,612 million profit in 2Q FY2012 to a ¥398 million loss in 2Q FY2013, driven by high selling, general, and administrative expenses relative to sales.
- The company reported a net loss attributable to owners of the parent of ¥1,293 million for 2Q FY2013, a sharp reversal from the ¥1,184 million profit recorded in the same period of the previous year.
- Total assets contracted from ¥20,083 million to ¥17,480 million, while shareholders’ equity declined to ¥14,664 million due to lower retained earnings and treasury stock impact.
- Ordinary income turned negative, resulting in a loss of ¥525 million compared to a profit of ¥1,583 million in 2Q FY2012, exacerbated by ¥147 million in combined losses from equity in affiliates and investments.