Report71 pages
State of AI Apps Report 2025
The analysis quantifies the rapid expansion of generative‑AI applications in the first half of 2025, documenting 1.6 billion downloads and $1.2 billion in in‑app‑purchase revenue. This represents a 67 percent increase in downloads and a 200 percent jump in revenue compared with the second half of 2024, indicating a pronounced acceleration in user adoption and monetisation. Engagement metrics rose in tandem, underscoring the sector’s heightened activity during this period.
User demographics reveal a pronounced male and youth bias: roughly 60 percent of users are male and nearly 70 percent are under 35. While flagship services such as ChatGPT and Google Gemini attract comparatively balanced audiences and exhibit strong cross‑app overlap, niche offerings—including Grok and DeepSeek—tend to cluster with privacy‑focused, crypto‑trading, and gaming user personas. This segmentation highlights divergent appeal across the generative‑AI landscape.
Advertising investment intensified, with OpenAI’s major campaign propelling it into the top‑ten spenders in key markets such as the United States, India and South Korea. AI‑driven ad creatives increasingly employ light‑hearted, animal‑centric visuals while emphasizing concrete everyday utilities, exemplified by Google Gemini’s car‑warning guidance and Microsoft Copilot’s quiz‑making and recipe‑generation tools. Spend estimates, tracked across U.S. platforms including Reddit, LinkedIn, TikTok and YouTube, illustrate the breadth of digital‑advertising channels leveraged.
Overall, the findings portray a sector experiencing explosive growth, a skewed yet evolving user base, and a surge in AI‑powered marketing activity across major global markets during H1 2025.
- Generative AI applications experienced explosive growth in H1 2025, reaching 1.6 billion downloads and $1.2 billion in in-app purchase revenue.
- Revenue growth significantly outpaced adoption, with a 200 percent increase in in-app purchase revenue and a 67 percent rise in downloads compared to H2 2024.
- The user base is heavily skewed toward younger males, with approximately 60 percent of users being male and nearly 70 percent under the age of 35.
- While flagship services like ChatGPT and Google Gemini maintain broad appeal, niche AI apps such as Grok and DeepSeek are increasingly associated with privacy-focused, crypto-trading, and gaming demographics.
- OpenAI has become a top-ten advertising spender in major markets including the United States, India, and South Korea.
+2
Sensor TowerJan 2025

Report40 pages
Gaming App Insights Report: 2025 Edition
The analysis tracks the state of the global mobile‑gaming market through 2024 and projects its trajectory toward 2025, emphasizing how emerging AI‑driven personalization will shape growth. It establishes that the sector is recovering from the volatility of 2023, with worldwide app installs climbing 4 % year‑over‑year in 2024, even as average session length contracted. Core user engagement metrics, however, show modest decline: day‑1 retention fell from 28 % to 27 % and median revenue per active user dropped from $0.31 to $0.28, indicating pressure on traditional monetization models. In contrast, advertising efficiency improved, reflected in higher installs per mille (IPM) and stronger ad‑performance indicators across major markets.
The report’s geographic scope is global, encompassing all major mobile‑gaming regions, and its temporal frame spans the 2023‑2025 period. It integrates data from app stores, ad networks, and cross‑platform measurement tools to deliver a comprehensive view of user acquisition, retention, and revenue trends. The central thesis posits that the next wave of growth will be powered by AI‑enabled, culturally tailored experiences that adapt difficulty, blend monetization formats, and deploy live events to boost lifetime value. Developers and marketers who adopt a metrics‑focused, AI‑augmented approach—identifying pivotal in‑game moments and steering users toward optimal pathways—are projected to achieve the most scalable expansion. Cross‑platform analytics suites are highlighted as essential for delivering the visibility required to implement these strategies effectively.
- Global mobile-gaming app installs grew by 4% year-over-year in 2024, signaling a recovery from 2023 market volatility.
- Monetization is under pressure as median revenue per active user declined from $0.31 to $0.28.
- User retention metrics weakened in 2024, with day-1 retention falling to 27% from the previous year's 28%.
- Advertising efficiency has improved, evidenced by higher installs per mille (IPM) and stronger performance indicators across major global markets.
- Average session lengths contracted in 2024, contributing to a modest overall decline in core user engagement metrics.
+2
AdjustJan 2025

Report29 pages
Mobile Game Market Insights: India 2025
India is the world’s largest mobile gaming market by volume, reaching 8.45 billion downloads in the 2024-25 fiscal year. Despite this massive scale, which is more than double that of Indonesia, the market faces significant monetization hurdles. Total in-app purchase revenue stands at approximately $400 million, reflecting a cost-sensitive consumer base that favors free-to-play models. However, the market shows signs of evolution, with revenue growing 8.5% year-over-year, driven largely by high-value spenders on iOS and the increasing adoption of digital payment systems like UPI.
The player base is predominantly young and male, with 77% of gamers aged 18-34 and 86% identifying as male. While casual subgenres such as driving simulators, platformers, and tabletop games dominate download charts due to their cultural resonance, revenue is concentrated in core competitive genres. Shooters, specifically Battle Royale titles like Garena Free Fire and Battlegrounds Mobile India, command 50% of total market revenue. Strategy and Casino games also represent significant portions of the spending landscape, highlighting a divide between mass-market reach and deep-engagement monetization.
A central fixture of the domestic industry is Ludo King, which has remained the most downloaded game in India since 2017, surpassing 1.25 billion lifetime downloads. Its success is attributed to the digitization of a traditional board game combined with social features like live voice chat. While domestic publishers like Gametion and Dream11 maintain strong local positions, there is a growing trend of India-based firms expanding into overseas markets, such as the United States and Saudi Arabia, to capture higher per-user revenue.
The findings are based on Sensor Tower’s App Performance and Audience Insights data for the period of April 2024 through March 2025. The methodology utilizes estimates from the App Store and Google Play, excluding ad revenue, third-party Android stores, and pre-installs. The scope focuses on the Indian mobile ecosystem while providing comparative context against other major Asian markets.
- India is the world's largest mobile gaming market by volume, recording 8.45 billion downloads in the 2024-25 fiscal year.
- Despite high download volume, in-app purchase revenue is limited to $400 million, though it is growing at 8.5% year-over-year due to increased digital payment adoption and high-value iOS spenders.
- Revenue is heavily concentrated in core competitive genres, with Battle Royale titles like Garena Free Fire and Battlegrounds Mobile India accounting for 50% of total market earnings.
- The player base is predominantly young and male, with 77% of gamers aged 18-34 and 86% identifying as male.
- Ludo King remains the dominant casual title, maintaining its status as the most downloaded game since 2017 with over 1.25 billion lifetime downloads.
+1
Sensor TowerJan 2025

Report22 pages
Mobile App Trends Spotlight Edition: Türkiye 2025
The mobile application economy in Türkiye is entering a high-growth, maturing phase, with total revenue projected to reach $1.65 billion by 2029. Ranking eighth globally for both total downloads and time spent in-app, the market is driven by a young, tech-oriented population and an 87% internet penetration rate. Analysis of data from January 2023 through July 2025 reveals that while the market is scaling globally, it maintains unique local characteristics across the gaming, finance, and e-commerce verticals.
The gaming sector remains a primary driver, with installs growing 12% year-over-year in 2024. Hyper-casual games dominate install shares at 28.6%, yet music and action genres command the highest session engagement. Notably, Turkish users spend an average of 32.8 minutes per gaming session, surpassing both regional and global averages. However, retention rates in Türkiye tend to be lower than global benchmarks, with only 19% of users returning the day after installation compared to 26% globally.
The finance and e-commerce sectors show similar trends of high engagement and rapid adoption of new technologies. Finance app installs surged 30% in the first half of 2025, supported by a high mobile banking adoption rate of 85%. In e-commerce, local developers maintain a strong foothold, creating 80% of the top shopping apps. While session lengths in these categories are gradually declining—potentially indicating more efficient user paths to purchase—retention rates for finance and shopping apps in Türkiye consistently outperform global medians.
A significant emerging trend is the rapid rise of generative AI applications, which saw a 142.5% increase in downloads between 2023 and 2024. This growth is fueled by a strategic pivot of local hyper-casual game studios toward AI-first apps and the development of proprietary Turkish-language models. These findings suggest that Türkiye is transitioning from a regional player to a global powerhouse, characterized by a highly engaged user base and a robust ecosystem of domestic developers.
- The Turkish mobile app market is projected to reach $1.65 billion in revenue by 2029, supported by an 87% internet penetration rate and a global top-ten ranking for downloads and time spent in-app.
- Generative AI applications experienced a 142.5% surge in downloads between 2023 and 2024, driven by local hyper-casual studios pivoting to AI-first development and proprietary Turkish-language models.
- Finance app installs grew by 30% in the first half of 2025, bolstered by an 85% mobile banking adoption rate and retention rates that consistently outperform global medians.
- Gaming remains a primary market driver with 12% year-over-year install growth in 2024, though day-one retention at 19% lags significantly behind the 26% global benchmark.
- Turkish gamers exhibit high engagement, averaging 32.8 minutes per session—surpassing global averages—with hyper-casual titles capturing 28.6% of total install share.
+2
AdjustJan 2025
Report19 pages
What Does the Monetization Landscape Look Like for Video Games in MENA?
The video game industry in the MENA-3 region—comprising Saudi Arabia (KSA), the United Arab Emirates (UAE), and Egypt—is experiencing rapid expansion driven by a young, tech-savvy population and significant government investment. In 2024, player spending in these markets reached $2 billion, a 4% year-over-year increase, and is projected to exceed $2.7 billion by 2028. While the region is home to 70.3 million gamers, it remains economically diverse: the UAE boasts the highest annual average revenue per user (ARPU) at $84.60, whereas Egypt represents a high-volume market with over five times the player base of the UAE but a much lower ARPU of $3.50.
The monetization landscape is defined by a shift toward multi-platform engagement and a high percentage of unbanked or underbanked consumers. Approximately 67% of the MENA population lacks access to traditional credit or debit cards, creating a significant barrier for standard app store transactions. In Egypt, credit card penetration is as low as 2.8%, leading to the dominance of local digital wallets like Vodafone Cash. Conversely, KSA and the UAE feature high internet penetration and 5G coverage, with players increasingly favoring hybrid free-to-play models, premium titles, and subscription services.
Direct-to-consumer (D2C) payment platforms and web shops are identified as critical tools for navigating these market complexities. By bypassing the traditional 30% commission fees of major app stores, developers can offer localized pricing, regional payment methods, and enhanced loyalty rewards. Findings indicate that 53% of paying mobile and PC gamers in the region have already made purchases through official game websites. Successful market entry requires a tailored approach that includes high-quality Arabic localization, culturalization of content, and the integration of local payment networks such as Mada in Saudi Arabia and Fawry in Egypt.
The analysis is based on a survey of 1,200 gamers, expert interviews, and proprietary market data. It concludes that the MENA-3 region offers a strategic bridge between Eastern and Western markets, providing a gateway to nearly 400 million Arabic speakers worldwide for companies that adopt flexible, region-specific monetization strategies.
- The MENA-3 gaming market (KSA, UAE, Egypt) generated $2 billion in player spending in 2024 and is projected to grow to over $2.7 billion by 2028.
- Payment infrastructure is a major barrier, as 67% of the regional population lacks access to traditional credit or debit cards, necessitating the integration of local payment networks like Mada in Saudi Arabia and Fawry in Egypt.
- Direct-to-consumer (D2C) web shops are essential for bypassing 30% app store fees, with 53% of paying gamers in the region already utilizing official game websites for purchases.
- The region exhibits extreme economic disparity, ranging from the UAE’s high ARPU of $84.60 to Egypt’s high-volume, low-ARPU market where credit card penetration is only 2.8%.
- Successful market entry requires a localized strategy that includes high-quality Arabic content and the adoption of flexible payment solutions to reach the broader market of nearly 400 million Arabic speakers.
+1
Xsolla & Niko PartnersJan 2025
Report61 pages
Mobile Monetization Report 2025
The global mobile gaming market reached $57.1 billion between 2023 and 2025, representing a 3.4% increase driven primarily by the App Store and emerging regions such as LATAM and MENA. While established markets like China and Japan experienced revenue contractions of up to 15%, the Strategy genre surged by over 25%, bolstered by a massive 213% increase in Card Battlers. A pivotal shift in the industry is the rise of direct-to-consumer revenue, which grew by 46% among the top 100 US titles as developers increasingly adopt webshops and alternative payment systems to bypass traditional platform fees.
Monetization trends indicate a widening performance gap between platforms, with the App Store consistently outperforming Google Play in both revenue growth and average revenue per paying user. In the United States, the share of high-value players spending over $100 rose from 22% to 32%, while the App Store’s 90-day ARPPU climbed by 71%. This growth is largely attributed to rising transaction values, including the introduction of $159.99 price caps in top-tier titles. Conversely, Google Play’s growth remains dependent on a higher frequency of smaller, low-priced purchases, particularly as the RPG sector faces a 15% decline and a significant drop in Android spending.
Genre-specific performance reveals a move toward diversification and sophisticated LiveOps. The Puzzle genre grew by 15%, led by a 911% revenue explosion in Block Puzzles, while the Hybridcasual segment saw in-app purchase revenue surge by 84% through the standardization of Season Passes and failure-triggered offers. Despite a 7.5% decline in the Casino market, the Simulation genre successfully increased average purchase values by 52%. Across all segments, developers are prioritizing customizable bundles and high-value special offers to maintain engagement and offset declining purchase frequencies among long-term players.
- Top US mobile titles are increasingly bypassing platform fees, with direct-to-consumer revenue via webshops and alternative payment systems growing by 46%.
- The App Store is significantly outperforming Google Play, evidenced by a 71% increase in 90-day ARPPU and a rise in high-value US players spending over $100 from 22% to 32%.
- The Strategy genre surged over 25% globally, driven by a 213% explosion in Card Battlers, while the Puzzle genre grew 15% behind a 911% revenue spike in Block Puzzles.
- Hybridcasual games are successfully monetizing through IAPs, which surged 84% due to the standardization of Season Passes and failure-triggered offers.
- While the global mobile market grew 3.4% to $57.1 billion, established markets like China and Japan contracted by up to 15%, shifting growth focus to emerging regions like LATAM and MENA.
+2
AppMagicJan 2025
Report47 pages
Mobile Games in 2025: Trends & Strategies Supercharging Revenue Growth
The global mobile gaming market entered a phase of intensified monetization and efficiency in 2024, characterized by a 3.8% increase in consumer spending to $65.7 billion despite a 6.6% decline in total downloads. This shift indicates a maturing landscape where revenue is driven by an 11.2% rise in spending per download rather than sheer user acquisition volume. Although the number of new game releases plummeted by over 43%, the highest-quality titles are achieving financial success at an accelerated pace, reaching the $1 million revenue milestone nearly twice as fast as they did in 2022. Geographically, the United States maintains its position as the primary revenue engine with $20.8 billion in spending, while India continues to dominate global download volume.
Mid-core titles, particularly Role-Playing Games, represent the most significant segment of the market, accounting for half of the top 1,000 earning games. While established giants like Tencent and Scopely maintain their dominance, new entries from China and Japan are capturing substantial global market share. Growth is also accelerating in emerging markets, with Brazil and Mexico both experiencing a 47% surge in spending. To maintain engagement and drive revenue spikes, developers are increasingly relying on high-impact intellectual property crossovers and collaborations, such as integrating popular media franchises into existing gameplay loops.
Monetization strategies have become highly standardized among top-performing titles, with 100% of the top 500 earning games utilizing consumables and limited-time offers. In-game advertising serves as a vital secondary revenue stream, with Unity Ads emerging as the most adopted platform among developers. Looking toward 2025, the industry is expected to be defined by the continued dominance of mid-core genres, the strategic expansion of IP-based events, and the rising economic influence of Latin American markets. Success in this environment requires a focus on high-value user retention and sophisticated monetization frameworks to offset the broader decline in new release volume.
- The mobile gaming market is shifting toward higher monetization efficiency, evidenced by a 3.8% increase in consumer spending to $65.7 billion despite a 6.6% decline in total downloads.
- Spending per download rose by 11.2% in 2024, as the industry prioritizes high-value user retention over the volume-based acquisition strategies of previous years.
- New game releases dropped by over 43%, yet top-tier titles are reaching the $1 million revenue milestone nearly twice as fast as they did in 2022.
- Mid-core titles, specifically Role-Playing Games, dominate the financial landscape, accounting for 50% of the top 1,000 earning games.
- Emerging markets are becoming critical growth engines, with Brazil and Mexico recording a 47% surge in consumer spending.
+2
AppFiguresJan 2025
Report28 pages
2025 State of Mobile Gaming: In-App Purchase Trends of Leading Apps
The 2025 State of Mobile Gaming report analyzes the transition of the mobile gaming industry into a new growth phase characterized by refined monetization and sophisticated user acquisition. Based on an anonymized dataset of 100 leading global gaming advertisers and Sensor Tower estimates spanning 24 months, the analysis tracks the evolution of In-App Purchase (IAP) trends across 2.3 billion projected players.
The findings indicate that while global install volume remained flat in 2024, IAP revenue grew by 4%. This growth is driven by a 6% increase in install-to-payer conversion rates and improved long-term monetization, with Day 90 Average Revenue Per Paying User (ARPPU) rising by 6%. A significant shift in platform dominance has occurred, with iOS now generating 55% of global IAP revenue. High-value users represent a critical concentration of wealth; specifically, the top 5% of payers generate 48% of total revenue. In the United States, a mere 0.02% of global installs—representing high-spending iOS users—account for 20% of total global gaming revenue.
Market dynamics show fierce competition for these spenders, with the top 1% of iOS winning bid prices increasing by 140% year-over-year. To counter rising costs in mature markets like the U.S. and Tier 1 regions, leading advertisers are diversifying into the Rest of World (ROW) and emerging markets, where iOS revenue grew by 19% and 31% respectively.
Successful strategies among the top five advertisers include a heavy reliance on Return on Ad Spend (ROAS) optimization, a 5x higher investment in interactive playable creatives, and a 3x greater focus on re-engagement campaigns compared to the broader industry. The report concludes that the industry is moving toward a hybrid model where casual gameplay mechanics are blended with deep IAP structures to maximize lifetime value across a global audience.
- Global IAP revenue grew by 4% in 2024 despite flat install volume, driven by a 6% increase in both install-to-payer conversion rates and Day 90 ARPPU.
- The top 5% of players generate 48% of total revenue, with a hyper-niche segment of U.S. iOS users (0.02% of global installs) accounting for 20% of all global gaming revenue.
- Competition for high-value spenders has intensified, causing bid prices for the top 1% of iOS users to surge by 140% year-over-year.
- iOS now dominates the market, generating 55% of global IAP revenue, while emerging markets and the Rest of World (ROW) saw iOS revenue growth of 31% and 19% respectively.
- Top-performing advertisers are countering rising acquisition costs by investing 5x more in interactive playable creatives and 3x more in re-engagement campaigns than the industry average.
+2
MolocoJan 2025

Report47 pages
How to Prepare Your Live Ops for the Holiday Season
A well‑designed Live Ops strategy is essential for capitalising on the heightened player activity that occurs during the holiday period. Analysis of hundreds of mobile games worldwide demonstrates that a coherent Live Ops framework can produce a substantial uplift in sessions, revenue and player retention throughout the season. The core argument is that developers should treat the holidays as a series of tightly integrated, short‑term experiences that reinforce the game’s everyday loop while delivering clear, time‑bound incentives.
Short‑term events that run for one to three days are most effective for generating quick spikes in engagement. These events focus on immediate objectives—such as a burst of sessions, a specific resource collection, or a limited‑time reward—while employing a “soft‑sawtooth” difficulty curve that eases players in, ramps up challenge, offers a brief respite, and then escalates again. By keeping the event mechanics a natural extension of the main gameplay loop, developers avoid disrupting player expectations and maintain momentum.
For the broader holiday window, the most successful structures combine a single, clearly defined Battle‑Pass progression path with social‑cooperation events that reward group performance through prestige items like avatars, badges and leaderboard positions. Layering weekly quests, long‑term collection albums, and brief “bonus amplifier” events creates cumulative engagement loops. Linking these components through shared currencies and diversified motivations systematically drives both retention and monetisation, particularly for mature titles that benefit from community‑driven competition.
Overall, the guidance applies to the global mobile gaming sector during the Q4 holiday season and emphasizes that incremental, interconnected events—anchored by transparent progression and social incentives—are the key levers for maximising holiday‑season performance.
- Implement a series of short-term, 1-to-3-day events to generate immediate spikes in player engagement and session frequency.
- Structure holiday content as a 'soft-sawtooth' difficulty curve that alternates between periods of challenge and respite to maintain player momentum.
- Integrate holiday events directly into the core gameplay loop to ensure they feel like natural extensions of the existing experience rather than disruptive additions.
- Combine a single, clear Battle-Pass progression path with social-cooperation events to drive both retention and monetization through group-based prestige rewards.
- Layer weekly quests, long-term collection albums, and brief 'bonus amplifier' events to create cumulative engagement loops.
+2
Sensor TowerJan 2025

Report8 pages
UGC Impact Study 2025
The 2025 UGC Impact Study, conducted by GameDiscoverCo and commissioned by mod.io, analyzes the commercial and engagement benefits of integrating official user-generated content (UGC) support into video games. The research demonstrates that games offering official modding tools or content-sharing solutions consistently outperform those without such features across PC, console, and VR platforms. By examining a dataset of approximately 1,200 Steam games that generated at least $1 million in their first month, the study finds that titles with UGC support see an 8% revenue advantage after one year, which expands to 31% after five years.
The primary driver for this long-term financial success is significantly higher player retention. On PC, games with UGC support maintain 75% higher concurrent user counts after two years and 115% higher after five years compared to games without these features. Furthermore, the research refutes concerns regarding the cannibalization of official content; games with UGC support actually see 105% higher median revenue per DLC. Case studies, such as Baldur’s Gate 3 and SnowRunner, support these findings, with the latter noting that players using mods were 2.4 times more likely to purchase official DLC.
The scope of the study extends beyond PC to include PlayStation, Xbox, and Meta Quest platforms. On consoles, the impact is even more pronounced in the short term, with UGC-supported titles showing a 16% performance boost on PlayStation and a 24% boost on Xbox after one year. In the VR sector, titles with UGC support experienced 30% more median growth over the past year than those without. The methodology evolved from previous years to include not just Steam Workshop, but also middleware solutions like mod.io and proprietary studio tools, suggesting that the positive correlation between UGC and commercial longevity is a robust, industry-wide trend.
- Games with official UGC support see a 31% revenue advantage over non-UGC titles after five years, growing from an 8% advantage in the first year.
- UGC support drives long-term player retention, resulting in 75% higher concurrent user counts after two years and 115% higher after five years on PC.
- Official UGC does not cannibalize sales; games with modding support see 105% higher median revenue per DLC, with SnowRunner players using mods being 2.4 times more likely to purchase official DLC.
- Console platforms show significant short-term gains from UGC integration, with a 16% performance boost on PlayStation and a 24% boost on Xbox after one year.
- VR titles integrating UGC support experienced 30% more median growth over the past year compared to those without such features.
+2
GameDiscoverCoJan 2025
Report37 pages
The Intrinsic In-Game Advertising Key Trends Report H1 2025
Intrinsic in-game advertising (IIGA) has transitioned into a measurable, high-impact media channel that allows brands to reach premium gaming environments through buying approaches similar to traditional digital and broadcast media. The primary thesis of this analysis is that gaming offers a unique, year-round engagement opportunity that remains consistent even when traditional channels like television and social media experience seasonal dips. By integrating non-disruptive, native ads into gameplay, advertisers can achieve significant full-funnel impact, including a 20-point lift in ad recall and a 21% lower cost per acquisition (CPA) compared to standard goals.
The findings are based on aggregated internal data from 105 games and 333 direct advertisers, supplemented by third-party research from partners such as IAS, Lumen, and Comscore. The scope is global, with specific insights covering North America, Europe, LATAM, and APAC throughout the 2024 calendar year. While mobile currently offers 25 times the scale of impressions and greater audience diversity, PC and console platforms provide superior immersion, with significantly longer session lengths and higher total playtime per user.
Key data points highlight that IIGA outperforms traditional digital formats in attention, delivering 2,957 attentive seconds per thousand impressions—nearly triple the performance of Facebook Infeed. Regional trends indicate that while North America and Europe command the highest CPMs, emerging markets like APAC and LATAM offer cost-effective growth opportunities. Furthermore, genre-specific data reveals that sports and racing titles see engagement peaks tied to real-world competitions, while simulation games offer a steady, female-skewing audience. The report concludes that advertisers should move beyond seasonal buying habits to capitalize on gaming’s "always-on" nature, particularly during Q1 when CPMs are lower but engagement remains high.
- Intrinsic in-game advertising (IIGA) delivers 2,957 attentive seconds per thousand impressions, nearly triple the performance of Facebook Infeed.
- Adopting IIGA drives a 20-point lift in ad recall and a 21% lower cost per acquisition (CPA) compared to standard digital benchmarks.
- Mobile platforms provide 25 times the scale of impressions and greater audience diversity, while PC and console platforms offer superior immersion through longer session lengths.
- Advertisers can optimize budgets by shifting to an 'always-on' strategy, specifically targeting Q1 when CPMs are lower but engagement remains consistent.
- Sports and racing titles show engagement peaks aligned with real-world events, whereas simulation games provide a consistent, female-skewing audience.
+1
AnzuJan 2025
Report27 pages
Unlocking Games Revenue: Player Behavior and Payment Trends in the West
Unlocking Games Revenue: Player Behavior and Payment Trends in the West examines the evolving monetization landscape across North America and Europe. Produced through a partnership between Newzoo and Tebex, the analysis combines market intelligence with transaction data from over $1 billion in processed payments. The primary thesis suggests that as payer growth in mature Western markets plateaus—with a projected Compound Annual Growth Rate (CAGR) through 2027 of only 1.1% in North America and 3.1% in Europe—industry success depends on maximizing value from existing players through diversified payment methods and localized monetization strategies.
The scope of the research focuses on PC, console, and mobile platforms in 2024 and 2025. Findings indicate that while North America and Europe house only 20% of the global player base, they account for 46% of total gaming spend. North America leads the world in average annual spend per payer at $324.90, compared to $125.40 in Europe. Regional motivations for spending differ significantly; North American players prioritize personalization and character customization, whereas European players are more value-conscious, citing sales, special offers, and the removal of advertisements as primary drivers for transactions.
A critical finding involves the impact of alternative payment methods on Average Transaction Value (ATV). While traditional cards and digital wallets dominate total volume, emerging methods like Buy Now, Pay Later (BNPL) and cryptocurrency yield significantly higher ATVs. In North America, BNPL transactions average $85.00 compared to $52.20 for cards. Furthermore, the data shows that players using both traditional and alternative methods do not decrease their transaction frequency, suggesting that offering diverse payment options directly unlocks higher spending tiers. The analysis concludes that studios must reduce friction in payment flows and embrace unbundled, web-based storefronts to maintain loyalty and revenue in a maturing market.
- Growth in mature Western markets is plateauing, with projected 2027 CAGRs of only 1.1% in North America and 3.1% in Europe, shifting the focus to maximizing value from existing players.
- North America and Europe represent 46% of global gaming spend despite housing only 20% of the global player base.
- North American players spend an average of $324.90 annually, significantly higher than the $125.40 average annual spend per payer in Europe.
- Alternative payment methods like Buy Now, Pay Later (BNPL) yield higher Average Transaction Values (ATV) than traditional methods, with North American BNPL transactions averaging $85.00 compared to $52.20 for cards.
- Monetization strategies must be localized: North American players prioritize personalization and customization, while European players are driven by value, sales, and ad removal.
+2
Newzoo & TebexJan 2025
Report37 pages
Games Industry in 2025
The global games content and services market reached a record $199.4 billion in 2024, a 3.5% year-on-year increase that surpassed pandemic-era peaks. Despite this financial milestone, the industry faces significant structural challenges, including widespread layoffs, studio closures, and a shift toward de-risking strategies. Growth is expected to slow to 0.9% in 2025, largely due to the delay of Grand Theft Auto VI into 2026, which is projected to remove $2.7 billion from the 2025 console market. However, the industry is forecast to surpass the $200 billion threshold for the first time in 2025, with growth accelerating to 2.2% in 2026.
Key growth opportunities center on new hardware and emerging markets. The anticipated launch of the Nintendo Switch 2 in 2025 represents a $7-8 billion content opportunity, with significant potential for increased in-game monetization. Geographically, the Middle East, Africa, and Southeast Asia are expected to outperform Western markets, with the Middle East and Africa projected to grow by 6.3% in 2025. Additionally, significant headroom exists in mature markets like the U.S. by targeting underserved cohorts, specifically females aged 16-24 and adults over 55.
The industry is navigating a transition in monetization and platform dynamics. In-game spending accounts for 77% of total revenue, while physical media is expected to dwindle to just 2% of the market by 2026. To combat escalating AAA development costs, publishers are increasingly utilizing remakes, remasters, and transmedia franchise strategies. While mobile gaming remains the largest segment at 58% market share, PC gaming showed the strongest growth in 2024 at 5.7%. The analysis utilizes proprietary market modeling, financial KPIs, and quantitative consumer research across global regions to provide a comprehensive outlook through 2026.
- The global games market reached $199.4 billion in 2024, but growth is projected to slow to 0.9% in 2025 due to the delay of Grand Theft Auto VI into 2026.
- In-game spending now drives 77% of total industry revenue, while physical media is expected to decline to just 2% of the market by 2026.
- The launch of the Nintendo Switch 2 in 2025 is expected to create a $7–8 billion content opportunity with significant potential for increased in-game monetization.
- Mobile gaming maintains the largest market share at 58%, though PC gaming recorded the strongest growth in 2024 at 5.7%.
- Emerging markets in the Middle East and Africa are projected to grow by 6.3% in 2025, significantly outpacing growth in Western regions.
+1
Ampere AnalysisJan 2025

Report11 pages
Gaming’s Cheating Crisis Report: The Impact on Players and Profit
The gaming industry is currently facing a significant integrity crisis, with 80% of players reporting encounters with cheaters in online environments. This prevalence has transformed cheating from a fringe issue into a routine experience for the majority of the community, with over half of gamers encountering unfair play at least several times a month. The widespread availability of cheating tutorials on social media platforms like YouTube and TikTok has further exacerbated the problem, creating a cycle where 62% of players admit to feeling tempted to cheat themselves.
The impact of this crisis extends beyond player frustration to significant financial and operational risks for developers. Approximately 42% of gamers have considered quitting specific titles due to cheaters, and 55% have either reduced or stopped their in-game spending entirely. This trend is particularly pronounced among high-value players, threatening the core revenue models of modern live-service games. Despite these challenges, there remains a high level of trust in developers to solve the issue, with 94% of players believing studios can effectively address the problem.
Data suggests a strong appetite for robust, industry-wide solutions. Approximately 73% of gamers are willing to undergo identity verification to ensure cheat-free matchmaking, and 79% support cross-game penalties where bans follow a player across multiple titles. Furthermore, 83% of respondents indicated they would be more likely to play a game credibly marketed as "cheat-free." These findings suggest that implementing verified identity systems could restore accountability, protect revenue streams, and improve player retention.
The research was conducted by Atomik Research on behalf of PlaySafe ID, surveying 2,013 adult PC gamers across the United Kingdom and the United States in July 2023. The sample consisted of active players, 82% of whom play multiple times per week, primarily focusing on first-person shooters, sports games, and casual titles.
- Cheating is a pervasive issue, with 80% of online players reporting encounters and over half experiencing unfair play at least several times a month.
- Financial stability is at risk, as 55% of gamers have reduced or stopped in-game spending and 42% have considered quitting specific titles due to cheating.
- Players are highly receptive to stringent security measures, with 73% willing to undergo identity verification and 79% supporting cross-game bans to ensure fair play.
- Marketability is directly tied to integrity, as 83% of players are more likely to engage with titles explicitly marketed as 'cheat-free'.
- Social media platforms like YouTube and TikTok are fueling the crisis by providing widespread access to cheating tutorials, leading 62% of players to feel tempted to cheat.
+1
PlaySafe IDJan 2025
Report7 pages
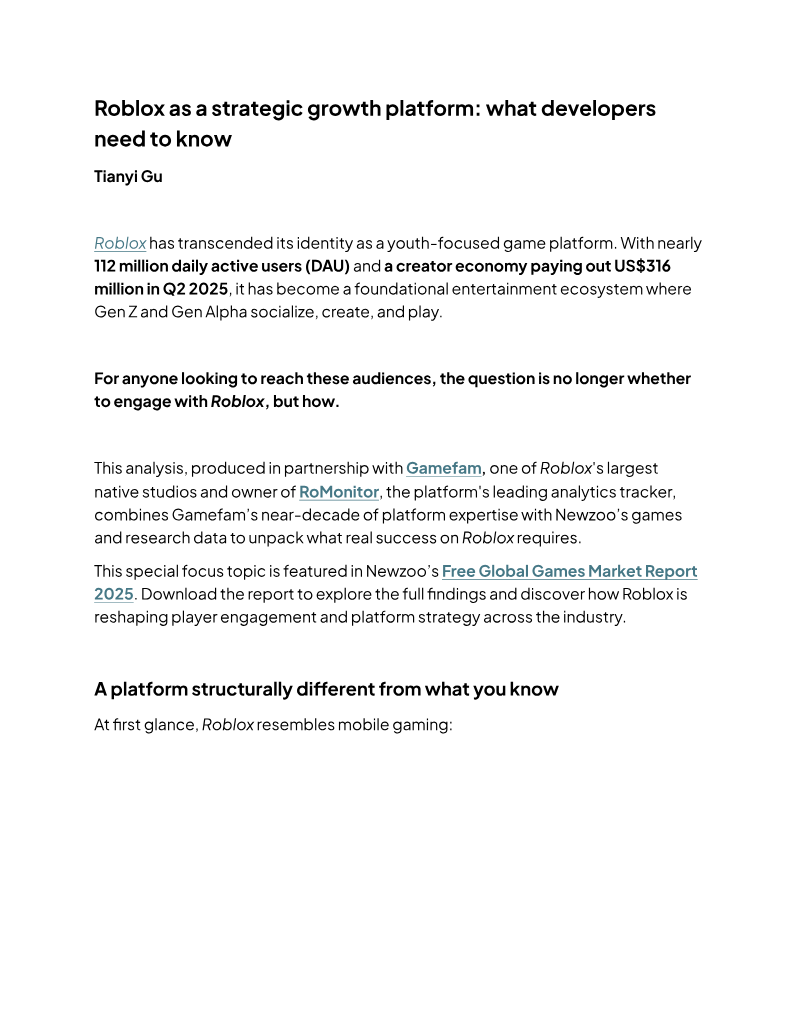
Roblox as a Strategic Growth Platform: What Developers Need to Know
Roblox has evolved from a youth-centric gaming site into a massive entertainment ecosystem and creator economy, boasting nearly 112 million daily active users and distributing over $300 million to creators in a single quarter. While the platform shares structural similarities with mobile gaming—such as an 80% mobile user base and monetization driven by cosmetics and gacha—it functions more like a social media platform such as TikTok or YouTube. Success is dictated by cultural fluency, rapid iteration, and social momentum rather than high graphical fidelity or traditional production cycles.
The platform’s audience is maturing, with the 13+ demographic growing at 54% year-over-year, significantly outpacing younger cohorts. This shift brings higher spending power and more sophisticated expectations to the ecosystem. Data indicates that Roblox is not a siloed experience; only 24% of players engage exclusively on mobile, with significant playtime occurring on PlayStation and PC. The genre landscape is dominated by Roleplay, Simulation, and Platformers, characterized by low-friction, social, and trend-driven mechanics that prioritize accessibility over complex skill sets.
For traditional developers, the platform serves as a strategic testing ground for intellectual property and audience cultivation among Gen Z and Gen Alpha. Because the discovery algorithm rewards speed and native platform knowledge, established studios are increasingly partnering with Roblox-native creators to navigate the unique development rhythm. The most effective strategies treat the platform as a long-term engagement tool rather than a standard publishing channel, focusing on branded activations and collaborative IP experiences to build brand affinity with the next generation of gamers.
- Roblox has scaled to 112 million daily active users and distributed over $300 million to creators in a single quarter, functioning more like a social media platform than a traditional gaming engine.
- The 13+ demographic is the platform's fastest-growing segment, increasing by 54% year-over-year and bringing higher spending power to the ecosystem.
- Success on the platform is driven by cultural fluency and rapid iteration rather than graphical fidelity, with discovery algorithms favoring native platform knowledge over traditional production cycles.
- Only 24% of players are mobile-exclusive, with significant engagement occurring across PlayStation and PC, necessitating a cross-platform approach to user retention.
- Established studios are increasingly partnering with Roblox-native creators to navigate the platform's unique development rhythm and trend-driven mechanics.
+2
NewzooJan 2025
Report26 pages
Video Gaming Report: How Platforms Are Colliding and Why This Will Spark the Next Era of Growth
The video gaming industry is transitioning into a new era of growth following a post-pandemic stabilization period. While the sector is unlikely to replicate the rapid doubling of the 2010s, a convergence of technological and structural shifts is expected to revitalize the market. This evolution is driven by four primary strategic trends: the integration of Generative AI, the expansion of the user-generated content (UGC) creator economy, the mainstream adoption of cloud gaming, and the regulatory opening of mobile app stores.
Key findings indicate that Generative AI is already being utilized by approximately 50% of studios to improve development efficiency and create adaptive gameplay, with 20% of new Steam games disclosing AI use by mid-2025. Simultaneously, the creator economy is surging; payouts from platforms like Roblox and Fortnite are projected to exceed $1.5 billion in 2025. Cloud gaming is also positioned for a massive scale-up, with revenues forecasted to grow from $1.4 billion in 2025 to $18.3 billion by 2030. This shift toward hardware-agnostic play is mirrored in distribution, where 33% of adult gamers have already purchased titles directly from developer web stores to bypass traditional platform fees.
The scope of this analysis is global, with a particular focus on major markets including the US, China, Germany, Japan, and South Korea. It covers the industry from late 2025 through projections for 2030, spanning mobile, console, and PC segments. Data is derived from the Global Gaming Survey of approximately 3,000 gamers, metadata analysis of the Steam platform, and interviews with industry leaders and developers.
The industry concludes that success in this new landscape requires a departure from traditional "console war" mentalities in favor of ecosystem-based strategies. Developers must master new monetization models, such as tiered pricing and windowing, to protect the value of premium content while navigating a market increasingly defined by infinite digital shelf space and algorithmic discovery.
- Cloud gaming revenue is projected to scale from $1.4 billion in 2025 to $18.3 billion by 2030, marking a transition toward hardware-agnostic play.
- The creator economy is expanding rapidly, with payouts to creators on platforms like Roblox and Fortnite projected to exceed $1.5 billion in 2025.
- Generative AI is currently used by 50% of studios to enhance development efficiency, with 20% of new Steam games expected to disclose AI usage by mid-2025.
- Direct-to-consumer distribution is gaining traction, as 33% of adult gamers have already purchased titles via developer web stores to circumvent traditional platform fees.
- Industry success now requires shifting from console-centric competition to ecosystem-based strategies that utilize tiered pricing and windowing to manage content value.
+1
Boston Consulting GroupJan 2025
Report46 pages
Digital Market Index: Q4 2024
Global digital markets reached a significant milestone in the final quarter of 2024, with in-app purchase revenue hitting a record $39.4 billion. This growth was primarily fueled by a 28.2% year-over-year surge in non-game applications, exemplified by TikTok becoming the first app to surpass $6 billion in annual revenue. While the iOS ecosystem remains the primary driver of monetization by capturing 70% of total revenue, Google Play maintains its dominance in scale, facilitating nearly three-quarters of the 34.1 billion global downloads recorded during the period.
The mobile gaming landscape underwent a notable structural shift as consumer preferences migrated from traditional RPGs toward Strategy and Puzzle titles. Strategy games experienced a 26% year-over-year increase in downloads, helping to offset regional revenue declines in major markets like Japan and South Korea. Despite these shifts, Japan’s mobile sector showed signs of overall recovery, while emerging Android markets in Indonesia and Pakistan continued to expand rapidly. The successful launch of high-profile titles like Pokémon TCG Pocket further stabilized the gaming sector during this transition.
Advertising and retail media also reached unprecedented levels, with U.S. digital ad spend hitting $34 billion. Social media channels dominated this space, accounting for 77% of total expenditures as major retailers like Amazon and Walmart increased holiday investments. Retail media specifically generated a record 75.4 billion impressions, driven by high demand in consumer electronics and personal care. Strategic co-branded partnerships, such as the collaboration between Best Buy and Samsung, emerged as critical drivers of visibility, cementing the role of retail platforms as essential components of the broader digital advertising ecosystem.
- Global in-app purchase revenue reached a record $39.4 billion in Q4 2024, bolstered by a 28.2% year-over-year surge in non-game application spending.
- TikTok became the first application to surpass $6 billion in annual revenue, highlighting the massive monetization potential of non-game platforms.
- The iOS ecosystem captured 70% of total revenue, while Google Play maintained its dominance in scale by facilitating nearly 75% of the 34.1 billion global downloads.
- U.S. digital ad spend hit $34 billion in Q4 2024, with social media channels accounting for 77% of total expenditures.
- Mobile gaming preferences shifted toward Strategy and Puzzle titles, with Strategy games seeing a 26% year-over-year increase in downloads to help offset regional revenue declines in Japan and South Korea.
+1
Sensor TowerDec 2024
Report15 pages
Levelling Up: State of India Interactive Media & Gaming Research FY'24
The Indian interactive media and gaming market reached a valuation of $3.8 billion in FY24, representing a significant 30% share of the country’s broader $12.5 billion new media sector. Growth is characterized by a 20% five-year projected CAGR, with expectations to exceed $9.2 billion by FY29. This expansion is primarily driven by a 41% year-on-year increase in in-app purchase revenue, particularly within the midcore segment, which grew by 53%. While Real Money Gaming (RMG) remains a major contributor, recent changes to the GST regime have led to margin compression and increased user acquisition costs for operators in that sub-sector.
The player base in India has expanded to 590 million gamers, with 148 million identified as paying users. Engagement metrics show a 30% increase in average weekly time spent, rising from 10 to 13 hours. Demographic data reveals a diversifying landscape where 44% of gamers are women and 66% reside in non-metro cities. Notably, there is a high degree of overlap between gaming categories, as over 60% of RMG paying users also spend money on midcore titles. Payment behaviors are heavily modernized, with 83% of users utilizing UPI or digital wallets for transactions.
The regulatory environment is shifting toward formal recognition and support, with the government identifying gaming as a "sunrise sector." New frameworks distinguish between RMG and Free-to-Play (F2P) games for taxation purposes, while esports has been officially integrated under the Ministry of Youth Affairs and Sports. These findings are based on a mixed-methods research design conducted between May and October 2024, incorporating a primary survey of 2,269 smartphone users across 16 Indian cities alongside secondary analysis of financial statements and proprietary industry data.
- The Indian interactive media and gaming market reached a $3.8 billion valuation in FY24 and is projected to grow at a 20% CAGR to exceed $9.2 billion by FY29.
- In-app purchase revenue grew 41% year-on-year, with the midcore segment serving as a primary growth driver after experiencing a 53% increase.
- India’s gaming population has reached 590 million, including 148 million paying users who now spend an average of 13 hours per week gaming, a 30% increase from previous metrics.
- The player demographic is increasingly diverse, with 44% of gamers being women and 66% residing in non-metro cities.
- Real Money Gaming (RMG) faces margin compression and rising user acquisition costs due to recent GST regime changes, though 60% of RMG payers also spend money on midcore titles.
+1
LumikaiNov 2024

Report22 pages
Global Indie Games Market Report 2024
The 2024 Global Indie Games Market Report by Video Game Insights analyzes the significant growth and evolving structure of the independent gaming sector on Steam from 2018 through September 2024. The central thesis posits that indie games have reached a historical milestone, with their revenue share doubling since 2018 to match the combined earnings of AA and AAA titles for the first time. This surge is largely attributed to the rise of "Triple I" games—high-budget independent projects with teams of over 50 people—which now account for more than half of all indie revenue.
Key findings highlight that 2024 was a record-breaking year driven by exceptional hits like Black Myth: Wukong and Palworld, which sold 20.6 million and 20.1 million units respectively. The data reveals an increasing concentration of wealth at the top of the market; excluding these two titles, all other 2024 indie releases combined generated less revenue than Black Myth: Wukong alone. Furthermore, the report identifies a trend toward studio maturity, noting that second and third releases typically outperform debut titles. Successful developers like Pocketpair and Sunlock Studios achieved massive hits only after releasing multiple previous games.
The scope of the analysis focuses on the Steam platform, segmenting the market into four categories: Triple I, Middle Market, Small Teams, and Hobbyists. While all segments saw a "boom" during the COVID-19 pandemic, the larger Triple I and Middle Market tiers have seen the most substantial long-term growth. Methodology involves proprietary algorithms and the Boxleiter method to estimate unit sales and gross revenue from public Steam data, adjusted for regional pricing and returns. The findings suggest that the traditional definition of "indie" is blurring as production qualities and budgets of top-tier independent games now rival those of major AAA studios.
- Indie games have reached a historical milestone, doubling their revenue share since 2018 to match the combined earnings of AA and AAA titles on Steam.
- High-budget 'Triple I' projects, defined as teams of over 50 people, now generate more than half of all indie market revenue.
- Market wealth is increasingly concentrated at the top, as 2024 hits Black Myth: Wukong and Palworld sold 20.6 million and 20.1 million units respectively.
- Excluding the two top-selling titles, all other indie games released in 2024 combined generated less revenue than Black Myth: Wukong alone.
- Studio maturity is a key success factor, as second and third releases from developers like Pocketpair and Sunlock Studios consistently outperform debut titles.
Video Game InsightsSept 2024

Report35 pages
Gaming Spotlight H1 2024
Mobile gaming solidifies its position as the leading segment of the global video‑game market, with revenue projected to reach $83 billion in 2024, reflecting a 6 percent year‑over‑year increase. In contrast, home‑console spending is expected to decline by 1 percent to $42 billion, while handheld revenues are slated to fall 2 percent to just under $2.5 billion. The upward trajectory of mobile is driven primarily by rapid expansion in emerging regions such as India and Indonesia, where user acquisition and spending are accelerating faster than in mature markets. Within mobile, fast‑growing sub‑genres—particularly simulators and multiplayer online battle arenas—accounted for $2.34 billion, representing 5.8 percent of total mobile revenue, and achieved a modest 0.4‑point rise in download share during the latest reporting period.
In the United States, monetisation patterns among mobile players continue to favour rewarded‑video advertisements. These ads recorded the highest net‑sentiment score of +20 points and were the most frequently encountered format in the third quarter of 2023. Other ad formats, including playable, native, banner/display, and standard video, lagged behind both in visibility and user sentiment, indicating a clear preference hierarchy that shapes publisher revenue strategies.
Overall, the data underscore a market increasingly centred on mobile platforms, propelled by growth in developing economies and reinforced by user‑friendly ad experiences. Console and handheld segments face modest contractions, suggesting that future investment and innovation will likely concentrate on mobile‑first titles, emerging‑region outreach, and optimisation of rewarded‑video ad ecosystems to sustain growth.
- Mobile gaming remains the dominant market segment with projected 2024 revenues of $83 billion, representing a 6 percent year-over-year increase.
- Home-console and handheld gaming segments are experiencing a decline, with projected revenues of $42 billion (down 1 percent) and $2.5 billion (down 2 percent) respectively.
- Growth in the mobile sector is primarily driven by rapid user acquisition and spending expansion in emerging markets, specifically India and Indonesia.
- Mobile simulators and multiplayer online battle arenas generated $2.34 billion in revenue, accounting for 5.8 percent of total mobile earnings and a 0.4-point increase in download share.
- Rewarded-video advertisements are the most effective monetization format in the U.S. market, achieving the highest net-sentiment score of +20 points during Q3 2023.
+2
Sensor TowerJun 2024