
Pokémon X
GameBy Game Freak · Released Oct 12, 2013
An all-new 3D Pokemon adventure packed with never-before-seen Pokemon will launch worldwide in October 2013. Pokemon X and Pokemon Y will present a new generation of Pokemon, and introduce players to an exciting new adventure in a breathtaking 3D world.
Connections
Each row is a game or company named alongside Pokémon X, each column a document, oldest first. A mark means that document names it. Select a row to see those documents.
About the game
- Released
- Oct 12, 2013
- Developer
- Game Freak
- Publishers
- The Pokémon Company, Nintendo
- Genres
- Role-playing (RPG), Turn-based strategy (TBS), Adventure
- Platforms
- Nintendo 3DS
- Links
- Official site, Wikipedia
Game data from IGDB.com
Pokémon X sales and key figures
In 2013, there were only five titles in the Japanese domestic market that achieved over 1 million units in shipments, with 'Pokémon X/Y' for the 3DS leading at 4.34 million units.
CESA – Computer Entertainment Supplier's Association, 2014 · 2014 CESA Games White Paper
The Nintendo 3DS performed strongly on software, led by Pokémon X and Y, which sold 12.26 million units globally.
Nintendo, 2014 · Nintendo Financial Results Briefing: Fiscal Year Ended March 2014, p. 5
Pokémon X and Pokémon Y sold a combined 11.61 million units globally, making them the key software performers in the period.
Nintendo, 2014 · Nintendo Financial Results Briefing for the Nine-Month Period Ended December 2013, p. 5
Documents about Pokémon X

Why Is Pokémon Go's PVP so Obfuscated? | Design Club
Pokémon Go maintains its status as a global mass-market phenomenon by prioritizing a streamlined, accessible interface that preserves the core fantasy of the franchise.
- Pokémon Go intentionally obfuscates critical combat data—such as Individual Values, energy costs, and damage-per-second—to maintain a streamlined, accessible interface for casual users.
- The game’s design creates a dual-layered experience where competitive play is hidden behind a high-stakes meta-game that is not documented within the application.
- Because essential mechanics like Same Type Attack Bonus and optimal move sets are not communicated in-game, players must rely on third-party tools and community wikis to build viable teams.
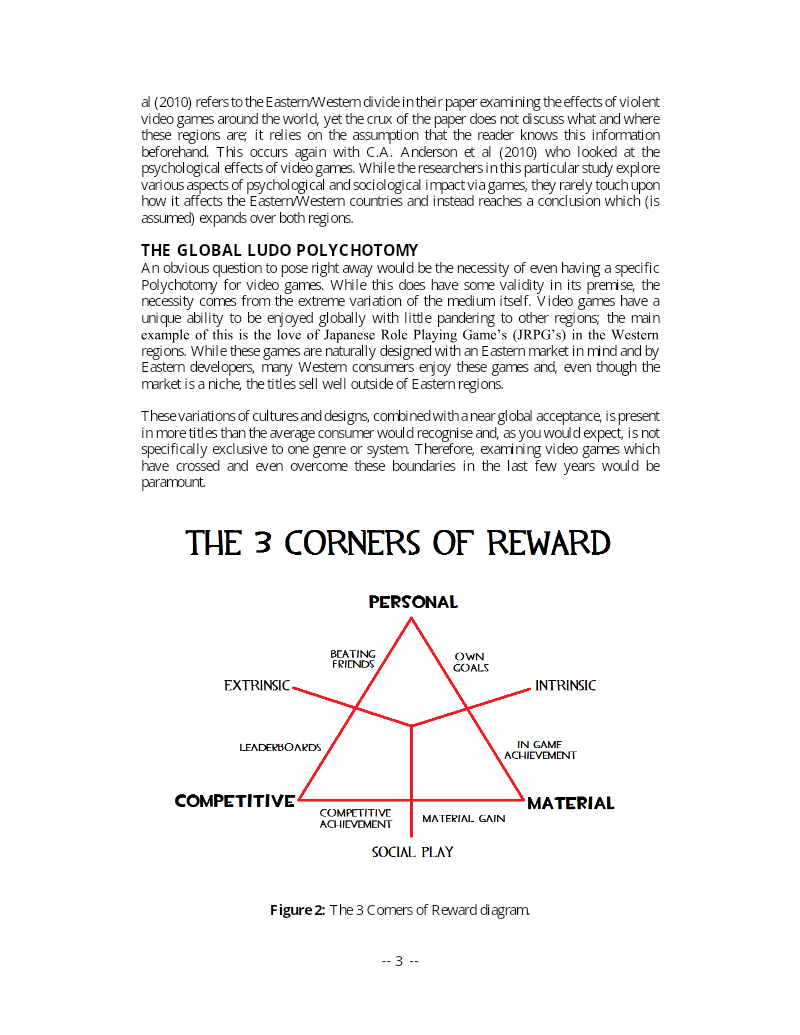
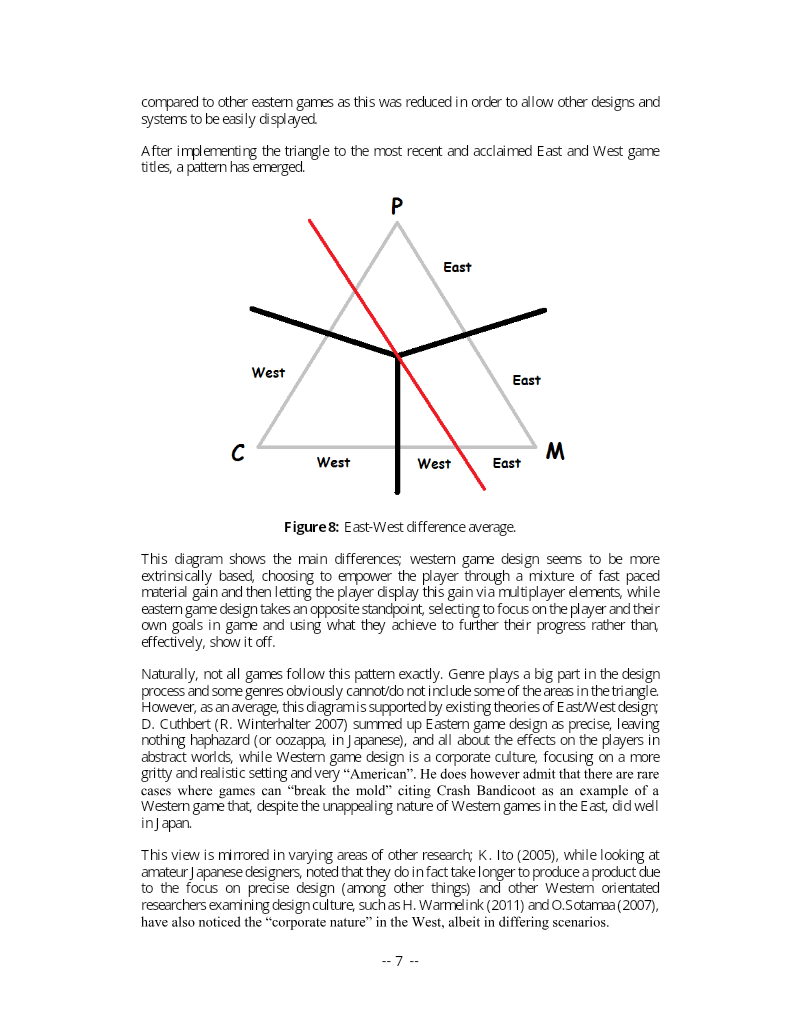
Defining the Global Ludo Polychotomy
This paper, presented at DiGRA 2015, examines whether the established East-West dichotomy, originally theorised by S. Meštrovic (1994) and applied to cultural and psychological studies, accurately describes the global video game industry.
2014 CESA Games White Paper
The 2014 CESA Games White Paper serves as a comprehensive annual industry report detailing the state of the home video game market.
- The 2014 CESA Games White Paper reports the Japanese domestic home video game market (hardware and packaged software) at 409.5 billion yen, with an additional 10.3 billion yen in the digital download software market.
- The global home video game market is estimated at 2.8222 trillion yen, comprising 1.1172 trillion yen in hardware and 1.705 trillion yen in software.
- The Wii reached a global cumulative hardware shipment milestone of over 100.9 million units, becoming the fifth platform in history to surpass the 100 million unit threshold.
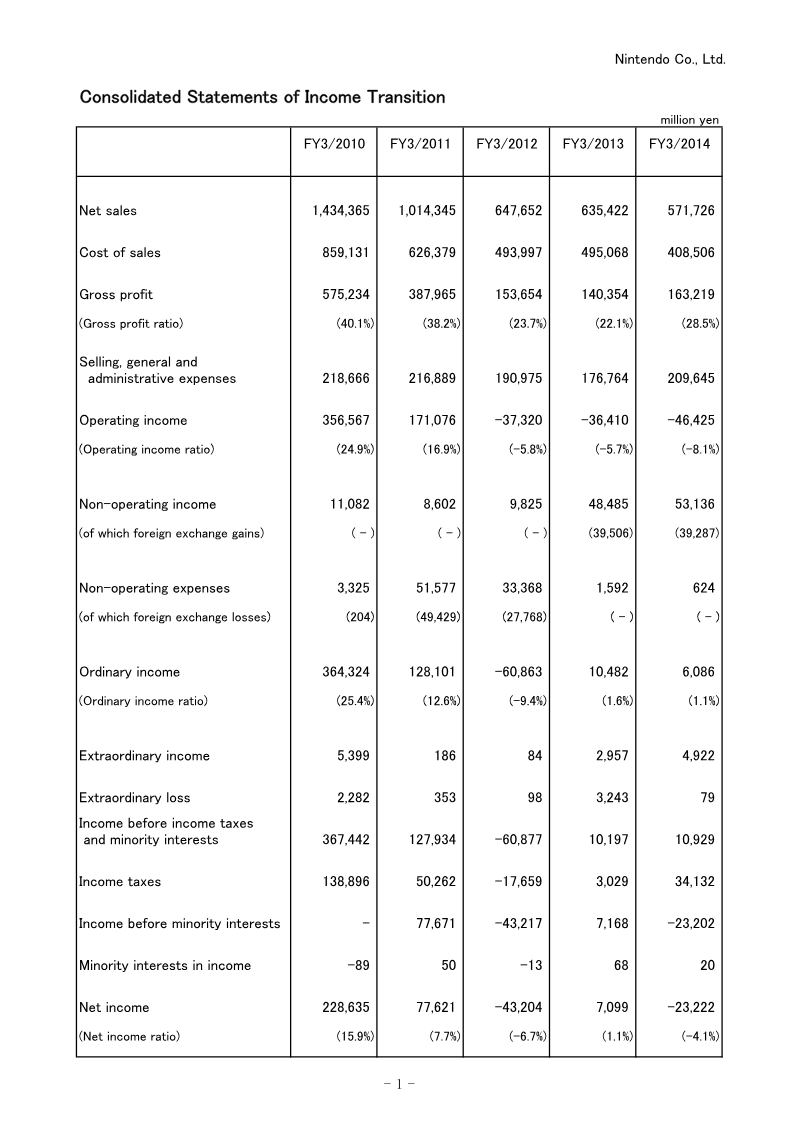
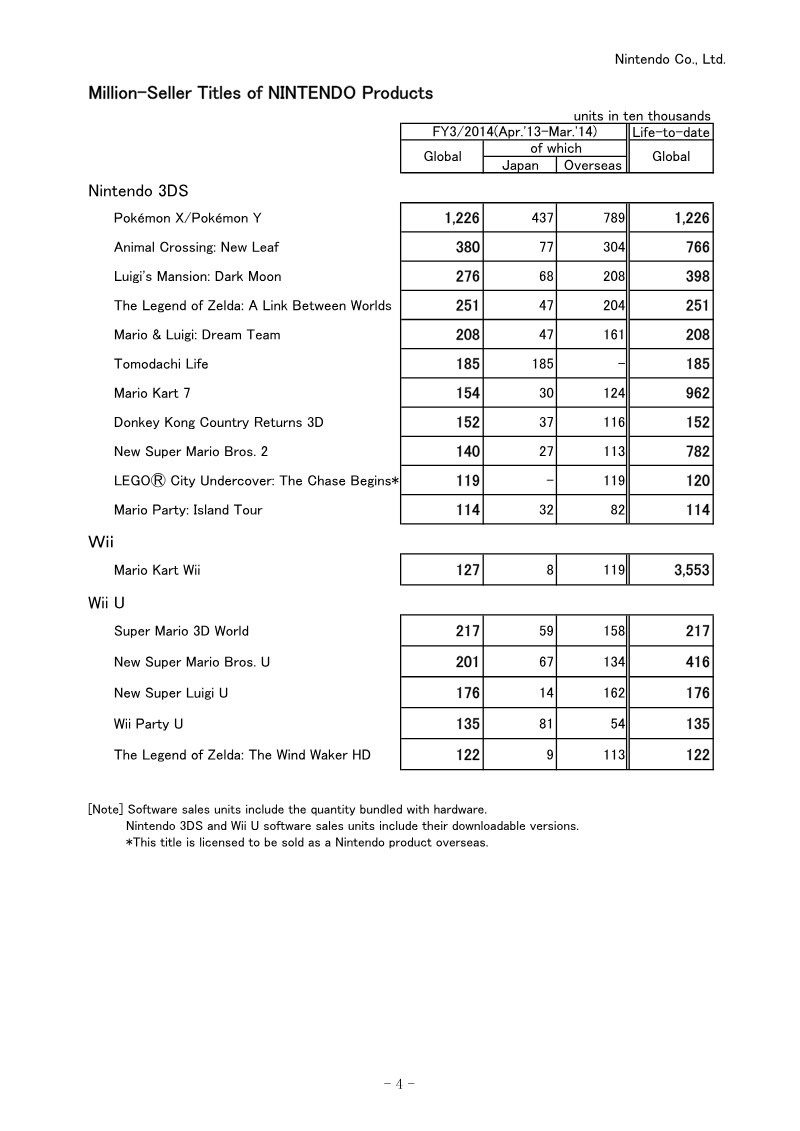
Nintendo Financial Results Briefing: Fiscal Year Ended March 2014
The financial results for the fiscal year ended March 2014 reflect a period of continued operational difficulty for Nintendo, characterized by declining net sales and persistent operating losses.
- Nintendo's net sales for the fiscal year ended March 2014 fell to 571.7 billion yen from 635.4 billion yen the prior year.
- The company's operating loss widened to 46.4 billion yen, up from a 36.4 billion yen loss in the previous fiscal year.
- Nintendo posted a net loss of 23.2 billion yen, which was partially offset by substantial foreign exchange gains recorded as non-operating income.
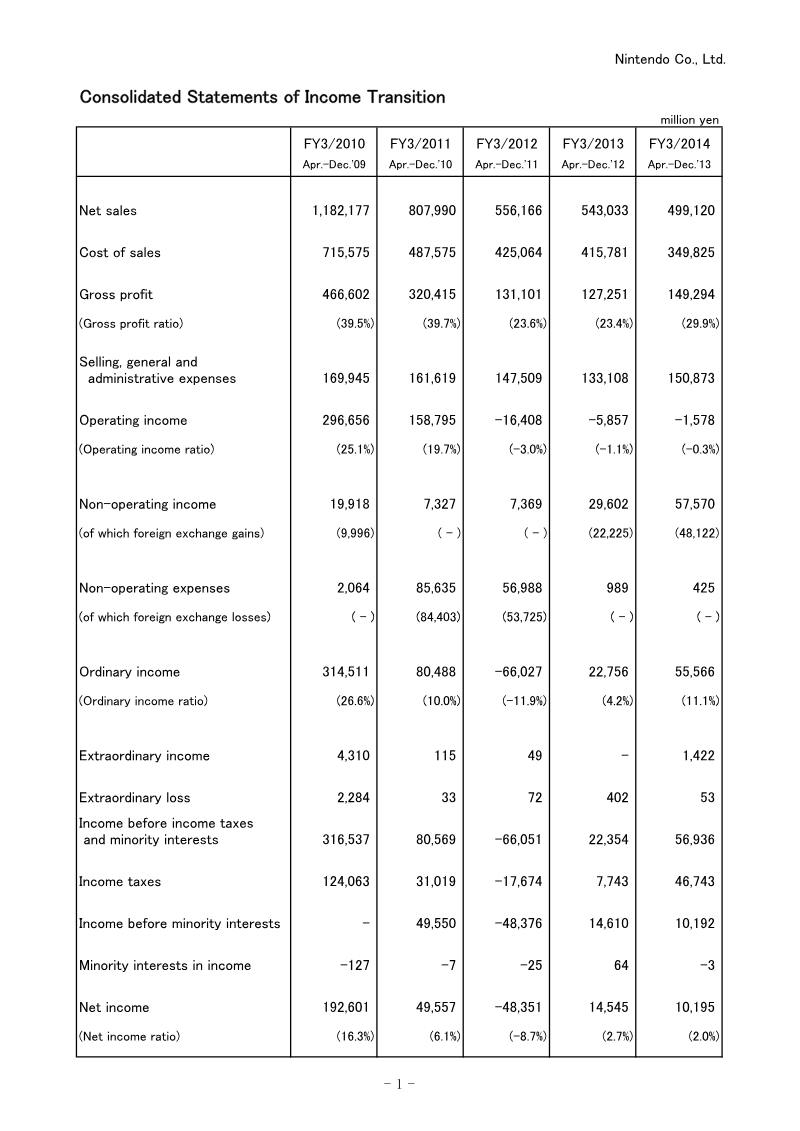
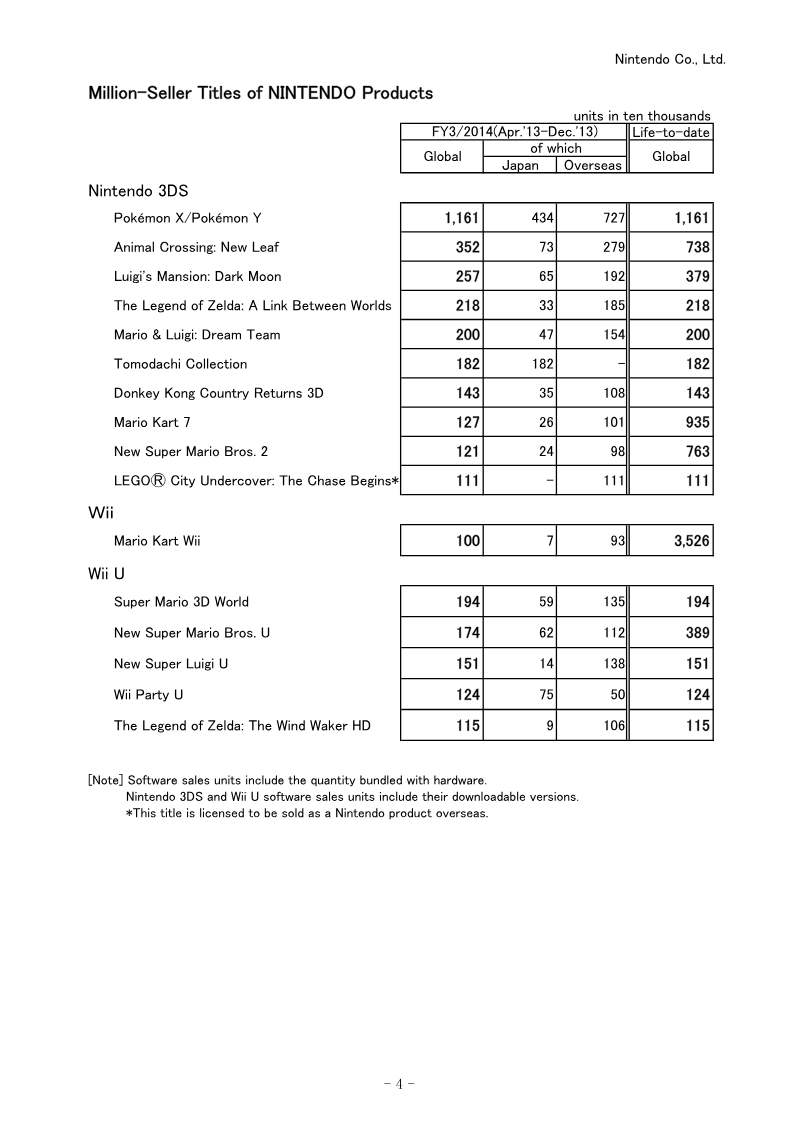
Nintendo Financial Results Briefing for the Nine-Month Period Ended December 2013
The financial results for the nine-month period ending December 31, 2013, reflect a challenging fiscal environment for Nintendo, characterized by declining net sales and narrow profitability margins.
- Nintendo's net sales for the nine months ended December 31, 2013 fell to 499.12 billion yen from 543.03 billion yen in the same period a year earlier.
- Nintendo posted an operating loss of 1.58 billion yen, but reported net income of 10.19 billion yen, a result driven largely by non-operating income.
- Foreign exchange gains of 48.12 billion yen in non-operating income lifted ordinary income to 55.56 billion yen, offsetting operational pressures.