In Game Advertising

46 documents·29 publishers

Documents

Page 1
Report24 pages

Games: India Plays!

The report examines the rapidly expanding Indian mobile gaming market, highlighting a projected 91 % share of online gamers playing on smartphones and an estimated revenue of US$2.2 billion in 2022, with a projected average revenue per user of US$1.5 by 2027. It distinguishes between non‑real‑money gaming (non‑RMG) and real‑money gaming (RMG), focusing on the top five non‑RMG genres—Adventure, Battle Royale, Puzzle, Arcade, and Racing—and key RMG categories such as card‑based games, sports‑fantasy, and casual RMG. Data sourced from Newzoo consumer research and MAAS campaign analytics reveal that 62 % of non‑RMG players are male, while RMG users skew slightly more balanced at 55 % male. Millennials and Gen‑Z (ages 13–41) dominate, with 55 % of adventure and battle royale players in the 13‑27 bracket. Motivations differ: non‑RMG gamers seek entertainment and challenge, whereas RMG players are driven by seasonal events like cricket tournaments or festive card‑game gatherings.

Key performance indicators for advertisers include install‑to‑registration rates of ~50 % for casual games and ~25 % for card‑based RMG, with retention dropping from 30 % on day one to 3 % by day thirty for casual titles. The analysis underscores the importance of vernacular creatives, cross‑interest programmatic targeting, and multi‑channel optimization to reduce audience overlap. It also notes emerging trends—Web3 play‑to‑earn models, esports growth, and super‑app consolidation—that signal continued market maturation. The report concludes that while monetization remains a challenge for non‑RMG segments, strategic acquisition and in‑game advertising innovations can unlock substantial growth across India’s diverse gaming ecosystem.

  • The Indian mobile gaming market generated US$2.2 billion in 2022, with smartphones accounting for 91% of the online gaming audience.
  • Non-real-money gaming (non-RMG) is dominated by Adventure, Battle Royale, Puzzle, Arcade, and Racing genres, while real-money gaming (RMG) centers on card games and sports-fantasy.
  • Demographics skew young, with 55% of Adventure and Battle Royale players falling into the 13–27 age bracket, and 62% of non-RMG gamers being male.
  • Advertiser performance metrics show a 50% install-to-registration rate for casual games compared to 25% for card-based RMG, with casual game retention dropping from 30% on day one to 3% by day thirty.
  • Average revenue per user is projected to reach US$1.5 by 2027, necessitating a focus on vernacular creatives and in-game advertising to overcome current monetization challenges.
+2
EAJan 2022
Page 1
Whitepaper191 pages

Global White Paper on Mobile Advertising & Marketing Game H1 2022

The first half of 2022 saw a contraction across the mobile‑app advertising ecosystem, with the total number of advertisers falling 5.79 % to a historic low of roughly 83 400 and creative volume dropping 27 % to 40 million assets. This downward pressure was most pronounced among mobile‑game advertisers, whose pool shrank to about 83 000 in January, while non‑game categories such as shopping apps retained the largest share of spend (≈12.5 % of advertisers and 17.2 % of creatives). Regional variation was stark: Europe and North America dominated non‑game advertising, whereas the Asia‑Pacific region, excluding China, was the only market with a net increase in advertisers.

Mobile‑game advertising displayed divergent cost dynamics. The United States and Japan posted the highest average CPMs at $27.54 and $25.93 respectively, with iOS campaigns costing roughly 15 % more than Android. Female users and the 55‑64 age cohort commanded a 13 % premium on impressions, while South Korea recorded the peak CPI at $13.90. Playable ads delivered the lowest CPI but suffered the weakest return on ad spend, whereas banner formats generated the strongest ROAS. Strategy titles leaned heavily on video‑only creatives (>90 %) and began integrating casual‑puzzle mechanics to broaden appeal; interest in emerging formats remained modest, with only 16 % of players expressing curiosity about NFTs and 32 % about metaverse features.

Creative strategies are shifting toward motivation‑driven, user‑centric formats such as rewarded video and playable ads to counter post‑IDFA fragmentation. Narrative‑driven ads are proving effective for simulation games targeting female audiences, delivering $12 million in revenue across key Western markets. AR‑enhanced placements on platforms like Snapchat achieve double the attention and 1.7 × the immersion of standard formats, while friend‑based recommendations outperform celebrity influencers by a factor of four. Regional opportunities are emerging in Tier‑2/3 India through vernacular campaigns and OEM inventory, and Turkey’s

  • The mobile advertising ecosystem contracted in H1 2022, with the total number of advertisers falling 5.79% to approximately 83,400 and creative volume dropping 27% to 40 million assets.
  • Mobile-game advertising costs remain high in key markets, with the U.S. and Japan recording average CPMs of $27.54 and $25.93, while iOS campaigns command a 15% price premium over Android.
  • While playable ads offer the lowest cost-per-install (CPI), banner formats currently generate the strongest return on ad spend (ROAS).
  • Audience targeting premiums are significant, with impressions for female users and the 55–64 age demographic costing 13% more than other segments.
  • Consumer interest in emerging tech remains low, with only 16% of players expressing curiosity about NFTs and 32% about metaverse features.
+2
SocialPetaJan 2022
Page 1
Report42 pages

The State of Mobile Game and App Markets: Global Report on App Marketing for H1 2022

Document Title: The State of Mobile Game and App Markets: H1 2022

Executive Overview

Market Contraction, but Not Uniform: Overall mobile‑app and game ecosystem shrank – 6.2 % YoY drop in the number of advertisers and a 27 % decline in total creatives. The contraction was regional: Europe, North America, and Oceania bore the brunt, while Tier‑2/3 markets (especially Hong Kong, Macau, and Taiwan) surged – advertiser counts rose 37 % YoY.

Creative Strategy Shift: Marketers moved away from “quantity‑over‑quality” to higher‑quality, user‑generated‑content (UGC)‑style creatives. This pivot drove a 27.8 % YoY reduction in total mobile‑game creatives (down to 15.8 M), while the advertiser base remained relatively stable (≈ 45.1 K).

Performance‑Driven Campaigns: Adoption of cost‑per‑play (CPP) and in‑app‑purchase‑return‑on‑ad‑spend (IAP‑ROAS) optimization grew sharply. Machine‑learning‑powered tools—predictive analytics, automated bidding, and the new SKAdNetwork 4.0 attribution framework for iOS—helped offset rising cost‑per‑install (CPI) pressures and improve early‑stage ROI measurement.

App‑Store Search Dominance: 64.7 % of all app installs in H1 2022 originated from App Store search. Consequently, publishers and marketers doubled‑down on App Store Optimization (ASO) and Apple Search Ads, treating search visibility as a primary acquisition channel.

Growth Outlook: Future expansion is expected to be driven by emerging markets (Tier‑2/3 regions) and increased reliance on AI/ML‑based campaign automation. Continued investment in high‑impact, UGC‑styled creatives and search‑centric acquisition will be critical to sustain performance as CPI trends upward.

Section‑by‑Section Highlights

| Section | Core Findings | |---------|----------------| | 1 – Market Landscape | • 6.2 % YoY decline in advertisers; 27 % drop in creatives.<br>• Steepest losses in Europe, NA, Oceania.<br>• 37 % YoY advertiser surge in Hong Kong, Macau, Taiwan (Tier‑2/3).<br>• Shift to higher‑quality, UGC‑style creatives and predictive‑analytics‑driven campaigns (incl. SKAdNetwork 4.0). | | 2 – Creative & Optimization Trends | • 27.8 % YoY reduction in total mobile‑game creatives → 15.8 M.<br>• Advertiser count stable at ~45.1 K.<br>• Widespread adoption of CPP and I
  • App Store search accounted for 64.7% of all mobile app installs in H1 2022, cementing search visibility and ASO as the primary acquisition drivers.
  • The mobile ecosystem experienced a contraction in mature regions, evidenced by a 6.2% year-over-year decline in advertisers and a 27% drop in total creatives.
  • Tier-2/3 markets, specifically Hong Kong, Macau, and Taiwan, bucked the global trend with a 37% year-over-year increase in advertiser counts.
  • Marketers pivoted from high-volume creative strategies to high-quality, UGC-style content, resulting in a 27.8% year-over-year reduction in total mobile game creatives to 15.8 million.
  • Publishers increasingly adopted machine-learning-powered tools, including predictive analytics and the SKAdNetwork 4.0 framework, to mitigate rising CPI and improve IAP-ROAS measurement.
+2
AdQuantumJan 2022
Page 1
Report30 pages

Mobile Ad Creative Index: 2022

The 2022 Mobile Ad Creative Index analyzes performance trends and benchmarks across four major mobile app verticals: gaming, e-commerce, entertainment, and finance. The report focuses on the strategic importance of ad creative excellence in a privacy-first landscape following Apple’s IDFA changes. It evaluates five primary ad formats—banners, interstitials, playables, native, and video—across both iOS and Android platforms.

The findings are based on a massive dataset spanning January 1, 2021, to January 1, 2022, encompassing 805 billion impressions, 12.6 billion clicks, and 200 million installs. Data points indicate that while Android remains more cost-effective, with iOS costs often doubling those of Android for the same formats, specific creative types offer distinct advantages. In gaming, playable ads provide the lowest cost-per-install (CPI) at $1.98, though banner ads deliver the highest return on ad spend (ROAS), reaching nearly 22% by day 30. In the e-commerce and finance sectors, banner ads emerge as the most value-driven format, offering the lowest CPIs and high install-to-action rates.

A significant portion of the analysis, supported by GameRefinery and VisualMind technology, examines player motivations. Despite the potential of tailoring creative to specific psychological drivers like "thinking and solving" or "excitement and thrill," the data reveals a massive gap in execution: only 4% of casual game video ads and less than 1% of midcore ads successfully tap into these motivations. The conclusion emphasizes that future performance marketing success depends on "hyper-localization," interactive elements like gamification for non-gaming brands, and iterative creative testing to combat ad fatigue.

  • Playable ads in the gaming sector achieve the lowest cost-per-install (CPI) at $1.98, while banner ads generate the highest 30-day return on ad spend (ROAS) at nearly 22%.
  • iOS advertising costs are frequently double those of Android, making Android the more cost-effective platform for mobile user acquisition.
  • There is a significant disconnect between player psychology and creative execution, with only 4% of casual game video ads and less than 1% of midcore ads successfully targeting specific player motivations.
  • Banner ads are the most value-driven format for the e-commerce and finance sectors, consistently delivering the lowest CPIs and the highest install-to-action rates.
  • The 2022 index is derived from a dataset covering 805 billion impressions, 12.6 billion clicks, and 200 million installs between January 2021 and January 2022.
+2
LiftoffJan 2022
Page 1
Report16 pages

Modern Mobile Consumer 2022: App Discovery Report

The Modern Mobile Consumer 2022: App Discovery Report examines the evolving journey of mobile users from initial app discovery to daily usage and long-term engagement. The primary thesis suggests that the traditional distinction between gamers and non-gamers is increasingly obsolete, as consumer behaviors and attitudes toward advertising are remarkably consistent across different app categories. Findings indicate that mobile gaming has become a universal hobby, with 60% of non-gaming app users playing mobile games daily, tying with social media for the top usage category.

Data highlights the dominance of in-app advertising as a discovery tool, with 70% of gaming audiences and 78% of a control group reporting they have downloaded apps after seeing mobile advertisements. While most users maintain over 20 apps on their devices, the majority only engage with five to ten apps daily. To break into this limited rotation, the research suggests that video ads, app store promotions, and interactive formats are the most effective. Furthermore, rewarded ads—traditionally associated with gaming—show broad appeal, with 33% of non-gaming audiences paying more attention to ads that offer in-app incentives.

The research methodology involved a large-scale survey of 30,457 respondents conducted in April and May 2022. The sample included 18,894 consumers from gaming apps and 11,563 from non-gaming apps within the ironSource network, supplemented by a 500-person third-party control group to eliminate bias. All participants were verified adults aged 18 or older. The geographic scope is global, focusing on the broader mobile app economy. Conclusions emphasize that successful user acquisition strategies must prioritize interest-based relevance, humor, and rewarded engagement to capture the attention of the modern mobile consumer.

  • Mobile gaming has become a universal behavior, with 60% of non-gaming app users playing mobile games daily, matching social media as the top usage category.
  • In-app advertising is a primary driver for app discovery, leading to downloads for 70% of gaming audiences and 78% of non-gaming control group users.
  • While users typically maintain over 20 apps on their devices, the majority limit their daily engagement to only five to ten apps.
  • Rewarded ads have broad appeal beyond gaming, with 33% of non-gaming audiences reporting they pay more attention to advertisements that offer in-app incentives.
  • To successfully acquire users in a crowded market, developers should prioritize interest-based relevance, humor, and interactive ad formats.
+3
ironSourceJan 2022
Page 1
Report26 pages

Gaming Spotlight: 2021 Review

The 2021 Gaming Spotlight provides a comprehensive analysis of the global digital gaming landscape, emphasizing the dominance of mobile gaming and the increasing integration of cross-platform experiences. The primary thesis posits that mobile gaming has become the central driver of industry growth, with its global lead over home consoles projected to reach 3.1x by the end of 2021. This shift is supported by data indicating that mobile game downloads and consumer spending in Q1 2021 increased by 30% and 40%, respectively, compared to pre-pandemic levels in late 2019.

The analysis highlights a significant evolution in player behavior, where social connectivity and cross-play capabilities have become essential for long-term engagement. High-grossing titles such as Roblox and Genshin Impact exemplify this trend, leveraging cross-platform features to scale rapidly across mobile, PC, and console environments. Furthermore, the report notes that console companion apps have become vital tools for managing accounts and maintaining social connections, reflecting a broader trend of merging mobile and console experiences.

Methodologically, the findings rely on market intelligence from App Annie and consumer survey data from IDC, which polled over 3,300 US gamers regarding their attitudes toward in-game advertising. The research reveals that while overall sentiment toward in-game ads improved between 2019 and 2020, player reception is highly dependent on the ad format. Rewarded video and playable ads, which offer a direct value exchange, consistently outperform traditional banner and video ads in user sentiment. The data warns that ad oversaturation, particularly in high-frequency genres like word and trivia games, correlates with more negative player sentiment and potential churn. Ultimately, the industry is trending toward casual, session-based gaming, with hyper-casual and simulation genres seeing the most significant growth in download market share.

  • Mobile gaming is the primary industry growth driver, with its global lead over home consoles projected to reach 3.1x by the end of 2021.
  • Mobile game downloads and consumer spending in Q1 2021 rose by 30% and 40% respectively compared to pre-pandemic levels in late 2019.
  • Cross-platform integration is essential for scale and engagement, as evidenced by the success of titles like Roblox and Genshin Impact across mobile, PC, and console.
  • Hyper-casual and simulation genres are capturing the largest share of download growth, reflecting a broader industry shift toward casual, session-based gaming.
  • Player sentiment toward in-game advertising is highest for rewarded video and playable ads, while traditional banner and video formats perform poorly.
+3
App AnnieJan 2021
Page 1
Report7 pages

Audio Ad Engagement in Mobile Games

This analysis examines the efficacy of in-game audio advertising as a non-intrusive alternative to traditional video and banner formats within the mobile gaming industry. The primary thesis posits that audio ads maintain player engagement and retention by allowing gameplay to continue uninterrupted, thereby fostering a more positive brand association compared to conventional, disruptive advertising models.

Research findings are derived from a combination of market surveys and behavioral testing. A YouGov survey of 2,200 respondents highlights that 86% of UK adults dislike video ads, while 28% identify audio ads as their preferred monetization model. Behavioral testing conducted by Go Live Test confirms that 100% of participants continued playing during audio ad delivery and achieved 100% brand recall when ads were paired with a companion banner. Furthermore, the data indicates a significant engagement advantage, with audio ads achieving a click-through rate (CTR) of approximately one click per 1.4 listens, vastly outperforming the 0.08% average CTR typical of static banners.

The effectiveness of this format is further validated by a Warner Music Group case study targeting 18-to-30-year-olds in the United States. The campaign achieved a 1.78% CTR—representing a 1,000% increase over traditional banner standards—and an ad completion rate exceeding 75%, significantly higher than the 4% to 8% industry standard for skippable video ads. Additionally, the campaign recorded a 1.8% bounce rate on the destination page, suggesting high intent among users who engaged with the audio format.

These findings suggest that audio advertising offers a viable solution for developers and brands seeking to monetize a global audience of 2.8 billion mobile gamers without compromising the user experience. By integrating seamlessly into the background of gameplay, audio ads mitigate the frustration associated with screen-blocking video ads, ultimately driving higher engagement and more favorable brand outcomes.

  • Audio ads achieve a click-through rate (CTR) of approximately one click per 1.4 listens, vastly outperforming the 0.08% average CTR of static banners.
  • A Warner Music Group campaign targeting 18-to-30-year-olds achieved a 1.78% CTR, representing a 1,000% increase over traditional banner standards.
  • Behavioral testing shows 100% of participants continued gameplay during audio ad delivery, with 100% brand recall when ads were paired with a companion banner.
  • The Warner Music Group campaign recorded an ad completion rate exceeding 75%, significantly higher than the 4% to 8% industry standard for skippable video ads.
  • A YouGov survey of 2,200 UK adults found that 86% of respondents dislike video ads, while 28% prefer audio ads as a monetization model.
+4
AudioMobJan 2021
Page 1
Report63 pages

White Paper on Global Mobile Games

The white paper argues that mobile‑game advertising has entered a new phase of intensity and sophistication, driven by rapid creative growth, the dominance of video formats, and evolving privacy regulations. In 2021 ad creatives surged by 200 % YoY while CPMs rose 34 %, with video ads now accounting for over 85 % of spend. The market continues to expand, projecting more than 70 000 advertisers by 2023, yet advertiser growth has slowed post‑pandemic to just 5 % YoY. Android remains the primary platform, hosting roughly two‑thirds of advertisers, and high‑spending Tier 1 markets—particularly the United States, Japan, and Korea—retain their status as key targets for publishers.

Geographically, the United States shows a casual‑game bias among advertisers (26 % of spend) but still supports high‑spending titles such as Free Fire and Subway Surfers. China’s landscape is shifting from RPGs to casual titles, with puzzle games capturing the largest creative share. In the Middle East, strategy and shooter games like Rise of Kingdoms and PUBG Mobile dominate downloads and revenue, whereas the CIS market displays a more diversified mix of strategy, shooter, and casual titles. Across all regions, vertical video ads—especially 30–34 second formats with end‑card elements—outperform horizontal variants for mid‑ and hard‑core titles, achieving conversion rates around 0.15 %. Playable ads also deliver significant lift for mid‑core games.

Privacy changes from Apple and Google have accelerated a shift toward probabilistic attribution models such as SKAN, compelling advertisers to prioritize creative design over granular targeting. Hybrid monetization platforms that blend bidding and non‑bidding networks are gaining traction, while developers increasingly adopt innovative in‑app purchase mechanics (limited‑time offers, battle passes) and social features (chat, PvP, guilds) to enhance engagement and retention. These trends collectively underscore a mobile‑gaming ecosystem that is more video‑centric, privacy‑aware, and focused on long‑cycle strategy titles in high‑engagement markets.

  • Mobile advertising has shifted toward a video-first model, with video ads now accounting for over 85% of total spend and vertical formats outperforming horizontal ones with conversion rates near 0.15%.
  • Privacy regulations have forced a move toward probabilistic attribution models like SKAN, shifting industry focus from granular user targeting to high-quality creative design.
  • Ad creative volume surged 200% year-over-year in 2021, while CPMs increased by 34%, reflecting a period of intense market competition.
  • Android remains the dominant platform for mobile game advertising, hosting approximately two-thirds of all advertisers.
  • While the market is projected to reach over 70,000 advertisers by 2023, growth has decelerated significantly, slowing to just 5% year-over-year in the post-pandemic period.
+2
SocialPeta Data Research InstituteJan 2021
Page 1
Report13 pages

Mobile Game Video Ads Analysis: Optimal Video Lengths and End Cards

This analysis examines the relationship between video ad length, end card formats, and campaign performance across five major mobile gaming genres: Hyper-Casual, RPG, Strategy, Puzzle, and Social Casino. By evaluating 3.7 billion in-app video ad impressions and subsequent installs via the Vungle platform, the study establishes creative benchmarks using a proprietary Power Index to measure efficacy. The findings suggest that as the industry moves toward a post-IDFA environment with limited user-level data, marketers must prioritize creative optimization and mass-appeal strategies to drive engagement.

The data reveals distinct audience preferences for each genre. Social Casino players favor efficiency, responding best to 10-second ads paired with standard static end cards. Puzzle and Strategy games both see peak performance when utilizing app store end cards that provide a direct path to download, though their optimal video lengths differ at 22 seconds and 33 seconds, respectively. Conversely, genres with deeper gameplay loops require more extensive creative storytelling. Hyper-Casual games perform best with 37-second ads and video end cards, while RPGs benefit from the longest engagement times, peaking at 46 seconds with looping video end cards to showcase aesthetic and narrative depth.

The scope of the research covers a global audience of over one billion unique devices, focusing on the structural elements of ad creatives rather than specific visual content. The methodology filters out low-performing impressions to ensure the Power Index accurately reflects the most successful format pairings. Ultimately, the findings conclude that aligning ad duration and post-roll interactive elements with genre-specific player expectations is essential for maximizing return on ad spend in an increasingly competitive mobile marketplace.

  • Optimal video ad length varies significantly by genre, ranging from 10 seconds for Social Casino to 46 seconds for RPGs.
  • Hyper-Casual games achieve peak performance with 37-second ads paired with video end cards.
  • Strategy games perform best with 33-second ads, while Puzzle games reach peak efficacy at 22 seconds; both benefit most from app store end cards.
  • Social Casino players prefer short, efficient 10-second ads combined with standard static end cards.
  • RPGs require the longest engagement times at 46 seconds, utilizing looping video end cards to highlight narrative and aesthetic depth.
+2
LiftoffJan 2021
Page 1
Report47 pages

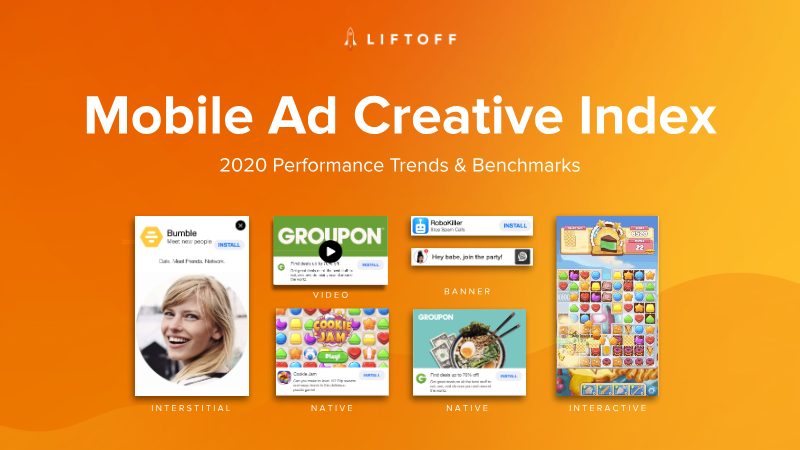
Mobile Ad Creative Index 2020

The 2020 mobile advertising landscape is defined by a stark divergence in performance metrics across creative formats, operating systems, and geographic regions. While banner ads remain the most cost-effective entry point for driving initial installs, native and video formats demonstrate superior efficacy in securing high-value, deep-funnel actions such as in-app purchases. Native ads, in particular, achieve conversion rates as high as 52.8%, signaling their importance for long-term user retention. However, these performance gains come at a premium on iOS, where costs consistently dwarf those on Android. For instance, the cost of securing an in-app purchase through native ads on iOS reaches $218.09, nearly triple the $73.62 required on Android.

Geographically, North America persists as the most expensive market for user acquisition across all formats, while the LATAM and APAC regions offer significantly more accessible pricing for advertisers. Seasonal trends also influence these costs, with install expenses typically peaking during the summer months. To navigate these fluctuations, successful campaigns increasingly rely on iterative A/B testing and dynamic creative strategies. Case studies from major brands like Credit Karma and Groupon illustrate that disciplined testing can yield lifts in click-to-install rates exceeding 120%, underscoring the necessity of a data-driven approach to creative optimization.

The industry is shifting toward a performance-based, cost-per-action model that prioritizes post-install revenue events over simple downloads. By leveraging machine learning and focusing on single-deal creative strategies, advertisers can better align their spending with actual user value. Ultimately, the data suggests that while the cost of acquisition is rising, particularly on premium platforms and in mature markets, the integration of dynamic product ads and rigorous testing frameworks remains the most effective path toward achieving sustainable return on ad spend.

  • Native ads achieve conversion rates as high as 52.8%, making them the most effective format for driving long-term user retention and high-value in-app purchases.
  • Acquiring an in-app purchase via native ads on iOS costs $218.09, which is nearly triple the $73.62 cost required on Android.
  • Disciplined A/B testing and dynamic creative strategies, as utilized by brands like Credit Karma and Groupon, can increase click-to-install rates by more than 120%.
  • The mobile advertising industry is shifting from simple download-based metrics to a performance-based model that prioritizes post-install revenue events.
  • North America remains the most expensive market for user acquisition, while LATAM and APAC provide more cost-accessible alternatives for advertisers.
+1
LiftoffJan 2020

Publishers

Related Topics