30 results · 0.7s
Jan 2025
Interactive Entertainment 2025: Global Market Sizing and Forecast
Aldora
Report15 pages
May 2025
Press Start on Growth: Unlocking the Full Potential of the UK Video Games Industry
Ukie
Report2 pages
Jan 2025
Annual Report of the German Games Industry 2025
game
Report39 pages
Jan 2021
Next-Gen Mobile Games: The Arrival of Cross-Platform and Evolution of High-Fidelity Mobile Games
Newzoo
Report47 pages
Bilan du Marché Français: 2025
SELL – Syndicat des Éditeurs de Logiciels de Loisirs
Report39 pages
Jan 2025
Japan Market Report 2025
Association for UK Interactive Entertainment, Ukie
Report37 pages
Jan 2025
UK Interactive Entertainment Japan Market Report 2025
UK Interactive Entertainment
Report37 pages
Jan 2023
Newzoo’s Global Gamer Study 2023
Newzoo
Report28 pages
Jan 2025
Championing the 25 Retailers and Digital Services Who Connect Music, Video and Games Creators with UK Fans Yearbook
ERA
Report112 pages
Jan 2025
New Zealand Plays
New Zealand Game Developers Association
Report32 pages
Jan 2025
InvestGame Q4'24 Report (Unknown Time)
InvestGame
Report29 pages
Nov 2022
Analyzing the Consumer and Market Impacts of Chinese Games Market Policies
Newzoo
Report29 pages
Jan 2023
Creative Industries in the UK Report
ERA
Report108 pages
Jan 2020
Europe's Video Game Industry: Key Facts 2020
Interactive Software Federation of Europe
Report20 pages
Nov 2009
Estudio aDeSe 2009: Usos y Hábitos de los Videojugadores Españoles
AEVI
Report35 pages
Q4 2022-23 Sales and Annual Sales: FY 2022-23
Nacon
Report2 pages
Sep 2025
Square Enix Special Feature: Erdrick Trilogy Reimagined
Square Enix
Report2 pages
Playing for the Planet: Untangling the Carbon Complexities of the Video Gaming Industry
Playing for the Planet Alliance, Carbon Trust, Unity Charitable Fund, Ukie
Report75 pages
May 2025
The State of Video Gaming in 2026
Epyllion
Report231 pages
Jan 2021
Newzoo’s Global Games Market Report 2021
Newzoo
Report23 pages
Mar 2024
Level Up – Harnessing the Power of Gaming Audiences
Comscore
Report26 pages
Jan 2023
Libro Blanco de Accesibilidad para Desarrolladores
AEVI
Report106 pages
Jan 2024
Games Market Trends 2024
Newzoo
Report27 pages
Jan 2022
Games, Esports, Live Streaming, Cloud and the Metaverse: 2022 Trends to Watch
Newzoo
Report30 pages
Middle East & Africa Gaming Review 2025
Lucidity Insights
Report52 pages
Jan 2021
Global Games Market Report 2021: The VR & Metaverse Edition
Newzoo
Report38 pages
Jan 2023
Gaming Spotlight 2023: The Year in Review
data.ai
Report33 pages
Mar 2025
Newzoo’s Games Market Reports & Forecasts Q1 2025 Update
Newzoo
Report5 pages
Jan 2021
Beyond 2021: Where Does Gaming Go Next?
Newzoo
Report19 pages
Mar 2023
Global Gaming Report Q1 2023
Drake Star Partners
Report19 pages

Interactive Entertainment 2025: Global Market Sizing and Forecast
Jan 202515 pages1k words
Summary
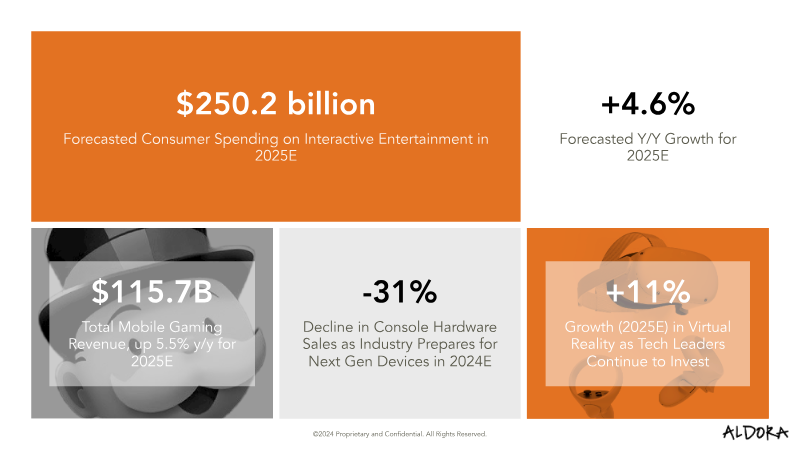
The global interactive entertainment market is projected to reach $250.2 billion in 2025, representing a 4.6% year-over-year growth. This recovery follows a period of stagnation, driven by a strategic transition toward next-generation hardware and a focus on established intellectual property. While the industry faces cyclical declines in specific hardware segments, overall consumer spending remains resilient, supported by growth in software publishing and emerging technology sectors.
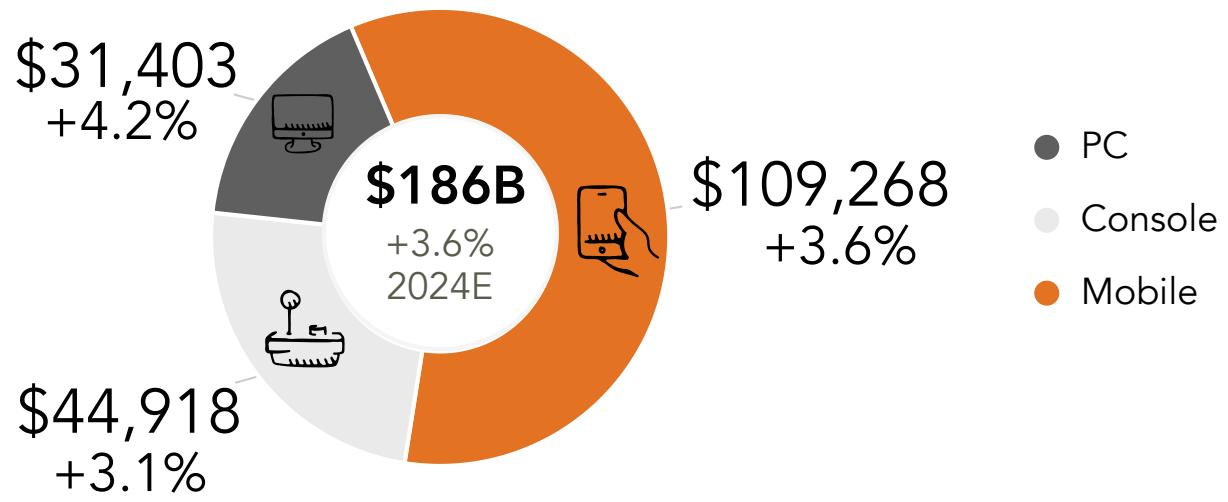
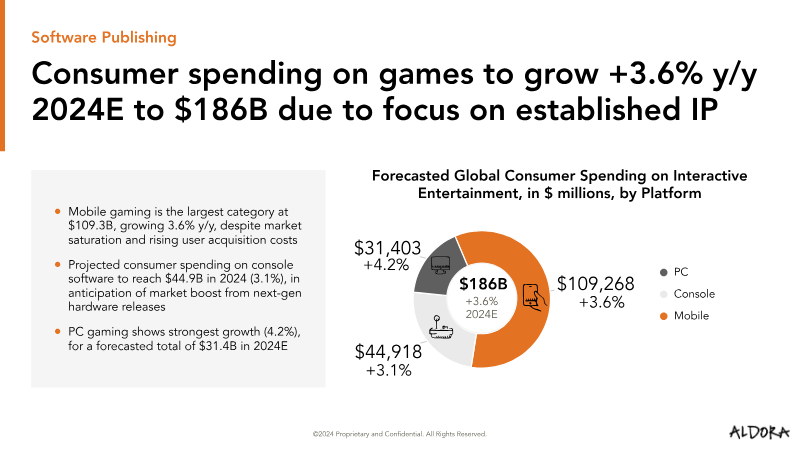
Software publishing remains the primary revenue driver, with mobile gaming leading the category at $115.7 billion in 2025. PC gaming is experiencing the strongest growth at 4.2%, while console software is expected to benefit from upcoming next-gen releases. Conversely, the hardware sector is undergoing a significant contraction, with console hardware revenue projected to decline by 31% in 2024 as the current console cycle concludes. This decline is partially offset by a 5% growth in accessory sales, reflecting sustained consumer interest in peripheral upgrades.
Emerging technologies, including virtual reality and blockchain-based gaming, show latent potential for disruption, with virtual reality expected to grow by 11% in 2025. Meanwhile, the esports and live-streaming segments continue to struggle with profitability and monetization, facing a projected 8.3% decline in esports revenue for 2025. To navigate these challenges, major industry players are pivoting toward transmedia strategies and in-game advertising, leveraging virtual environments to engage audiences.
The analysis, conducted by ALDORA, utilizes company financials and a proprietary data partner network to track consumer spending across global markets. The outlook for 2025 emphasizes operational efficiency and diversification as firms prepare for a new cycle of content-led growth, despite ongoing economic uncertainty and the high costs associated with user acquisition and platform competition.
Pages


Insights
- The global interactive entertainment market is forecast to reach $250.2 billion in 2025, marking a 4.6% year-over-year recovery driven by software publishing and established intellectual property.
- Mobile gaming remains the industry's primary revenue driver, generating $115.7 billion in 2025, while PC gaming leads in growth rate at 4.2%.
- Console hardware revenue is projected to contract by 31% in 2024 as the current hardware cycle concludes, though this is partially mitigated by a 5% increase in accessory sales.
- Esports revenue is facing a downturn with an 8.3% projected decline for 2025, highlighting ongoing struggles with profitability and monetization in the sector.
- Virtual reality is positioned for growth, with an 11% increase expected in 2025 as emerging technologies continue to show potential for market disruption.
1. A bar graph showing the distribution of different types of data. 2. A line chart showing the trend of a specific metric over time. 3. A scatter plot showing the relationship between two variables. 4. A heatmap showing the distribution of data across different regions or categories. 5. A table showing the relationship between two variables, with one variable being a factor that affects the other. 6. A funnel chart showing the flow of data from one stage to another. 7. A box plot showing the distribution of data for a specific variable. 8. A radar chart showing the relationships between different variables. 9. A Sankey diagram showing the flow of data from one stage to another. 10. A heatmap showing the distribution of data across different regions or categories.