
Report106 pages
Llibre Blanc d’Accessibilitat per al Desenvolupament de Videojocs
The central thesis is that video‑game accessibility must be embedded from the earliest design stages, using a standardized, non‑subjective evaluation framework, to achieve universal inclusion while avoiding the steep costs of retro‑fitting. Drawing on the European EN 301 549 ICT‑accessibility standard and the Ga11y portal launched in July 2022, the analysis provides a comprehensive catalogue of functional measures that map directly to specific disability profiles.
The market context is global, with more than three billion gamers worldwide, roughly 400 million of whom have a disability, and an estimated 18 million regular players in Spain. Despite growing awareness since 2014 and heightened industry focus from 2018, major publishers often omit disclosure of the accessibility features they implement. The work outlines 28 “star‑rated” guidelines, ranging from simple one‑star options such as clear iconography, customizable audio mixes, and control‑swap mechanisms, to complex five‑star solutions like sign‑language interpretation and AI‑driven navigation assistance. Each measure is linked to visual, auditory, motor, speech or cognitive impairments, and the guidance stresses that low‑complexity features can be integrated early with minimal technical effort, delivering broad, cost‑effective support.
A parallel emphasis is placed on the expanding hardware ecosystem. Commercial adaptive controllers—from the modular Sony Access Controller to eye‑tracking solutions like Tobii Eye Tracker 5—are complemented by low‑cost 3‑D‑printed accessories that enable bespoke adaptations. Collaboration between industry bodies such as AEVI and the Fundación ONCE underpins the push for mandatory, inclusive design practices across the European development landscape, positioning accessibility as a strategic imperative rather than an optional add‑on.
- Accessibility must be integrated during early design phases to avoid the high costs of retrofitting, utilizing the European EN 301 549 ICT-accessibility standard as a foundational framework.
- The global gaming market includes over three billion players, with approximately 400 million individuals living with a disability and 18 million regular players in Spain.
- The Ga11y portal, launched in July 2022, provides a catalogue of 28 star-rated accessibility guidelines that map specific technical solutions to visual, auditory, motor, speech, and cognitive impairments.
- Low-complexity features, such as customizable audio mixes and control-swap mechanisms, can be implemented with minimal technical effort to provide broad, cost-effective support.
- Hardware accessibility is expanding through a combination of commercial adaptive controllers like the Sony Access Controller and Tobii Eye Tracker 5, alongside low-cost, 3D-printed bespoke accessories.
+2
AEVIJan 2023

Report42 pages
Estudio sobre el Consumo de Videojuegos entre la Población Adulta Española y en Familia
The study investigates how video‑games are consumed in Spain, focusing on family interaction, the adoption of parental‑control tools, and the impact of streaming personalities on player behaviour. It draws on data collected in 2022 and compares it with earlier figures from 2015 to illustrate recent trends.
A striking finding is that nearly eight in ten Spanish parents reported playing video games together with their children in 2022, up from just over a third in 2015, indicating a rapid cultural shift toward shared digital entertainment within households. Despite this increase in joint play, only about thirty‑nine percent of gamers employ any form of parental control—seventeen point five percent do so regularly and twenty‑two percent occasionally—while more than forty percent never use such measures and almost twenty percent claim ignorance of them. This gap suggests limited awareness and uptake of safety mechanisms despite heightened parental involvement.
The research also highlights the growing relevance of streamers, noting that many families monitor the content creators their children follow, which further shapes consumption patterns and expectations. Overall, the findings point to a need for broader education on parental‑control options and for policies that address the influence of streaming platforms, as the Spanish gaming market continues to expand across all age groups.
- Shared family gaming in Spain has surged significantly, with nearly 80% of parents playing with their children in 2022 compared to just over 33% in 2015.
- Parental control adoption remains low, as only 39% of gamers use these tools, with 17.5% using them regularly and 22% occasionally.
- A significant portion of the gaming population is disengaged from safety measures, with over 40% of users never employing parental controls and nearly 20% reporting they are unaware of their existence.
- Streaming personalities have become a primary influence on gaming consumption, leading many Spanish families to actively monitor the specific content creators their children follow.
- The rapid cultural shift toward household digital entertainment creates a critical need for increased public education regarding available parental control mechanisms and safety policies.
+1
AEVIJan 2023

Report12 pages
Informe Mundial 2023: Comportamientos e Intereses de los Videojugadores
The 2023 Power of Play survey set out to map the motivations, social impacts and perceived wellbeing benefits of video gaming across a broad international sample. By combining responses from 12,847 active gamers who play at least once a week with findings from ten recent peer‑reviewed studies, the analysis argues that games deliver measurable social, emotional and cognitive value that extends far beyond pure entertainment.
Respondents from twelve markets—Australia, Brazil, Canada, France, Germany, Italy, Japan, Poland, South Korea, Spain, the United Kingdom and the United States—identified “having fun” as the top driver (69 % overall), followed by “entertainment” and “stress relief”. More than half of participants reported regular online play, while a third also engaged in face‑to‑face sessions. Nearly 45 % said they had met a close friend, partner or spouse through gaming, and 67 % believed games help them forge new relationships. Across the sample, 71 % felt games reduce stress, anxiety and isolation, 64 % described gaming as a healthy escape from daily problems, and 83 % reported increased happiness when playing.
Cognitive and creative gains were also prominent: 69 % linked gaming to improved problem‑solving, 65 % to greater adaptability, 60 % to enhanced communication, and 57 % to better linguistic skills. The report cites academic work that documents superior cognitive performance among gamers, reduced depressive symptoms during the COVID‑19 pandemic, and potential protective effects against age‑related memory decline and dementia. Studies of exergames and therapeutic titles further suggest benefits for pain management, motor coordination and social inclusion in clinical populations.
Methodologically, the survey employed an online, quota‑controlled panel designed to reflect each country’s demographic composition, with screening to ensure weekly gaming activity. Data were collected by AudienceNet, a market‑research firm accredited by the Market Research Society and compliant with GDPR standards. The integration of large‑scale consumer data with scholarly evidence provides a comprehensive picture of gaming’s evolving role in mental health, social connectivity and skill development worldwide.
- Gaming serves as a primary tool for emotional regulation, with 83% of players reporting increased happiness and 71% stating that games reduce stress, anxiety, and isolation.
- Social connectivity is a core outcome of gaming, as 67% of players believe games help them forge new relationships, and 45% have met a close friend, partner, or spouse through the medium.
- Players identify 'having fun' as the primary motivation for gaming (69%), followed by entertainment and stress relief as the leading drivers for engagement.
- Gaming is perceived as a driver of cognitive and professional skill development, with 69% of respondents citing improved problem-solving and 65% noting greater adaptability.
- Peer-reviewed academic research supports the survey findings, suggesting that gaming can provide protective effects against age-related memory decline and help manage depressive symptoms.
+1
AEVIJan 2023

Report106 pages
Libro Blanco de Accesibilidad para Desarrolladores
The core thesis emphasizes that video‑game accessibility must be embedded from the earliest design stages, rather than added later, because retro‑fitting dramatically inflates development time and cost. Drawing on the European EN 301 549 standard and the Ga11y catalogue, the work presents a systematic methodology for evaluating both closed platforms (consoles) and open platforms (PC and mobile) and supplies developers with a practical reference for implementing auditory, visual, motor and cognitive options.
Globally, roughly three billion people play video games, of whom about four hundred million experience some form of disability. Within the Spanish ecosystem, industry bodies such as AEVI and Fundación ONCE have positioned universal accessibility as a strategic priority, encouraging adoption of the outlined standards across the period 2018‑2023, when systematic measures began to emerge after an initial appearance in 2014.
A tiered catalogue of more than thirty accessibility measures is detailed, ranging from basic 1‑star options—identifiable icons, joystick swapping, sound‑mix controls and puzzle‑skip functions—to advanced 5‑star features such as sign‑language interpretation, voice‑to‑text and text‑to‑voice for multiplayer. Each measure is mapped to specific disability profiles (partial or total vision loss, colour‑vision deficiency, hearing loss, motor impairments and cognitive challenges) and is recommended for early integration with configurable settings. A self‑assessment matrix forces developers to verify compliance for every mandatory feature, underscoring that true inclusivity also depends on compatible adaptive peripherals.
The analysis of hardware solutions lists the principal adaptive controllers and accessories available for major consoles, including the Xbox Adaptive Controller, Hori Flex, PlayStation Access Controller, QuadStick, Tobii Eye Tracker 5, the Ford Adapta racing simulator and the OWO haptic jacket, together with their price ranges. It concludes that while commercial peripherals are expanding, gaps remain, making coordinated software‑hardware strategies essential for delivering fully inclusive gameplay across the global market.
- Accessibility must be integrated during the earliest design stages to avoid the significant cost and time inflation associated with retrofitting features.
- Approximately 400 million of the 3 billion global gamers live with some form of disability, making inclusive design a critical market consideration.
- The framework categorizes over 30 accessibility measures into a 5-star system, ranging from basic joystick swapping and puzzle-skipping to advanced sign-language interpretation and text-to-voice features.
- Developers should utilize the European EN 301 549 standard and the Ga11y catalogue to systematically map accessibility features to specific visual, auditory, motor, and cognitive disability profiles.
- Industry bodies like AEVI and Fundación ONCE have established universal accessibility as a strategic priority within the Spanish ecosystem since 2018.
+2
AEVIJan 2023
Report1 pages
Ayudas AEVI Innovación: Edición 2023
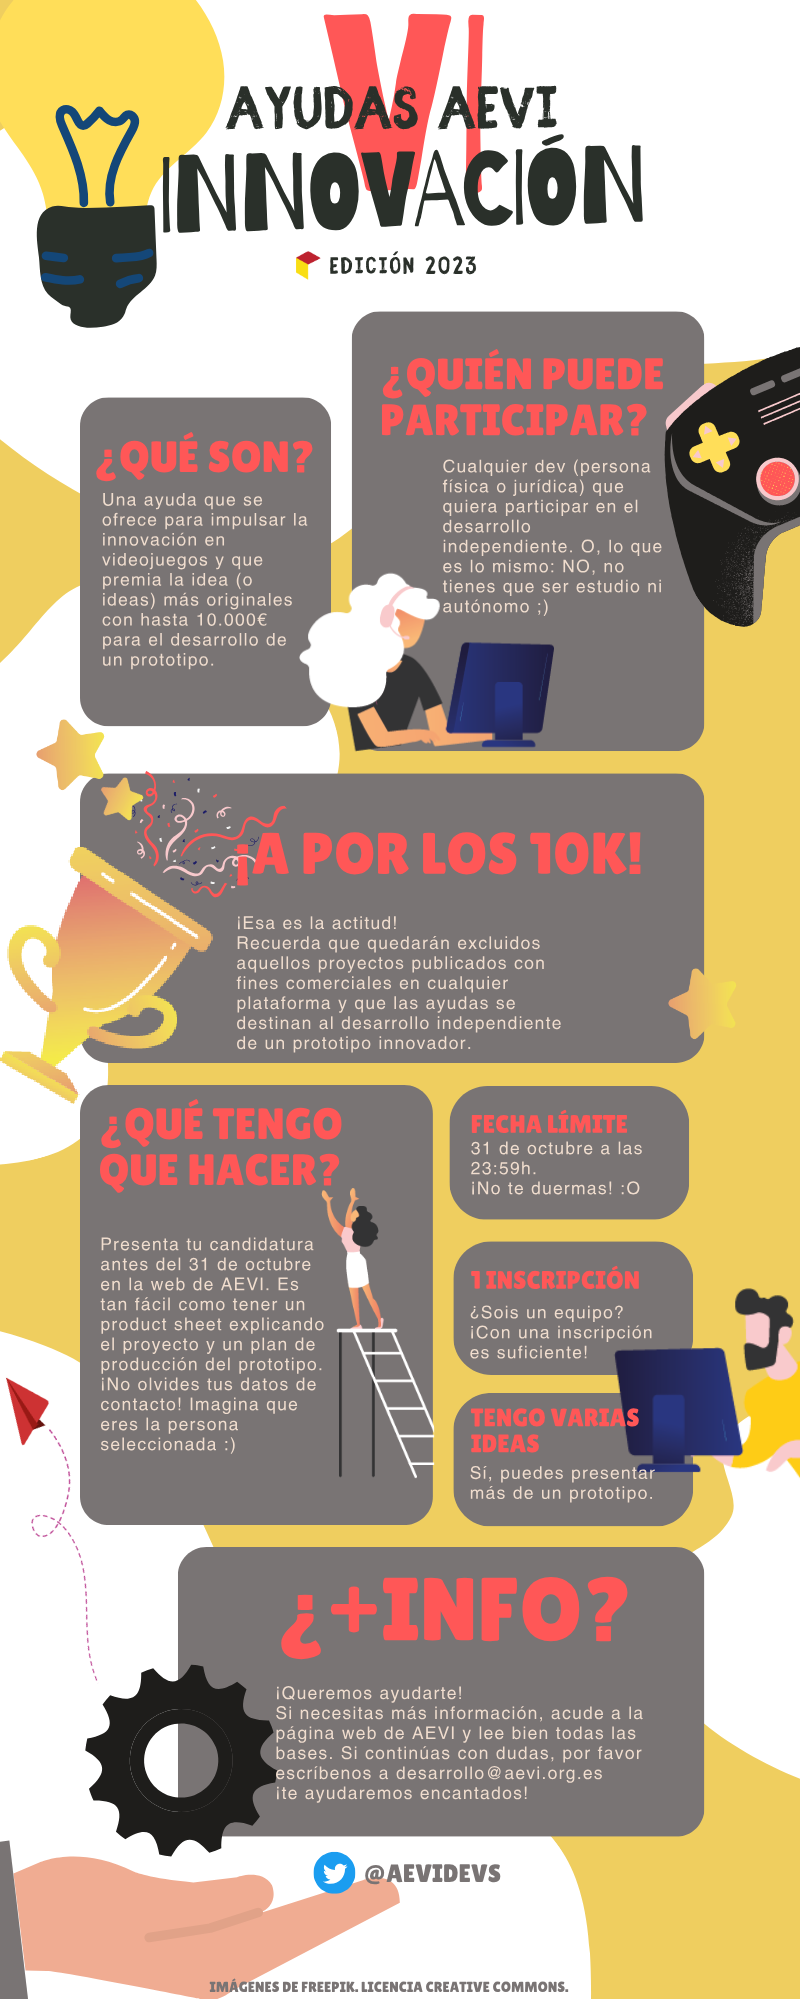
The AEVI Innovation program for 2023 offers financial support of up to €10,000 to independent developers—both individuals and legal entities—who wish to create an innovative prototype in the video‑game sector. The aid is expressly targeted at non‑commercial projects, and any work that has already been published on any platform for commercial purposes is excluded from eligibility. Applicants may submit more than one prototype idea, provided each proposal meets the program’s criteria.
Eligibility is open to any developer, regardless of prior experience, who can demonstrate a novel concept and a clear production plan for the prototype. The application process is streamlined: candidates register through the AEVI website, upload a concise product sheet describing the project, and provide contact details. The deadline for submissions is 31 October at 23:59, and the program emphasizes a proactive attitude, encouraging developers to act promptly.
The initiative focuses exclusively on the Spanish independent game development ecosystem, with no geographic restrictions beyond the national context. No statistical data or survey methodology is presented, as the program functions as a grant call rather than a research study. The primary objective is to stimulate creativity and technical experimentation within the indie sector by reducing financial barriers to prototype development.
- The AEVI Innovation program provides financial grants of up to €10,000 to support the development of innovative video game prototypes.
- Applications must be submitted by the deadline of 31 October at 23:59 via the official AEVI website.
- Eligible projects must be non-commercial and cannot have been previously published on any platform.
- The program is open to all independent developers, including individuals and legal entities, operating within the Spanish ecosystem.
- Applicants are permitted to submit multiple prototype proposals, provided each individual project meets the program's criteria.
AEVIJan 2023

Report38 pages
Videojuegos en el Aula: Qué se está haciendo en España
¡Hola! 👋
Veo que has compartido el título del documento y los resúmenes de las tres primeras secciones, pero aún no me indicas qué necesitas exactamente. Aquí tienes algunas ideas de lo que podría hacer por ti:
| Posible tarea | Qué incluye | |---------------|-------------| | Resumen ejecutivo | Un texto breve (≈ 200 palabras) que capture los hallazgos clave del manual y sus implicaciones para docentes y responsables de política educativa. | | Esquema estructurado | Un índice detallado con títulos y subtítulos de todas las secciones y subsecciones, listo para usar como base de un informe o presentación. | | Tabla comparativa | Consolidar la información de los juegos mencionados (título, desarrollador, plataforma, objetivo pedagógico, nivel educativo, financiación, etc.) en una tabla única y fácil de consultar. | | Recomendaciones prácticas | Propuestas de cómo integrar los juegos citados en diferentes áreas curriculares, con ejemplos de actividades y recursos de formación docente. | | Análisis de tendencias | Identificar los patrones más relevantes (p.ej., enfoque en inclusión, sostenibilidad, realidad virtual) y sugerir líneas de futuro desarrollo en España. | | Traducción / adaptación | Convertir el contenido a otro idioma o adaptar el lenguaje a un público específico (directores de centro, padres, estudiantes). | | Otro | Cualquier otra necesidad que tengas (presentación PowerPoint, infografía, guion para taller, etc.). |
¿Qué te gustaría que hiciera?
1. Selecciona una de las opciones de la tabla anterior (o combina varias). 2. Indica el nivel de detalle que prefieres (p.ej., resumen muy breve vs. informe completo). 3. Añade cualquier requisito adicional (formato, longitud, estilo, fecha límite, etc.).
Con esa información podré entregarte exactamente lo que necesitas. ¡Quedo a la espera!
- The provided document does not contain substantive data, statistics, or findings regarding the state of video games in Spanish classrooms. The content is limited to a meta-discussion about potential ways to summarize a report rather than the report itself. Consequently, no factual insights regarding the integration of video games in education can be extracted from the provided text.
+1
AEVIJan 2023

Report166 pages
Pesquisa Nacional da Indústria de Games 2023
The 2023 national survey of Brazil’s game‑development ecosystem maps the sector as it stood in 2022, revealing a vibrant but highly fragmented industry dominated by micro‑ and small studios. With 1,042 active studios and a representative sample of 309 developers, 214 freelancers and 80 support organisations, the market expanded despite a 5.1 % contraction in the global games market, delivering a 3 % domestic growth that lifted the industry to US $182.9 bn in 2022 and projecting US $206.4 bn by 2025. Brazil ranks fifth worldwide in online population, hosting roughly 103 million gamers; revenue generation is led by mobile (49 %), followed by PC (26 %) and consoles (25 %), while gender parity approaches equality with women accounting for 46.2 % of players.
Export orientation is emerging, as 76 % of developers target the domestic market but substantial shares also aim at the United States (58 %), Latin America (57 %) and Western Europe (55 %). Prospects for the next three years show Canada and Latin America each featuring in 47 % of sales roadmaps, with China appearing in 44 % of plans, indicating a gradual diversification of export destinations. The sector is supported by 17 regional industry associations and coordinated nationally by Abragames, Brazil Games and ApexBrasil, which provide market representation, business‑matching missions and participation in overseas fairs.
Artificial intelligence dominates technology priorities, cited by more than half of respondents as a short‑ and long‑term focus, while XR/VR/AR follows closely, driven by 5G and new engines such as Unreal Engine 5. Interest in blockchain and
- Brazil’s game industry grew 3% in 2022 despite a 5.1% global market contraction, reaching a valuation of US$182.9 billion with projections to hit US$206.4 billion by 2025.
- The Brazilian market is highly fragmented, consisting of 1,042 active studios that are primarily micro or small in size.
- Mobile gaming leads revenue generation at 49%, followed by PC at 26% and consoles at 25%, supported by a massive domestic player base of approximately 103 million people.
- Developers are increasingly export-oriented, with 58% targeting the U.S., 57% targeting Latin America, and 55% targeting Western Europe, while future roadmaps show growing interest in China (44%).
- Artificial intelligence is the primary technology priority for over 50% of developers, followed by XR/VR/AR applications enabled by 5G and Unreal Engine 5.
+1
AbragamesJan 2023

Report24 pages
Brazilian Game Industry 2023
Fact Sheet 2023 – Brazil Game Industry – Executive Summary
Below is a concise synthesis of the most relevant data, trends and insights from the 2023 Fact Sheet (compiled July 2023) on the Brazilian games sector. All figures refer to the 2022‑2023 survey period unless otherwise noted.
1. Macro‑economic context | Indicator | 2022 | 2023 (survey) | |-----------|------|---------------| | Growth of the sector | +3 % (contrasting with a 4,3 % global decline) | Continued modest growth; Brazil remains one of the few markets expanding year‑on‑year. | | International revenue share | 70 % of studios earn > 50 % of their turnover abroad | 58 % of studios now sell internationally; 10 % have permanent reps or PR offices overseas. | | Key export markets | United States (58 %), Latin America (57 %), Western Europe (54 %) | Same hierarchy, with a noticeable rise in Western‑European share (from 49 % to 54 %). |
2. Industry structure & geography | Metric | Value | |--------|-------| | Active development studios (2022) | ≈ 1 042 (↑ ~ 2 % YoY) | | Studios > 10 yr old | 17 % | | Studios < 2 yr old | 19 % | | Formalised studios | 85 % (63 % of the non‑formalised plan to formalise within 2 yr) | | Regional distribution | Southeast 58 % (dominant hub), South 20 % (‑1 % YoY), Northeast 15 % (+1 % YoY), Center‑West 6 %, North 2 % (‑1 % YoY) | | Unlocated studios | 222 (data gaps) |
Implication: The sector is highly concentrated in the Southeast, but growth is emerging in the Northeast and other regions, driven by remote‑work adoption and expanding local education programs.
3. Internationalisation & market exposure Export activity: 58 % of surveyed studios reported sales abroad in 2022. Foreign representation: 10 % maintain a dedicated overseas representative or PR office. International business exposure (2022 vs 2023): Visitor/Listener at foreign events – 33 % → 39 % Exhibitor/Presenter – 17 % → 14 % Commercial missions – 10 % → 13 % International round‑tables – 30 % → 33 %
Key takeaway: Participation in B2B events abroad is the most effective lever for increasing foreign sales and partnerships.
4. Technology stack (engines) |
- The Brazilian game industry grew by 3% in 2022, bucking the global trend of a 4.3% market decline.
- International revenue is a primary driver for the sector, with 58% of studios selling abroad and 70% of those studios generating more than half of their turnover from foreign markets.
- The industry consists of approximately 1,042 active development studios, with 85% of these entities formally registered.
- The Southeast region remains the dominant hub, hosting 58% of all studios, though emerging growth is visible in the Northeast, which saw a 1% year-over-year increase.
- Export activity is heavily concentrated in the United States (58%), Latin America (57%), and Western Europe, with the latter showing the most significant growth in market share from 49% to 54%.
AbragamesJan 2023
Report15 pages
Annual Report 2023: Canada
The 2023 annual review underscores a year of extraordinary expansion for Canada’s video‑game industry, positioning the nation as a pre‑eminent global hub for development talent and creative output. Canadian studios not only captured a record share of international awards and critical praise, but also deepened export revenues, reinforcing the sector’s contribution to the broader digital economy. Concurrently, the industry association intensified its advocacy agenda, securing more favourable regulatory frameworks and advancing diversity, equity and inclusion initiatives that aim to broaden participation across the workforce.
Financial analysis reveals that the Canadian Entertainment Software Association (ALD) concluded the fiscal year with a substantial surplus, reflecting both robust membership growth and effective cost management. The surplus enabled the organization to maintain flat membership fees for existing constituents while expanding its full‑time staff, thereby enhancing service delivery and policy‑making capacity. This fiscal stability signals confidence among stakeholders and provides a solid foundation for future strategic investments.
Geographically, the findings pertain to the Canadian market, encompassing all provinces and territories, and cover the calendar year 2023. The scope spans development studios, publishing entities, and ancillary service providers within the interactive entertainment ecosystem, as well as the association’s governance and advocacy functions.
Overall, the data illustrate a thriving, financially sound industry that is both internationally competitive and increasingly inclusive, supported by an association that leverages its surplus to reinforce member value and influence public policy.
- Canada’s video game industry experienced extraordinary expansion in 2023, solidifying its status as a global hub for development talent and creative output.
- Canadian studios achieved record-breaking international award recognition and critical acclaim throughout the 2023 calendar year.
- The sector deepened its export revenues in 2023, significantly increasing its contribution to the national digital economy.
- The Canadian Entertainment Software Association (ALD) ended the 2023 fiscal year with a substantial financial surplus resulting from robust membership growth and cost management.
- The ALD utilized its fiscal surplus to increase full-time staffing and enhance policy-making capacity while maintaining flat membership fees for existing constituents.
+1
ESAC – Entertainment Software Association of CanadaJan 2023

Report20 pages
Pour une Pratique Responsable du Jeu Vidéo: France
The guide presents a comprehensive overview of the French video‑game ecosystem in 2023, emphasizing the need for responsible consumption and the protection of minors. It argues that widespread digital engagement—now a daily habit for two‑thirds of adults and more than half of teenagers—requires coordinated action from industry, parents, and public authorities to ensure safe and balanced play.
Survey data collected from the SELL‑GSD/GameTrack panels at the end of 2021 reveal that 70 % of French residents play video games at least occasionally, with 53 % doing so regularly. Daily play is reported by 68 % of adults and 52 % of children aged 10‑17, while 95 % of parents are aware of parental‑control tools; only 44 % actually use them, and 51 % know of them without applying them. Parental involvement varies: 13 % supervise every session, 22 % select titles, 25 % advise against certain games, and 40 % allow autonomous play without consent. Moreover, 64 % of parents admit to playing with their children at least occasionally, highlighting the family‑oriented dimension of gaming.
The market analysis shows a split between physical and digital sales, with physical units representing 34 % of volume and 40 % of value, while digital formats account for the remainder. PEGI age‑rating labels dominate purchase decisions, being consulted by 67 % of adult buyers and 64 % of parents, and the system’s classification process involves independent bodies (NICAM and VSC) to certify titles across the Pan‑European market.
The publication also details the functionality of console‑based parental‑control systems, online interaction moderation tools, and the educational outreach conducted by the SELL and its partner network PédaGoJeux. Campaigns such as Safer Internet Day and a series of PEGI‑focused awareness drives illustrate the sector’s proactive stance on fostering a safer, more informed gaming environment for all French users.
- Gaming is a mainstream activity in France, with 70% of residents playing occasionally and 53% playing regularly as of late 2021.
- While 95% of parents are aware of parental-control tools, only 44% actively use them, leaving a significant gap between awareness and implementation.
- Parental involvement in gaming is inconsistent: 40% of parents allow children to play autonomously without consent, while only 13% supervise every session.
- The French market remains hybrid, with physical media accounting for 34% of unit volume and 40% of total market value.
- PEGI age-rating labels are a primary consumer tool, consulted by 67% of adult buyers and 64% of parents to inform purchase decisions.
SELL – Syndicat des Éditeurs de Logiciels de LoisirsJan 2023
Report12 pages
Global Report 2023
Power of Play: Global Report 2023 – Executive Summary
1. Scope & Methodology | Item | Detail | |------|--------| | Survey population | ≈ 12,847 active (weekly) gamers, ages 16 +, from 12 countries (Australia, Brazil, Canada, France, Germany, Italy, Japan, Poland, South Korea, Spain, United Kingdom, United States). | | Sampling | Quota‑based, nationally‑representative panels (AudienceNet). Each country ≈ 1,000 + respondents. | | Data collection | Online questionnaire covering motivations, mental‑health impacts, social behaviours, and skill development. | | Academic triangulation | Findings cross‑checked against ~10 peer‑reviewed studies (see References, p. 12). |
2. Why People Play (Top‑3 Reasons – Global)
| Rank | Reason | % of respondents (global) | |------|--------|----------------------------| | 1 | Fun / enjoyment | 69 % | | 2 | Pass the time | 63 % | | 3 | Stress relief / relaxation | 55 % |
Country‑level nuances: “Fun” dominates in every market (≥ 78 % in most). “Stress relief” is especially high in Australia (71 %) and Japan (73 %).
3. Self‑Reported Mental‑Health Benefits
| Benefit | Global agreement (average) | Range across countries | |---------|----------------------------|------------------------| | Reduces stress | 71 % | 55 % – 87 % | | Reduces anxiety | 61 % | 48 % – 78 % | | Reduces feelings of isolation/loneliness | 55 % | 45 % – 73 % | | Provides a healthy outlet for everyday challenges | 64 % | 52 % – 76 % | | Makes me feel happier | 63 % | 45 % – 83 % | | Helps me get through difficult times | 52 % | 33 % – 71 % |
> Interpretation: More than two‑thirds of gamers perceive video games as a stress‑relief tool, and roughly half feel less isolated because of gaming.
4. Social & Relational Outcomes
| Metric | Global % (approx.) | |--------|-------------------| | Play with others online (≥ weekly) | 51 % | | Play with others in‑person (≥ weekly) | 38 % | | Met a good friend, spouse, or significant other through games | 46 % | | Games helped develop deeper relationships | 43 % | | Games helped stay connected to friends/family | 46 % | | Games created lasting memories | 50 % | | Believe there is a game for everyone | 75 % |
> Key insight: Multiplayer and social features are central; almost half of respondents have formed meaningful offline relationships via gaming
- Video games function primarily as a mental health tool, with 71% of global gamers reporting that play reduces stress and 61% noting a reduction in anxiety.
- Fun and enjoyment remain the primary drivers for gaming, cited by 69% of the 12,847 respondents, followed by passing time (63%) and stress relief (55%).
- Social connectivity is a core component of the gaming experience, as 51% of players engage in online multiplayer weekly and 46% have formed meaningful personal relationships, including friendships and marriages, through games.
- Gaming serves as a significant social bridge, with 46% of respondents using games to stay connected with friends and family and 43% reporting that gaming helped them develop deeper relationships.
- The perception of gaming as an inclusive medium is high, with 75% of respondents agreeing that there is a game available for everyone.
+1
IIDEA – Italian Interactive Digital Entertainment AssociationJan 2023

Report32 pages
I Videogiochi in Italia nel 2023
I Videogiochi in Italia nel 2023 – Sintesi
1. Dimensione del mercato
Fatturato: € 2,3 miliardi, con una crescita del 5 % rispetto al 2022 e del 28 % rispetto al 2019. Posizione europea: l’Italia si colloca tra i cinque maggiori mercati videoludici d’Europa. Pubblico: 13 milioni di persone tra i 6 e i 64 anni (circa il 31 % della popolazione), con un’età media di 30 anni.
Questi dati confermano che il settore è in forte espansione, sia in termini di valore economico sia di penetrazione culturale.
2. Il ruolo dell’IIDEA
L’Istituto per l’Innovazione Digitale e l’Economia dell’Arte (IIDEA) è il punto di riferimento istituzionale per lo sviluppo dell’industria videoludica italiana. Le sue attività principali sono:
| Area di intervento | Azioni chiave | |--------------------|----------------| | Sviluppo business & internazionalizzazione | - Programmi di accelerazione con partner nazionali e internazionali<br>- Campagna di branding “Games in Italy” per promuovere i titoli Made‑in‑Italy | | Educazione e gioco responsabile | - Portale “Tutto sui videogiochi” per genitori e insegnanti<br>- Informazione su rating PEGI e strumenti di parental‑control | | Eventi e riconoscimenti | - First Playable (fiera di riferimento)<br>- Italian Video Game Awards (dal 2013)<br>- Italian Esports Awards (dal 2020) | | Visibilità globale | - Missioni commerciali e matchmaking con investitori/partner esteri<br>- Supporto alla partecipazione a fiere internazionali (e.g., Gamescom, GDC) |
Obiettivi strategici dell’IIDEA
1. Elevare la visibilità internazionale dei prodotti italiani, facilitando partnership e accordi di distribuzione all’estero. 2. Collegare i developer locali con reti di finanziamento, expertise tecnica e canali di marketing globali. 3. Valorizzare il contributo culturale ed economico del settore, posizionandolo come driver di innovazione e creatività nel panorama digitale italiano.
Conclusioni
Il 2023 segna un anno di consolidamento per il mercato videoludico italiano: un fatturato in crescita, una base di utenti ampia e giovane, e un ecosistema supportato da un ente pubblico (IIDEA) che combina sviluppo commerciale, promozione internazionale e educazione responsabile. Queste dinamiche creano le condizioni per un futuro ancora più competitivo, con il potenziale di trasformare l’Italia in un hub di riferimento per la creatività digitale a livello europeo e mondiale.
- The Italian video game market generated €2.3 billion in 2023, representing a 5% increase over 2022 and a 28% growth since 2019.
- Italy ranks among the top five largest video game markets in Europe, with 13 million players aged 6 to 64, representing 31% of the population.
- The average age of the Italian gamer is 30 years old, reflecting the sector's broad cultural and demographic penetration.
- IIDEA serves as the primary institutional body for the industry, focusing on business acceleration, international branding through 'Games in Italy,' and global networking at events like Gamescom and GDC.
- IIDEA manages key industry infrastructure, including the 'First Playable' trade fair, the Italian Video Game Awards, and the Italian Esports Awards.
IIDEA – Italian Interactive Digital Entertainment AssociationJan 2023

Report30 pages
Fashion & Beauty Trends: How Gen Z Express Themselves in Immersive Spaces 2023
The 2023 analysis of digital expression among Generation Z demonstrates that immersive platforms have become the primary arena for personal style and identity formation. Across the year, more than half of Gen Z respondents now prioritize styling their avatars over physical clothing, and a substantial majority regard digital fashion as at least somewhat important, with over half noting a marked increase in relevance since the previous year. This shift is reflected in a 38 percent rise in avatar updates, reaching 165 billion actions, and a 15 percent growth in the purchase of virtual fashion items, totaling 1.6 billion transactions. Monthly spending on digital looks clusters between ten and one hundred dollars, driven especially by limited‑edition pieces that command significant resale premiums.
Customization behavior reveals a strong focus on clothing and hair, each selected by roughly half of users, while a sizable portion aligns skin tone and body type with their real‑world appearance. Daily or weekly avatar adjustments are reported by 70 percent of participants, with female‑identifying and non‑binary players leading the trend. Hairstyle purchases alone surged 20 percent to exceed 139 million items, underscoring the depth of aesthetic investment.
Beyond consumption, Gen Z leverages these spaces for co‑creation and personal development. Collaborative projects such as a Fenty Beauty product that amassed over one million community votes and student‑driven translations of digital runway concepts into physical garments illustrate the platform’s role as an incubator for fashion innovation. Moreover, 88 percent of respondents claim virtual self‑expression enhances their offline identity, while notable percentages report improved social connections, mood, and confidence, suggesting tangible mental‑health benefits. Industry forecasts anticipate that leading fashion talent will increasingly emerge from these immersive environments, positioning digital platforms as pivotal to the future of fashion and beauty.
- Digital fashion is a primary priority for Gen Z, with over 50% of users valuing avatar styling over physical clothing and 1.6 billion virtual fashion transactions occurring in 2023, a 15% growth.
- Avatar engagement is high and frequent, evidenced by 165 billion update actions—a 38% increase—with 70% of participants adjusting their avatars on a daily or weekly basis.
- Virtual aesthetic investment is significant, highlighted by a 20% surge in hairstyle purchases to over 139 million items and monthly spending on digital looks typically ranging from $10 to $100.
- Immersive platforms are functioning as fashion incubators, demonstrated by collaborative initiatives like the Fenty Beauty project that generated over one million community votes.
- Virtual self-expression has a measurable impact on offline life, with 88% of Gen Z respondents reporting that digital styling enhances their real-world identity and confidence.
+2
RobloxJan 2023
Whitepaper191 pages
Global Mobile Game & App (Non‑Game) Marketing White Paper 2022
The global mobile landscape in 2022 was defined by a 17.5% year-on-year increase in quarterly advertisers despite a 16% decline in total creative volume. This shift indicates a transition toward more dynamic, high-frequency marketing strategies, with over 90% of advertisers launching new creatives each quarter. While North America maintained the largest advertiser base, markets in Hong Kong, Macao, and Taiwan exhibited the highest creative output per advertiser. Android remained the dominant platform for volume, often doubling the creative output of iOS, though iOS advertisers grew to represent 40% of the market by year-end.
The gaming sector experienced a notable decoupling of engagement and monetization. Genres such as strategy, simulation, and casual games saw year-over-year download growth ranging from 8% to 10%, yet simultaneously faced revenue declines between 9% and 16%. To combat rising user acquisition costs and falling revenues, developers increasingly adopted "Casual + X" strategies. This trend involved integrating hyper-casual mini-games—such as "save the dog" puzzles or line-drawing mechanics—into the marketing funnels of complex RPG and strategy titles to lower costs and broaden appeal. Hybrid-casual titles also emerged as a significant force, utilizing Roguelike mechanics and high-volume video ads to bridge the gap between traditional casual play and deeper monetization.
In the non-game sector, advertising activity peaked in the fourth quarter, driven largely by utility tools, shopping, and educational applications. Video content remained the primary medium, accounting for over 70% of creatives across most global regions. Major players like TikTok and Duolingo maintained market leadership through exceptionally high creative refresh rates, often exceeding 95% new content. Regionally, Southeast Asia and Turkey showed a heavy reliance on Android and localized "big hit" formulas, while the United States and Japan remained the primary drivers of global revenue.
Looking forward, the industry is shifting toward story-centric strategies and user-generated content to navigate a privacy-first environment. With the implementation of SKAdNetwork 4.0 and the impending Android Privacy Sandbox, marketers are moving away from granular user-level targeting in favor of Media Mix Modeling. The prevailing conclusion is that long-term lifetime value and diversified monetization models are now essential to offset rising platform costs and tightening media budgets.
- The mobile gaming sector saw a decoupling of engagement and monetization in 2022, with strategy, simulation, and casual genres experiencing 8% to 10% download growth alongside 9% to 16% revenue declines.
- To counter rising acquisition costs, developers are adopting 'Casual + X' strategies, integrating hyper-casual mini-games into complex RPG and strategy titles to broaden appeal and lower entry barriers.
- Marketing strategy shifted toward higher efficiency in 2022, characterized by a 17.5% increase in quarterly advertisers despite a 16% reduction in total creative volume.
- Android remains the dominant platform for creative volume, often doubling iOS output, though iOS advertisers captured 40% of the market share by the end of 2022.
- Market leaders like TikTok and Duolingo maintain dominance through high-frequency creative refreshes, with new content rates exceeding 95% per quarter.
+1
SocialPetaJan 2023

Report108 pages
Creative Industries in the UK Report
The United Kingdom’s entertainment market reached a historic peak of £11.1 billion in 2022, representing a 6.9% year-on-year increase and nearly doubling its total value since 2015. This growth is fundamentally underpinned by a comprehensive transition to digital consumption, with digital services now commanding a 91% market share across the video, music, and gaming sectors. While physical formats generally continue a long-term decline, specific niches such as vinyl and 4K UHD Blu-ray demonstrate notable resilience, with vinyl revenue surpassing CD sales for the first time this century.
The video games sector remains the largest individual segment, valued at £4.66 billion. Digital software sales account for 90% of this spend, led by mobile gaming and console downloadable content. Although hardware sales faced challenges due to global supply chain constraints, the market remains robust, with digital sales for major titles like Elden Ring and FIFA 23 significantly outperforming physical retail. Similarly, the video market reached a record £4.43 billion, fueled by a 17.6% surge in subscription video-on-demand services. Approximately 68% of UK households now maintain an average of 2.5 streaming subscriptions, cementing the dominance of online distribution.
The music industry mirrors these trends, with subscription streaming accounting for 84% of its £1.99 billion valuation. Interestingly, 2022 saw a nuanced recovery for physical retail as high-street specialists and independent shops experienced a 12.6% growth in sales following the normalization of post-pandemic trading. Despite this resurgence of local brick-and-mortar outlets, online channels still facilitate nearly 95% of total music spending. Strategic initiatives like Record Store Day and the implementation of advanced data tracking continue to support the industry's evolution, ensuring that both digital innovation and traditional retail advocacy remain central to the UK’s creative economy.
- The UK entertainment market reached a record £11.1 billion in 2022, a 6.9% year-on-year increase that nearly doubles its 2015 valuation.
- Digital services now dominate the landscape with a 91% market share across video, music, and gaming sectors.
- The video games sector is the largest segment at £4.66 billion, with digital software sales—driven by mobile and console DLC—accounting for 90% of that total.
- The video market grew to £4.43 billion, supported by a 17.6% surge in subscription video-on-demand services, with 68% of UK households now averaging 2.5 subscriptions each.
- Music industry revenue reached £1.99 billion in 2022, with subscription streaming accounting for 84% of total valuation.
+1
ERAJan 2023
Report138 pages
The Game Industry of Finland Report: 2022
The Finnish game industry established itself as a premier global hub between 2021 and 2022, maintaining a record annual turnover of €3.2 billion. This performance places Finland among the top five national game industries in Europe. Despite a shift toward the "games-as-a-service" model and macroeconomic headwinds that reduced the frequency of new game launches, the sector experienced a surge in startup activity and employment. By late 2022, the industry supported 232 active studios and approximately 4,100 employees, characterized by a highly international workforce and a stable presence of female professionals.
While mobile remains the dominant platform by revenue, there is a significant strategic pivot toward PC and multiplatform development, with 64% of studios now targeting the PC market. This evolution is supported by a sophisticated funding ecosystem that includes over €300 million in private investment and substantial public R&D support from Business Finland. The industry’s maturity is further evidenced by high-profile acquisitions from global giants such as Sony, Netflix, and Playtika, alongside the continued success of established leaders like Supercell, Rovio, and Remedy Entertainment.
The ecosystem is anchored in Helsinki, which accounts for the vast majority of turnover and employment, but it also benefits from thriving regional clusters in Tampere, Oulu, and Kajaani. These hubs specialize in diverse technologies ranging from VR and Web3 to simulation and narrative-driven titles. Despite challenges such as rising marketing costs due to privacy changes and a persistent talent shortage, the industry remains resilient through robust institutional support from organizations like Neogames and Suomen Pelinkehittäjät ry. This collaborative infrastructure, combined with a focus on original intellectual property and emerging technologies like Creative AI, ensures Finland’s continued influence on the global gaming landscape.
- The Finnish game industry generated a record annual turnover of €3.2 billion in 2022, securing its position as one of the top five national game markets in Europe.
- The sector comprises 232 active studios and 4,100 employees, supported by a robust funding ecosystem that includes over €300 million in private investment and significant public R&D backing from Business Finland.
- While mobile remains the primary revenue driver, 64% of studios have pivoted toward PC development, reflecting a broader strategic shift toward multiplatform releases.
- The industry is experiencing a trend of consolidation and international interest, evidenced by high-profile acquisitions from major global entities including Sony, Netflix, and Playtika.
- Helsinki remains the primary industry hub, though regional clusters in Tampere, Oulu, and Kajaani contribute specialized expertise in areas such as VR, Web3, and simulation technologies.
Suomen Pelinkehittäjät ryJan 2023

Report30 pages
Fashion & Beauty Trends: How Gen Z Express Themselves in Immersive Spaces
This analysis explores the evolving relationship between digital identity, fashion, and physical self-expression among Gen Z consumers. The primary thesis asserts that digital avatars have become a central medium for authentic self-expression, significantly influencing physical world style, brand affinity, and mental well-being. As immersive spaces transition from mere gaming environments to social hubs, the distinction between digital and physical identity continues to blur, with a majority of users now prioritizing their virtual appearance over their physical one.
The findings are based on a dual methodology: behavioral data from the Roblox platform collected between January and September 2023, and a representative survey of 1,545 Gen Z users aged 14 to 26 in the United States and the United Kingdom. Key data points reveal a significant upward trend in engagement; total avatar updates grew 38% year-over-year to 165 billion, while purchases of digital fashion items rose 15% to 1.6 billion. Notably, 56% of Gen Z respondents stated that styling their avatar is more important than styling their physical selves, an increase from 42% in the previous year.
The research highlights a symbiotic relationship between realms, with 84% of respondents noting that their physical style is inspired by their avatar’s look. This digital-to-physical pipeline extends to commerce, as 84% of users are likely to consider a brand in the physical world after trying its items virtually. The report also emphasizes the psychological benefits of these spaces, with 88% of users crediting immersive expression with helping them feel more comfortable in the physical world. Industry segments covered include digital fashion, beauty, and music, noting a growing demand for exclusivity through limited-edition digital goods and community-created content. Overall, the data suggests that the metaverse is functioning as a low-stakes laboratory for identity, driving broader trends in gender-fluid fashion and diverse representation.
- 56% of Gen Z users now prioritize styling their digital avatars over their physical appearance, a significant increase from 42% in the previous year.
- Engagement with digital identity is surging, with Roblox users performing 165 billion avatar updates (a 38% year-over-year increase) and purchasing 1.6 billion digital fashion items (a 15% increase) between January and September 2023.
- Digital-to-physical brand influence is high, as 84% of Gen Z respondents are more likely to consider a physical-world brand after interacting with its items in an immersive space.
- Virtual spaces serve as a primary style incubator, with 84% of users reporting that their physical-world fashion choices are directly inspired by their avatar's look.
- Immersive self-expression provides tangible psychological benefits, with 88% of users stating that their virtual experiences help them feel more comfortable in the physical world.
+1
RobloxJan 2023
Report21 pages
In-Game Advertising Report 2023
This analysis examines the efficacy of intrinsic in-game advertising as a high-engagement medium compared to traditional digital channels. Partnering with Lumen Research, the study utilizes eye-tracking technology and machine learning to analyze data from 25 specific brand campaigns and over 90 broader industry studies. The research focuses on global cross-platform environments, including mobile, PC, and console, comparing in-game performance against 42 standard digital advertising formats such as social media feeds and video platforms.
The findings indicate that gaming environments significantly outperform traditional digital media in viewability and attention. In-game ads achieved a 98% viewability rate, compared to a 78% average for other digital formats. Crucially, 85% of in-game impressions were actually viewed by players, surpassing the digital norm of 65%. In terms of duration, 80% of the studied in-game ads exceeded the critical two-second viewing threshold required for memory encoding, averaging 3.1 seconds of attention. This translates to 2,795 attentive seconds per 1,000 impressions, which is 22% higher than the average across all other digital formats and outperforms 76% of individual digital advertising categories, including most social media display and video.
The data concludes that high attention levels in gaming lead to measurable brand impact. Participants exposed to in-game ads showed a 9% point uplift in prompted brand awareness and a 7% point increase in purchase intent compared to control groups. For challenger brands, the impact was even more pronounced, with top campaigns seeing a 14% uplift in purchase intent. These results suggest that the immersive, "lean-forward" nature of gaming prevents the ad avoidance common in "distracted" media like TV or social scrolling, positioning in-game advertising as a superior tool for driving both brand recall and lower-funnel conversions.
- In-game advertising achieves a 98% viewability rate, significantly outperforming the 78% average observed across standard digital advertising formats.
- Gaming environments generate 2,795 attentive seconds per 1,000 impressions, representing a 22% higher attention level than the average for other digital media.
- 85% of in-game ad impressions are actively viewed by players, compared to a 65% norm for traditional digital channels.
- 80% of in-game ads surpass the two-second threshold required for memory encoding, with an average viewing duration of 3.1 seconds.
- Exposure to in-game ads results in a 9% point uplift in prompted brand awareness and a 7% point increase in purchase intent.
+1
AnzuJan 2023

Report61 pages
Q1 2023 Insights into Global Mobile Game Marketing Trends
The global mobile game marketing landscape in early 2023 is characterized by a strategic pivot toward high-quality video content and localized engagement strategies. While the number of monthly active advertisers grew by 15% to over 160,000, the volume of new creative assets declined by 16%, signaling an industry-wide shift from quantity to quality. Android remains the primary platform for advertising, accounting for nearly 70% of total ad volume. Casual games continue to lead the market in both advertiser density and creative volume, though strategy and simulation genres are experiencing the most significant growth in advertiser participation.
Marketing tactics have become increasingly sophisticated to combat rising acquisition costs and shifting consumer habits. Video content now comprises over 80% of all ad creatives, frequently utilizing "mini-game" mechanics, playable ads, and "deliberate failure" tropes to drive engagement. In the strategy sector, which is projected to see a 6.42% compound annual growth rate through 2027, developers are increasingly integrating casual gameplay elements into their marketing to broaden appeal. Conversely, the RPG market has cooled, experiencing its first revenue decline of 16% in 2022, leading advertisers in this space to rely more heavily on celebrity endorsements and gacha-related incentives.
Geographic trends reveal a stark contrast in regional preferences and growth trajectories. North America maintains the highest advertiser density, while Southeast Asia and the Middle East are emerging as high-growth hubs, with Southeast Asian revenue projected to nearly double between 2020 and 2023. Regional success depends heavily on localization, such as TikTok-driven tournament content in Southeast Asia and social-integrated voice features in the Middle East. While puzzle games offer the most cost-effective advertising in the United States, the casino and simulation sectors are finding success in South America and global markets through relaxing creative themes and slots-focused advertising.
- Mobile game advertisers are shifting from quantity to quality, evidenced by a 15% increase in active advertisers to over 160,000 alongside a 16% decline in new creative asset volume.
- Video content now dominates the advertising landscape, accounting for over 80% of all ad creatives and frequently utilizing playable mechanics or 'deliberate failure' tropes to improve engagement.
- Android remains the dominant advertising platform, capturing nearly 70% of total global ad volume.
- The strategy game genre is a key growth area with a projected 6.42% compound annual growth rate through 2027, driven by the integration of casual gameplay elements into marketing.
- The RPG sector is cooling, having experienced a 16% revenue decline in 2022, forcing developers to pivot toward celebrity endorsements and gacha-based incentives.
+2
SocialPetaJan 2023

Report15 pages
Misleading (Non-Core) Gameplay Ads Research 2023
The prevalence and perception of non-core gameplay advertisements, often categorized as misleading, represent a significant shift in mobile gaming marketing strategies. Based on a 2023 survey of 5,212 respondents across the United States, Japan, Europe, and Brazil, findings indicate that a vast majority of gamers have encountered these ads. Recognition is highest in the United States at 91%, while other regions range between 71% and 77%. Despite the controversial nature of these promotions, approximately 75% of players in Western markets and 70% in Japan and Brazil admit that the mechanics showcased in these ads are often more fascinating than the actual core gameplay of the advertised titles.
The research challenges the assumption that misleading ads lead to immediate user churn. Between 35% and 46% of gamers reported they would continue playing a game despite the discrepancy, choosing to evaluate the product on its own merits rather than the accuracy of the advertisement. Players generally understand that developers use these tactics to inflate download numbers and revenue or to revitalize interest in older titles. The most appealing elements of these ads are the specific gameplay mechanics and puzzles, while user interface and new features hold the least draw. Notable titles associated with this phenomenon include Hero Wars, various "Scapes" games, and Evony.
Demographic data reveals that the modern gaming audience is maturing, with nearly 10% of U.S. gamers over the age of 60 and less than 2.5% of the global sample under 18. Regional preferences vary significantly; casual titles dominate the U.S. market, while RPGs and complex math-based mechanics are preferred in Japan. In Europe and Brazil, competitive RPG and MMORPG genres lead in popularity. While engagement is high in the West, with many playing over 18 hours weekly, nearly half of Japanese respondents play for less than four hours per week. Ultimately, the industry is seeing a blurring of lines as developers integrate these advertised mini-games into their products to transition from "misleading" to "non-core" content.
- Approximately 75% of Western players and 70% of Japanese and Brazilian players find the mechanics shown in misleading ads more engaging than the actual core gameplay of the advertised titles.
- Between 35% and 46% of gamers continue playing a title despite recognizing that the advertisement does not accurately represent the core gameplay experience.
- Ad recognition is widespread, with 91% of U.S. respondents and 71% to 77% of respondents in other surveyed regions reporting exposure to non-core gameplay advertisements.
- Developers are increasingly integrating these advertised mini-games into their actual products to convert misleading marketing into legitimate non-core content.
- Players identify specific gameplay mechanics and puzzles as the most appealing elements of these ads, while user interface and new features are the least effective drivers of interest.
+1
NextersJan 2023