
Report94 pages
PC & Console Gaming Report 2025
Global PC and console revenues are expected to grow modestly through 2027, with consoles driving the majority of expansion at an estimated +13 % CAGR while PC revenue rises only in single digits. 2024 saw a plateau for PCs, dominated by free‑to‑play and in‑game monetisation, whereas console sales are set to rebound from 2025 thanks to strong releases such as GTA VI and the launch of Nintendo Switch 2. Player growth remains incremental, with PC players increasing at +2.3 % annually and console players at +3.5 %, driven largely by established franchises rather than breakthrough innovation.
Playtime data confirm that 2024 experienced a 6 % YoY increase, with Pay‑to‑Play titles (e.g., Call of Duty) and free‑to‑play hits (Fortnite, Roblox) accounting for most of the lift. New releases captured only about 9 % of total playtime, underscoring that long‑running series dominate the market. Console audiences remain heavily slate‑dependent: 67 % of new‑release hours come from annual franchises, while PC players show a higher share of non‑annual titles. In the US and Western Europe, non‑annual franchise games contribute a smaller slice of console revenue (≈8–22 %) compared to annual franchises, which drive the bulk of earnings.
Engagement patterns reveal a sharp decline in title diversity on PC and Xbox, with the average number of titles played per player falling 27 % on Steam in the US and up to 34 % in Russia and Brazil. PlayStation, by contrast, shows modest growth in title engagement. Genre preferences are shifting away from Battle Royale toward Adventure and Role‑Playing, reflecting a broader industry trend toward narrative‑rich, long‑form gameplay. Nostalgia and free‑to‑play models continue to sustain short‑term spikes, but long‑term retention hinges on continuous content updates and robust live‑service strategies. New IPs must prioritize originality, polished gameplay loops, and community‑first discovery to overcome the legacy brand advantage and achieve lasting commercial success.
- Console revenue is projected to grow at a 13% CAGR through 2027, significantly outpacing single-digit growth for PC, with major catalysts including the release of GTA VI and the Nintendo Switch 2.
- Market dominance is heavily concentrated in established franchises, as new releases captured only 9% of total playtime in 2024, with annual franchises accounting for 67% of new-release hours on consoles.
- Title diversity is shrinking, evidenced by a 27% decline in the average number of titles played per user on Steam in the US, with drops as high as 34% in markets like Russia and Brazil.
- Player growth remains incremental, with annual increases of 3.5% for console and 2.3% for PC, driven primarily by legacy brands rather than breakthrough innovation.
- Genre preferences are shifting away from Battle Royale toward Adventure and Role-Playing titles, signaling a market trend toward narrative-rich, long-form gameplay.
+1
NewzooJan 2025

Report67 pages
Global Games Market Report 2025
The Global Games Market Report 2025 projects a steady expansion of the worldwide player base to 3.6 billion, with payers rising to 1.6 billion and total revenue reaching $188.8 billion, a 3.4 % increase year‑over‑year. Mobile dominates growth and revenue, contributing $103 billion (55 % of the market) and expanding 4.5 % YoY, while PC and console follow at 3.1 % and 2.5 %. The report notes that average spend per payer is expected to decline slightly through 2028 as the market matures, underscoring the importance of retention, innovative monetization and post‑launch content to sustain growth in an increasingly saturated ecosystem.
Geographically, the Asia‑Pacific region leads with a 4.2 % YoY increase, and North America remains strong for console sales (5.4 %). Key growth drivers include the launch of Nintendo Switch 2, continued success of live‑service titles on PC, and a shift toward direct‑to‑consumer monetization in mobile. Discoverability challenges and content fragmentation are identified as notable hurdles across all platforms.
Single‑player AAA titles released in the February–May window outperform those launched August–November by an average of 34 %, largely due to crowded holiday windows and cannibalization. Early Access titles that transition to full release within 4–9 months generate the highest new‑player lift, while staggered cross‑platform releases capture only about 13 % of the total player base. Player attrition drops sharply in weeks 2–5 and stabilizes after week 12, indicating that longer main‑story content (20–40 hours) and simulation elements help retain players over the long term.
The commercial life of single‑player titles is increasingly driven by post‑launch content, strategic discounting and community engagement rather than initial premium spend. DLC revenue shares evolve over a game’s lifecycle, with genres aligning to specific monetization models and subscriptions gaining influence on long‑term engagement. Post‑launch content is identified as the key determinant of discoverability, retention and profitability across a game’s back catalogue.
Methodologically, the report employs a top‑down, data‑driven model that blends proprietary engagement metrics (Game Performance Monitor, Steam data), public economic indicators and partner insights to forecast platform‑specific player, payer and revenue figures through 2028. The approach excludes taxes, hardware and gambling from revenue calculations and provides detailed platform‑by‑platform forecasts (PC, console, mobile, cloud, VR) alongside analytical tools for market segmentation, genre trends and post‑launch monetization strategies.
- The global games market is projected to reach $188.8 billion in 2025, a 3.4% year-over-year increase, with mobile platforms accounting for 55% of total revenue at $103 billion.
- Mobile gaming remains the primary growth engine with a 4.5% year-over-year expansion, while PC and console segments grow at 3.1% and 2.5% respectively.
- Single-player AAA titles launched between February and May outperform those released in the August–November holiday window by an average of 34% due to reduced market cannibalization.
- Player retention is optimized by 20–40 hour main-story content and simulation elements, with attrition rates stabilizing significantly after the 12-week mark.
- Early Access titles achieve the highest new-player lift when transitioning to a full release within a 4–9 month window.
NewzooJan 2025

Report39 pages
State of the Game Industry
The survey of more than 3,000 global developers in 2025 reveals a gaming industry grappling with persistent instability while making modest progress on diversity. Layoffs have risen, with one‑tenth of respondents reporting job losses in the past year and 58 % worried about future cuts. Women and non‑binary developers now account for 32 % of the workforce, up from 29 % in 2024, and LGBTQ+ representation reached 24 %, yet white males still dominate at 66 %. Revenue pressures and market shifts continue to drive restructuring, underscoring the sector’s vulnerability.
Generative AI has transitioned from a niche experiment to an integral part of many studios, with 36 % of developers using it personally and 52 % reporting company‑wide adoption. However, enthusiasm has cooled: only nine percent of companies plan to expand AI use, and negative perceptions have climbed to 30 % from 21 %. Ethical concerns, intellectual‑property risks, and fears of job displacement now affect more than half of respondents. Internal AI policies have expanded to 64 % of studios, and optional use has become more common, though a small minority mandate AI tools.
Live‑service development remains polarised. While 42 % of studios already produce live titles, only 13 % intend to launch one next year. AAA developers are more inclined (33 %) due to potential financial upside and sustained player engagement, yet worries about market saturation, creative fatigue, predatory monetization, and burnout persist. Media adaptations interest 36 % of AAA studios, whereas internal pitch activity has fallen. Self‑funding remains the dominant financing method (56 %), though success rates vary across funding models.
Work‑hour patterns signal growing strain: the share of developers working over 50 hours a week has risen from 8 % to 13 %, and half of respondents now view excess hours as problematic. Union support remains robust at 69 %, with 58 % advocating industry unionisation, yet only 22 % have discussed it in the past year. These findings illustrate a sector negotiating between rapid technological change, creative ambition, and labour‑market pressures across diverse geographic regions and studio sizes.
- Job instability is widespread, with 10% of developers experiencing layoffs in the past year and 58% expressing concern over future job security.
- Generative AI adoption is high, with 52% of studios using it company-wide, yet negative sentiment has risen to 30% due to ethical, IP, and displacement concerns.
- Work-life balance is deteriorating, as the proportion of developers working over 50 hours per week increased from 8% to 13%, with half of the workforce viewing these hours as problematic.
- Live-service development is cooling, with only 13% of studios planning to launch a new live title next year despite 42% currently maintaining existing ones.
- Workforce diversity is showing modest gains, with women and non-binary developers rising to 32% of the industry and LGBTQ+ representation reaching 24%.
+1
GDCJan 2025

Report20 pages
Match-3 Genre Snapshot Report: May 2021
The document presents a comprehensive analysis of the mobile match‑3 puzzle segment for Q1 2021, focusing on revenue performance, genre characteristics, and player motivations. It identifies the top five match‑3 titles—Candy Crush Saga, Homescapes, Project Makeover, Gardenscapes, and Toon Blast—detailing their market share changes, revenue per download (Rev/DL), and year‑over‑year growth. Candy Crush Saga leads with a 16.74% share and a Rev/DL of $11.27, while Project Makeover shows the strongest growth at 10.57% share and a Rev/DL of $45.51, reflecting its premium monetization strategy.
The analysis breaks down genre features, noting that Royal Match and Project Makeover exemplify modern match‑3 design: fast‑paced gameplay, quick animations, and a progression system tied to home or makeover themes. Monetization models emphasize consumable boosters, lives, and continue options, with special events such as guilds, recurring tournaments, and exclusive levels driving engagement. The document also highlights unique mechanics—bonus “no‑fail” levels, mystery boxes, and avatar customization—that differentiate titles within the subgenre.
Player motivation data from a US sample classify drivers into escapism, mastery, social interaction, and management. Match‑3 games score high on mastery (completing milestones) and escapism, while social competition scores lower. The report’s methodology relies on GameRefinery’s SaaS dashboard, aggregating download and revenue metrics across the US market for Q1 2021. Overall, the document underscores that successful match‑3 titles combine rapid core loops with layered progression and event systems to sustain high monetization rates.
- Candy Crush Saga remains the market leader with a 16.74% share and a revenue per download (Rev/DL) of $11.27 as of Q1 2021.
- Project Makeover demonstrates the most aggressive growth in the sector, capturing a 10.57% market share with a high-premium monetization strategy yielding a $45.51 Rev/DL.
- Modern match-3 success is driven by fast-paced core loops, quick animations, and progression systems integrated with home or makeover themes, as seen in titles like Royal Match and Project Makeover.
- Monetization in the genre relies heavily on consumable boosters, lives, continue options, and recurring engagement events like guilds and tournaments.
- Player motivation data indicates that match-3 users are primarily driven by mastery of milestones and escapism, while social competition remains a lower priority.
+1
GameRefineryJan 2025

Report46 pages
Japan Game Market Insights 2025
The analysis demonstrates that Japan’s mobile gaming sector has reached a mature equilibrium, with download volumes stabilising after 2020 while in‑app purchase (IAP) revenue continues to grow, largely driven by high‑spending iOS users. Domestic publishers hold a dominant position in downloads—capturing roughly one‑third of the market—and command more than half of total IAP revenue, underscoring Japan’s robust monetisation models and loyal consumer base. Genre preferences have shifted toward strategy titles such as Pokémon TCG Pocket and SD Gundam G Generation ETERNAL, alongside puzzle games that now lead download charts.
Live‑ops and event‑driven monetisation prove highly effective, as illustrated by Last War: Survival’s H1 2025 performance. Aggressive daily offers and themed events produced a 2.7‑fold increase in downloads and significant revenue spikes during campaigns like Double Joy, confirming that adaptive event strategies resonate with Japanese players. Anime‑style IPs maintain a commanding presence, accounting for 42 % of in‑app purchase revenue from January to July 2025. Legacy franchises—Monster Strike, Fate/Grand Order, Umamusume—continue to perform strongly, while new titles such as Shadowverse: Worlds Beyond and Honkai: Star Rail expand the ecosystem, illustrating the enduring commercial relevance of anime IP.
Digital advertising remains tightly coupled with gaming, with mobile action/strategy titles consuming 63 % of ad spend in H1 2025. LINE dominates the channel landscape, delivering approximately 40 billion impressions and over 80 % of mobile ad exposure. Cross‑IP collaborations and event‑driven campaigns sustain long‑term monetisation, reinforcing gaming’s role as a core growth driver for digital advertising in Japan. Overall, Japanese publishers retain global leadership through strong IP‑driven franchises across PC, console, and mobile platforms, with culturally resonant engagement and targeted advertising underpinning sustained revenue growth. Sensor Tower’s comprehensive analytics platform provides the critical insights that enable stakeholders to navigate this mature yet dynamic market.
- Domestic publishers maintain a dominant market position, capturing roughly one-third of total downloads and over 50% of all in-app purchase (IAP) revenue in Japan.
- Anime-style intellectual property remains the primary revenue driver, accounting for 42% of total IAP revenue between January and July 2025.
- Mobile action and strategy titles accounted for 63% of total digital advertising spend during the first half of 2025.
- The LINE platform is the primary advertising channel in Japan, generating approximately 40 billion impressions and accounting for over 80% of mobile ad exposure.
- Live-ops and event-driven strategies are highly effective, evidenced by 'Last War: Survival' achieving a 2.7-fold increase in downloads during H1 2025 through aggressive daily offers and themed campaigns.
+1
Sensor TowerJan 2025
Report37 pages
UK Interactive Entertainment Japan Market Report 2025
The report examines Japan’s interactive entertainment market for 2025, aiming to guide UK game developers and publishers in entering or expanding within a culturally distinct yet lucrative region. Japan accounts for only 2.2 % of the global player base but generates 9.1 % of worldwide game revenue, underscoring high per‑player spend—$223 in Japan versus $145 in the UK. The PC and console segment, excluding mobile and Nintendo platforms, represents a $2.5–3.0 billion opportunity.
Key market dynamics include an older player demographic than the US and Europe, a strong preference for single‑player role‑playing games with deep narratives, and a dominance of domestic publishers—70 % of console hardware sales are controlled by Japanese firms. Nintendo’s presence is particularly pronounced, while sports titles remain marginal. Revenue growth has been robust, with PC revenue rising 16.2 % YoY in 2024 versus a global 4.4 % increase, though the pace is expected to decelerate as the Japanese yen weakens against the dollar.
Methodologically, insights derive from Newzoo’s flagship global gamer study and proprietary market intelligence tools, sampling 73 000 gamers across PC and console platforms. The analysis covers player overlap, retention, and engagement metrics (DAU/MAU), and includes forecasted growth through 2027. The report concludes that strategic localization—emphasizing narrative depth, fantasy and science‑fiction themes, and solo play experiences—will be critical for success in Japan’s competitive landscape.
- Japan generates 9.1% of global game revenue from only 2.2% of the global player base, with an average per-player spend of $223 compared to $145 in the UK.
- The PC and console segment, excluding mobile and Nintendo platforms, represents a $2.5–3.0 billion market opportunity for developers.
- PC gaming revenue in Japan grew 16.2% year-over-year in 2024, significantly outpacing the 4.4% global growth rate, though this momentum faces headwinds from a weakening yen.
- Domestic firms dominate the market, controlling 70% of console hardware sales, with Nintendo maintaining a particularly strong presence.
- Successful market entry requires prioritizing single-player role-playing games featuring deep narratives, fantasy, or science-fiction themes.
+1
UK Interactive EntertainmentJan 2025

Report23 pages
Mobile Gaming Benchmarks 2025
Mobile Gaming Benchmarks 2025 delivers a comprehensive, data‑driven reference for developers seeking to refine acquisition, monetization and content strategies across the global mobile market. The study aggregates 11 600 titles spanning nine regions, two platforms (iOS and Android), and 16 genres, capturing roughly 1.48 billion monthly active users and an average of 4.7 regions per game. By offering global, regional and genre‑specific metrics—retention at D1, D7 and D28; playtime; session length; and session count—the report positions retention as the pivotal driver of long‑term engagement, revenue, and user acquisition return on investment.
Key findings reveal a pronounced shift toward bite‑size play. Average session lengths have fallen, with top‑tier games averaging 8–9 minutes and the median tier around 5–6 minutes. Midcore titles generate the highest daily session counts (six to seven sessions per day), while Android users exhibit higher session frequency than iOS, reflecting the dominance of casual titles on that platform. These trends underscore the necessity for design that supports rapid, repeated engagement loops.
The benchmark framework is underpinned by GameAnalytics’ processing of over 27 billion daily events across 100,000 active games. Percentile data for playtime (98 % quantile), session length (97 % quantile) and new‑user acquisition are segmented by genre, platform, region and spending tier. Real‑time analytics, LiveOps tools and customizable reporting enable studios to scale optimization efforts, tailoring strategies to the nuanced performance profiles identified in the 2025 benchmarks.
- Retention is the primary driver of long-term engagement, revenue, and user acquisition ROI across the 11,600 titles analyzed.
- Average session lengths have decreased, with top-tier games averaging 8–9 minutes and median-tier games averaging 5–6 minutes.
- Midcore titles lead in engagement frequency, generating six to seven sessions per day.
- Android users exhibit higher session frequency than iOS users, a trend attributed to the prevalence of casual titles on the Android platform.
- The 2025 benchmark data is derived from 1.48 billion monthly active users and the processing of 27 billion daily events across 100,000 active games.
+1
GameAnalyticsJan 2025
Report40 pages
The Israeli Mobile Game Market Report (2022)
The Israeli mobile game market reached approximately $9 billion in 2021, driven by more than 200 companies and 14,000 employees. Casual, puzzle, and hyper‑casual titles now represent about one‑third of global mobile game advertising spend, a share amplified by COVID‑19‑induced growth in user acquisition and in‑app purchases. Israel has emerged as a pivotal source of high‑volume advertisers, particularly for action, strategy, and simulation games across iOS and Android platforms. Leading studios—Playtika, Plarium, Moon Active, and Crazy Labs—have scaled to global prominence, with their games ranking among the top 20 Israeli titles by ad spend and contributing substantially to worldwide revenue.
Two flagship games illustrate this trend. RAID: Shadow Legends, launched in 2019, has exceeded 50 million downloads and generated roughly $700 million, with the United States accounting for 70 % of revenue and 40 % of downloads. Its 2022 advertising strategy deployed an average of 1,100 creatives daily, primarily on Google Ads and Facebook, with a heavier focus on Android. Coin Master, released in 2010 and revitalized in 2019, earned about $1.3 billion in 2021—over half from the U.S.—and averaged 2,500 creatives per day in 2022. The campaign concentrated on video formats across Google Ads for both iOS and Android, reflecting the dominance of video in mobile‑game advertising.
Regional analysis shows distinct creative preferences. In the U.S., live‑action, KOL‑driven strategy tips dominate; Japanese campaigns emphasize character art and voice to drive gacha revenue; Korean ads showcase advanced graphics through extended gameplay footage. Across genres, short, engaging videos that spotlight core mechanics or narrative hooks are rising in popularity. Hyper‑casual ads now conclude on success rather than failure, strategy titles incorporate casual puzzles to widen appeal, RPGs employ influencer‑style clips, and simulation games use sympathetic drama with accessible gameplay to attract female players. These findings underscore a highly segmented, video‑centric advertising ecosystem that aligns creative content with regional tastes and genre conventions.
- The Israeli mobile game market reached approximately $9 billion in 2021, supported by over 200 companies and 14,000 employees.
- Flagship titles demonstrate massive scale: Coin Master generated $1.3 billion in 2021 with 2,500 daily creatives, while RAID: Shadow Legends surpassed $700 million in revenue and 50 million downloads.
- Casual, puzzle, and hyper-casual games now account for one-third of global mobile game advertising spend, bolstered by pandemic-era growth in user acquisition.
- Leading Israeli studios including Playtika, Plarium, Moon Active, and Crazy Labs have established themselves as global leaders in high-volume advertising across action, strategy, and simulation genres.
- Mobile advertising is heavily video-centric, with top-performing campaigns utilizing thousands of daily creatives across platforms like Google Ads and Facebook.
+1
SocialPetaJan 2025

Report10 pages
Hyper-Casual Games – Industry Snapshot 2020
The snapshot presents a quantitative overview of the hyper‑casual mobile game sector for 2020, drawing on data from over 140 000 titles and more than 2 billion monthly sessions. The analysis disaggregates key performance indicators—day‑one and day‑seven retention, average playtime, ARPPU, ARPDAU, and conversion rates—across four dominant sub‑genres: timing, traversal, physics, and shooting. Timing games achieve the highest day‑one retention (≈44 %) but lower playtime, while traversal titles show slightly higher day‑seven retention (≈41 %). Average revenue per paying user ranges from $18 for physics games to $42 for timing titles, with conversion rates consistently below 1 % across all sub‑genres.
Geographically, France and Germany dominate early retention metrics (≈49 % day‑one), whereas Japan leads in average daily playtime (63 minutes). The United States, China, and South Korea exhibit moderate retention but lower playtime. In 2020, the most successful titles—such as “High Heels!” (traversal) and “Slap Kings” (timing)—combined high download volumes with strong engagement scores, reflecting the importance of low production effort and rapid iteration.
Methodologically, the report aggregates network data from GameIntel’s Explorer platform, employing a cross‑title average approach to benchmark performance. The findings underscore that hyper‑casual games thrive on brevity, simplicity, and forgiving mechanics; developers are advised to monitor day‑one retention thresholds (≈40 %) early in development and prioritize high‑impact, low‑effort optimizations to maximize user acquisition and monetization.
- Hyper-casual developers should target a day-one retention threshold of approximately 40% early in the development cycle to ensure viability.
- Timing games lead the sector in day-one retention at roughly 44%, while traversal titles demonstrate superior long-term engagement with day-seven retention near 41%.
- Monetization performance varies significantly by sub-genre, with ARPPU ranging from $18 for physics-based games to $42 for timing titles, despite conversion rates remaining consistently below 1%.
- Geographic performance metrics show France and Germany leading in day-one retention at 49%, while Japan records the highest average daily playtime at 63 minutes.
- Successful 2020 titles like 'High Heels!' and 'Slap Kings' validate a development strategy centered on low production effort, rapid iteration, and simple, forgiving mechanics.
+2
GameIntelJan 2025
Report41 pages
Mobile Growth and Monetization Report 2023
The report establishes that mobile game monetization is most effective when focused on early‑stage conversion and strategic ad placement. Analysis of 31 billion in‑app purchase events shows that 77 % of players who convert do so within the first two weeks, with currencies and limited‑time sales accounting for 22–23 % and 15–20 % of revenue respectively. Pricing the first purchase between $1 and $5 maximizes conversion efficiency, while targeting tier‑2 markets and deploying offerwalls can further enhance retention.
Rewarded‑ad data, derived from 31 billion monthly impressions and 158 million installs, identifies high‑engagement placements between levels, in the IAP store, and lobby screens. Extra‑reward, currency, and gacha offers drive the greatest engagement. Offerwalls contribute roughly 33 % of total ad revenue, delivering about $4.68 per converted user; multi‑reward offers generate 60–82 % of conversions and can yield up to $68 per completion. These insights suggest that placing high‑visibility rewarded ads and integrating offerwalls can simultaneously boost retention and monetization.
Complementary tactics such as custom store pages further improve player engagement. Offerwall conversions can increase day‑7 to day‑120 retention by up to fivefold, especially for high‑engagement segments. Custom store pages allow developers to align in‑game messaging with ad creatives, reducing resource costs and enhancing conversion rates. Targeting genre‑specific markets—sports in Japan or trivia in South Korea—can lift click‑through rates above tier‑2 averages, underscoring the importance of data‑driven audience and creative optimization.
Overall, the findings emphasize a focused strategy: early conversion pricing, strategic rewarded‑ad placement, offerwall integration, and tailored store experiences. These combined tactics deliver measurable gains in retention, revenue, and campaign efficiency across iOS and Google Play platforms worldwide.
- 77% of players who make in-app purchases convert within the first two weeks, with the highest conversion efficiency achieved by pricing initial offers between $1 and $5.
- Offerwalls contribute approximately 33% of total ad revenue and can increase day-7 to day-120 player retention by up to fivefold.
- Multi-reward offerwall campaigns generate 60–82% of conversions and can yield up to $68 per completion, while delivering an average of $4.68 per converted user.
- In-app currencies account for 22–23% of revenue, while limited-time sales contribute 15–20%.
- High-engagement rewarded ad placements are most effective when positioned between game levels, within the IAP store, or on lobby screens.
+2
UnityJan 2025

Report40 pages
The Gaming App Insights Report: 2025 Edition
The 2025 Gaming App Insights Report presents a resilient mobile gaming market that rebounded strongly in 2024, projecting global revenue of $126.1 billion for 2025 and a 49% share of total gaming revenue, eclipsing console (28%) and PC (23%). AI‑driven personalization, dynamic monetization models, and cross‑platform play emerge as key drivers of higher retention, session length, and in‑app spending, particularly within battle royale and strategy genres. New acquisition channels—TikTok, connected TV, and influencer marketing—are reshaping player discovery, while studios that invest in AI for predictive churn mitigation and long‑term relationship building are positioned to capture the largest growth opportunities, especially as mobile gaming expands into LATAM and MENA regions.
Privacy compliance shows modest improvement, with global ATT opt‑in rates rising to 37.9 % in Q1 2025; arcade titles lead the surge (42.4 → 59.3 %). Regional gains are strongest in Indonesia (58.6 %) and Malaysia (51.9 %), whereas markets such as the UAE, Japan, Saudi Arabia, and the Philippines experienced slight declines. Despite these gains, compliance remains uneven across genres and geographies.
Advertising performance improved in 2024: installs per mille increased from 8.1 to 8.86, click‑through rates rose from 7 % to 9 %, and median cost per install fell slightly (0.38 → 0.36 USD). Median cost per mille dropped to $3.41, indicating more efficient ad spend. However, revenue‑per‑user metrics declined overall—ARPM fell across most categories and ARPMAU dropped from $0.31 to $0.28—though casino and strategy games bucked the trend with higher monetization.
The report concludes that mobile gaming’s next growth wave will hinge on AI‑driven, culturally tailored experimentation and hyper‑personalized user journeys. Precise targeting—through dynamic difficulty, hybrid monetization, and live events—combined with community‑building tactics drives higher lifetime value. Teams that leverage cross‑platform measurement and analytics to iterate on data‑driven decisions will be best positioned to scale and shape the future of mobile gaming.
- Mobile gaming is projected to generate $126.1 billion in 2025, capturing 49% of total global gaming revenue compared to console (28%) and PC (23%).
- Global ATT opt-in rates reached 37.9% in Q1 2025, with arcade titles showing significant growth from 42.4% to 59.3%.
- Advertising efficiency improved in 2024 as median cost per install fell from $0.38 to $0.36, while click-through rates increased from 7% to 9%.
- Despite improved ad performance, monetization metrics declined, with average revenue per monthly active user (ARPMAU) falling from $0.31 to $0.28.
- Growth in mobile gaming is shifting toward LATAM and MENA regions, with Indonesia (58.6%) and Malaysia (51.9%) leading in privacy compliance opt-in rates.
+2
AdjustJan 2025
Report19 pages
Hyper-Casual 9 Games Benchmark Report: Q3 2022
The report presents a quantitative assessment of hyper‑casual mobile games for the third quarter of 2022, focusing on acquisition costs, retention performance, and geographic distribution. It identifies a narrowing cost‑per‑install (CPI) gap between Android and iOS, now at 10 cents compared with an average of 15 cents over the previous four years, suggesting intensified competition on Android. Retention benchmarks reveal a consistent advantage for iOS across all performance tiers: top‑tier games achieve 51 % day‑1 and 22 % day‑7 retention versus 42 % and 16 % on Android; top‑25 games show 33 %/9 % versus 26 %/5 %; median titles record 25 %/6 % against 19 %/3 %. These figures illustrate a pronounced disparity between platforms, with iOS retaining users more effectively at every level.
Geographically, the analysis lists leading markets by player volume and revenue potential. The United States, Japan, South Korea, Brazil, the United Kingdom, Canada, Germany, India, France, and Indonesia appear repeatedly as key regions, with Japan and South Korea consistently ranking among the top three. The data imply that hyper‑casual titles should prioritize these territories for user acquisition and monetization strategies.
Methodologically, the study aggregates data from over 100 k games tracked by GameAnalytics, a leading analytics provider that serves one‑third of global mobile players. The benchmark draws on CPI figures, retention rates, and regional player counts to deliver actionable insights for developers and publishers seeking to optimize performance in the hyper‑casual segment during Q3 2022.
- iOS maintains a significant retention advantage over Android across all performance tiers, with top-tier iOS games achieving 51% day-1 and 22% day-7 retention compared to 42% and 16% on Android.
- The cost-per-install (CPI) gap between Android and iOS has narrowed to 10 cents, down from a four-year average of 15 cents, indicating intensified competition on the Android platform.
- Median hyper-casual titles show a clear performance disparity between platforms, with iOS recording 25% day-1 and 6% day-7 retention versus 19% and 3% on Android.
- Japan and South Korea consistently rank among the top three global markets for both player volume and revenue potential in the hyper-casual segment.
- Key regions for user acquisition and monetization strategies include the United States, Japan, South Korea, Brazil, the United Kingdom, Canada, Germany, India, France, and Indonesia.
TenjinJan 2025
Report66 pages
How UGC, AI, & Cloud Are Transforming Gaming Report
The report argues that user‑generated content (UGC), artificial intelligence (AI) and cloud gaming are reshaping the industry by lowering entry barriers, democratizing creation and expanding cross‑platform reach. Data show that Gen Alpha and Gen Z spend a majority of their daily gaming time, with UGC platforms such as Roblox attracting 85 million active users and cloud‑gaming subscribers rising from 62.5 million to nearly 396 million in four years. AI‑driven tools are projected to generate $4.2 B by 2029, while cloud‑gaming revenue grew from $1.1 B in 2020 to $6.9 B in 2024 and is expected to reach $18.7 B by 2027.
Indie developers benefit from cloud infrastructure that allows anyone to play AAA titles and AI engines such as Unity Muse or Unreal Engine that reduce development costs. Indie releases on Steam generated $4 B in 2024, matching AAA revenue streams, and UGC has extended the life of titles like Fortnite and Roblox, boosting retention by up to 10 % in some cases. However, quality control, cross‑platform compatibility and monetization remain challenges; dedicated mod QA teams, “mod hub” interfaces and transparent pricing are recommended to sustain high‑quality ecosystems.
Player surveys reveal mixed feelings about AI, with 54 % seeing more benefits than drawbacks but 52 % feeling nervous. Creators view AI as a productivity aid, with 83 % adopting it and reporting improved content quality (66 %) and asset variation speed (70 %). Cloud gaming is praised for cost savings (47 %) and accessibility (44 %), yet latency (76 %) and bandwidth (68 %) issues persist, underscoring the need for edge computing, AI‑based compression and better economic models.
The analysis projects cloud gaming as the dominant play model within a decade, initially targeting B2B use cases before expanding to consumers. Advances in 5G and internet infrastructure are expected to unlock low‑latency streaming, enabling cross‑platform play and the convergence of AI, UGC and live‑service models into socially connected gaming ecosystems. The report concludes that while continuous evolution and community engagement will drive growth, depth in specific genres may ultimately define the next wave of innovation.
- Cloud gaming revenue grew from $1.1 billion in 2020 to $6.9 billion in 2024, with projections reaching $18.7 billion by 2027 and a trajectory to become the dominant play model within a decade.
- Cloud gaming subscribers have surged from 62.5 million to nearly 396 million over the last four years, while AI-driven development tools are projected to generate $4.2 billion by 2029.
- Indie developers are increasingly competitive, with indie releases on Steam generating $4 billion in 2024, a figure that now matches AAA revenue streams.
- UGC platforms like Roblox have reached 85 million active users, with UGC integration in titles like Fortnite and Roblox boosting player retention by up to 10%.
- While 83% of creators have adopted AI to improve asset variation speed (70%) and content quality (66%), player sentiment remains divided, with 52% expressing nervousness regarding the technology.
+1
Room 8 GroupJan 2025

Report88 pages
Genre and Great Games: Understanding Audiences and Designing Better Mobile Games
The study demonstrates that genre is the primary factor influencing mobile game adoption, with puzzle and matching titles dominating in North America and East Asia, while card‑casino games lead elsewhere. Within these markets, strategy players—comprising 12–26 % of the player base—exhibit high retention when titles incorporate live events, achievements, and daily rewards. Their spending patterns favor direct purchases over random loot boxes, especially in Japan, and they tolerate rewarded ads only when infrequent and longer. Strategy games also deliver the highest lifetime value, largely through aggressive use of battle passes (present in 92 % of top titles) and character or gear upgrades.
Role‑playing games attract players motivated by accomplishment, collection, and social interaction; churn is driven by repetitive gameplay and aggressive monetization. Successful RPGs mitigate this through frequent live events, multiple leveling paths, robust guild systems, and a balanced mix of loot boxes and bulk‑discount options. Monetization sensitivity varies regionally: U.S. players accept rewarded videos when they provide tangible benefits, whereas Korean and Japanese audiences are more tolerant of longer, character‑centric ads.
Puzzle players skew female (≈70 %) and older (≈60 % aged 35+), favoring short solo sessions for stress relief. Retention gaps stem from boredom and slow progress; top performers address this with live events, diverse level goals, and event currencies. While community engagement is low overall, a majority welcome developer communication and leaderboard features. Hyper‑casual audiences similarly value frequent updates, social cues, and ad‑friendly monetization that avoids pay‑to‑win perceptions.
Across all genres, the analysis identifies key mechanics—battle passes, VIP tiers, guilds, live‑event currencies, and ladder systems—that create recurring revenue streams and community retention. Combining season‑based progression with social collaboration and limited‑time rewards maximizes player lifetime value and monetization potential.
- Strategy games deliver the highest lifetime value in mobile gaming, driven by battle passes—which are present in 92% of top-performing titles—and character or gear upgrades.
- Strategy players, who make up 12–26% of the mobile base, prefer direct purchases over loot boxes and exhibit high retention when games feature live events, achievements, and daily rewards.
- Puzzle games, which dominate North American and East Asian markets, attract a demographic that is approximately 70% female and 60% aged 35 or older, favoring short sessions for stress relief.
- RPG player churn is primarily driven by repetitive gameplay and aggressive monetization, which successful titles mitigate through multiple leveling paths, guild systems, and a mix of loot boxes and bulk-discount options.
- Monetization sensitivity varies by region: U.S. players prefer rewarded videos with tangible benefits, while Japanese and Korean audiences show higher tolerance for longer, character-centric advertisements.
+1
Facebook GamingJan 2025
Report49 pages
Target. Connect. Engage: Driving Profitable App Growth with Revenue-Boosting Strategies
The primary purpose of the analysis is to demonstrate how a strategic partnership between a mobile measurement partner (MMP) and TikTok’s advertising ecosystem can unlock profitable growth for app marketers. By integrating real‑time attribution, privacy‑preserving measurement, and value‑based optimization, brands can accurately credit campaigns, reduce fraud, and maximize return on ad spend (ROAS) across the entire customer journey.
Key findings show that cross‑platform visibility is essential for identifying high‑value users and optimizing acquisition budgets, especially amid tightening privacy regulations on iOS and Android. AppsFlyer’s comprehensive measurement suite, combined with TikTok’s SKAdNetwork tools and self‑reporting network, delivers precise audience targeting and cost‑effective user acquisition. Case studies from Burger King, Casas Bahia, and Carrefour illustrate tangible results: a 7× ROI for coupon activations, a 44 % lift in conversion rates with a 55 % ROI gain, and a 29 % increase in in‑app revenue with triple the return compared to other channels.
The document outlines best practices for app install and retargeting campaigns, recommending the use of App Event Optimization (AEO) and Value‑Based Optimization (VBO) to focus spend on high‑value actions. Automated Smart Performance Campaigns and real‑time ROAS measurement via AppsFlyer integrations further enhance efficiency and lifetime value.
Geographically, the insights apply globally across major mobile markets, with a focus on the U.S., Europe, and emerging regions where TikTok’s user base is rapidly expanding. The time frame covers current privacy‑driven advertising environments and anticipates ongoing downturns, positioning the partnership as a resilient growth strategy for 2024‑2026.
- Integrating AppsFlyer’s measurement suite with TikTok’s advertising ecosystem enables brands to maximize ROAS through real-time attribution and privacy-compliant user acquisition.
- Case studies demonstrate significant performance gains, including a 7x ROI for Burger King, a 44% conversion lift for Casas Bahia, and a 29% increase in in-app revenue for Carrefour.
- App marketers should prioritize App Event Optimization (AEO) and Value-Based Optimization (VBO) to focus advertising spend on high-value user actions.
- Automated Smart Performance Campaigns and real-time ROAS measurement are recommended strategies to maintain growth and efficiency through 2026 despite tightening privacy regulations.
- Cross-platform visibility is essential for identifying high-value users and optimizing acquisition budgets across both iOS and Android environments.
+2
AppsFlyerJan 2025
Report19 pages
Mobile Gamer 2021: Gen Z Edition
The report examines Generation Z (born 1997 and later) as the newest cohort of mobile gamers, highlighting their purchasing power, digital habits, and advertising preferences. Surveying 7,103 U.S. respondents aged 18‑24 on the Tapjoy network in February 2021, it finds that 86 % of Gen Z use mobile devices for gaming, far exceeding console (42 %) and PC (38 %) usage. Nearly one‑quarter first owned a smartphone before age 10, and 49 % replace devices every two to three years. Mobile shopping dominates their retail behavior: 68 % shop on phones one to four times per week, with 60 % ordering food delivery and 57 % making retail purchases. Preferred purchase channels include branded apps, e‑commerce storefronts, rewarded offers in games, and Instagram ads.
Advertising engagement shows a strong preference for rewarded mobile game ads (61 % enjoy offerwalls) and short, creative content such as memes (50.4 %) and humor‑driven brand posts (57 % value humor). Traditional formats—banner ads, non‑skippable videos, and celebrity endorsements—are largely ineffective. Gen Z follows brands that align with their values; 52 % discover new products via social media, and 67 % follow brands for product interest. The methodology involved opt‑in participation with age verification, automatic reward distribution, and a geographically targeted U.S. sample.
Overall, the findings portray Gen Z as highly engaged mobile gamers with significant discretionary spending, a preference for value‑based advertising, and a strong inclination toward brands that reflect their social and environmental values.
- Mobile is the dominant gaming platform for Gen Z, with 86% of 18-24-year-olds playing on mobile devices compared to only 42% on consoles and 38% on PCs.
- Gen Z shows a strong preference for rewarded advertising, with 61% of respondents reporting that they enjoy offerwalls within mobile games.
- Traditional advertising formats like banner ads, non-skippable videos, and celebrity endorsements are largely ineffective with this demographic.
- Gen Z prioritizes humor and creativity in advertising, with 57% valuing humor-driven brand posts and 50.4% favoring meme-based content.
- Mobile shopping is a primary behavior for this cohort, as 68% shop on their phones one to four times per week, with 60% ordering food delivery and 57% making retail purchases.
TapjoyJan 2025
Report24 pages
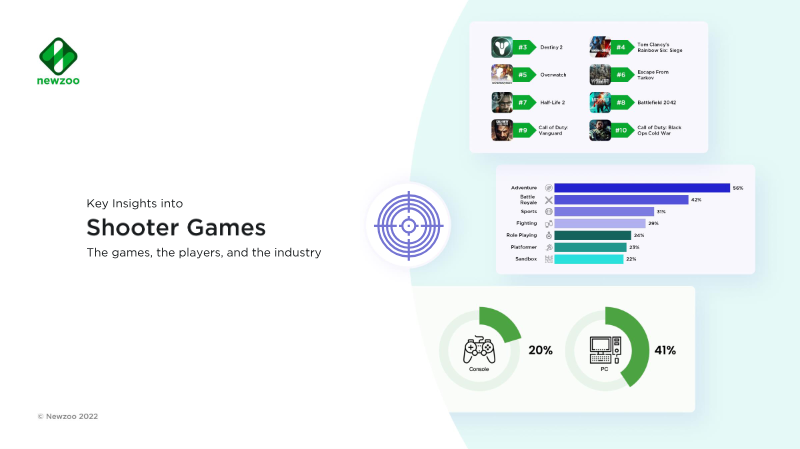
Key Insights into Shooter Games
Shooter games represent the fifth highest‑earning genre worldwide, generating approximately $2.24 billion in 2022 across all platforms. The report focuses on the genre’s popularity, player demographics, engagement patterns, and monetization strategies within a global context that excludes China and India. Data derive from Newzoo’s Global Games Market, Consumer Insights – Games & Esports 2022, and the Newzoo Expert platform, covering 37 markets with a sample of 19,544 recent shooter players and 60,020 broader gamers.
Key findings show that shooters dominate PC and console play, with 68 % of monthly active users (MAU) on these platforms also engaging in shooter titles. Player overlap with other genres is high: 56 % of shooter players also play adventure games, while strategy and simulation overlap remains low. The contemporary war theme and level‑based mechanics are the most common in shooter titles. Monetization is overwhelmingly pay‑to‑play; 97 % of shooter players experience in‑app purchases, and advertising is the least used model.
Demographically, core personas—Ultimate Gamers and All‑Round Enthusiasts—account for the largest shooter player base, yet nearly all persona groups play shooters. Motivations to spend include social interaction and access to special offers, with 13,659 of the 19,544 shooter players identified as payers. Live‑streaming data indicate that shooters rank highly on Twitch and Facebook Gaming, reinforcing the genre’s strong community presence. The report underscores shooters’ robust revenue streams, broad demographic appeal, and central role in competitive online play.
- Shooter games generated approximately $2.24 billion in 2022 across 37 global markets, excluding China and India.
- Shooters are a dominant force on PC and console platforms, capturing 68% of monthly active users.
- Monetization in the genre is heavily driven by in-app purchases, which are experienced by 97% of shooter players, while advertising remains the least utilized revenue model.
- Shooter players exhibit high cross-genre engagement, with 56% of the player base also participating in adventure games.
- The genre maintains a strong community presence and competitive profile, consistently ranking highly on streaming platforms like Twitch and Facebook Gaming.
+2
NewzooJan 2025

Report21 pages
Newzoo's Generations Report: How Different Generations Engage with Games
The report examines how gaming engagement varies across generational cohorts, drawing on a representative online sample of 72,068 respondents from 33 global markets (North America, EMEA, APAC). Data were collected via Computer Assisted Web Interviewing between January and April 2021. Findings show that younger generations devote a larger share of leisure time to gaming, with Gen Z and Millennials spending 11–12% of their free time on games versus 18% for Baby Boomers. Weekly playtime averages 7 hours and 20 minutes for Gen Z, 6 hours and 30 minutes for Millennials, dropping to just over 2 hours for Baby Boomers. Gaming remains the dominant entertainment medium across all ages, though motivations shift: younger players cite competition, socializing and achievement, while older players prioritize relaxation.
Platform preferences differ markedly; Gen Z spends 77% of gaming spend on mobile, whereas Baby Boomers allocate 73% to PC. Younger gamers also engage more with game‑related content, with 71–67% of Gen Z and Millennials both playing and watching games, compared to 44–51% for older cohorts. Persona segmentation reveals that “Ultimate Gamers” and “Community Gamers” dominate among Gen Z, whereas older groups are more likely to be “Time‑Fillers” or “Bargain Buyers.”
The report highlights the metaverse as a growing trend, with 70% of Gen Z and 63% of Millennials expecting to spend more time in virtual worlds. Overall, the study underscores a generational shift toward immersive, social gaming experiences and signals expanding opportunities for brands to reach diverse gamer audiences.
- Gen Z and Millennials spend significantly more time gaming weekly, averaging 7 hours 20 minutes and 6 hours 30 minutes respectively, compared to just over 2 hours for Baby Boomers.
- Platform spending habits are polarized by generation, with Gen Z allocating 77% of their gaming budget to mobile while Baby Boomers direct 73% of their spend toward PC.
- Engagement with game-related content is higher among younger cohorts, as 67–71% of Gen Z and Millennials both play and watch games, compared to 44–51% for older generations.
- Motivations for gaming diverge by age, with younger players prioritizing competition, socializing, and achievement, while older players primarily seek relaxation.
- The metaverse is a significant growth area, with 70% of Gen Z and 63% of Millennials anticipating increased time spent in virtual worlds.
+1
NewzooJan 2025

Report5 pages
Mobile Gaming M&A Playbook: How to Identify and Target High‑Growth Gaming Companies
The playbook outlines a systematic approach for mobile gaming publishers and investors to identify, evaluate, and acquire high‑growth developers. It argues that the mobile gaming market—projected to reach $138 billion in 2025—has become a prime arena for mergers and acquisitions, citing recent deals such as Zynga’s $2 billion purchase of Peak Games, EA’s $2.1 billion acquisition of Glu Mobile, and Embracer Group’s multi‑year funding round for future buys. The document stresses that M&A serves dual purposes: portfolio diversification and the acquisition of talent, expertise, and new IPs that can accelerate growth beyond a publisher’s core genres.
Key findings highlight the importance of data‑driven target selection. Sensor Tower’s Game Intelligence platform is promoted as a tool for tracking genre trends, revenue trajectories, and market share across regions. The playbook recommends establishing clear acquisition criteria—budget limits, company size, geographic focus—and using custom alerts and taxonomy filters to surface promising titles. It also advises building structured lead‑tracking workflows, labeling qualified versus unqualified prospects, and continuously monitoring portfolio performance to spot strategic shifts or revenue declines that may signal acquisition opportunities.
The scope covers the global mobile gaming industry, with particular emphasis on North America and Southeast Asia, over a recent five‑year period marked by accelerated M&A activity. Methodologically, the playbook relies on Sensor Tower’s proprietary analytics, supplemented by industry news feeds from outlets such as Pocket Gamer, VentureBeat, and Crunchbase. The conclusion urges publishers to leverage analytics, maintain rigorous criteria, and stay alert to market movements in order to secure advantageous acquisitions that align with long‑term growth objectives.
- The mobile gaming market is projected to reach $138 billion by 2025, driving significant M&A activity as publishers seek to diversify portfolios and acquire new talent and intellectual property.
- High-profile acquisitions demonstrate the scale of industry consolidation, including Zynga’s $2 billion purchase of Peak Games and EA’s $2.1 billion acquisition of Glu Mobile.
- Effective target identification requires a data-driven approach using platforms like Sensor Tower to track specific genre trends, revenue trajectories, and regional market share.
- Publishers should establish rigorous acquisition criteria—including defined budget limits, company size, and geographic focus—to systematically filter potential targets.
- Strategic lead-tracking workflows are essential for distinguishing qualified prospects from unqualified ones and monitoring existing targets for revenue declines or shifts that signal an acquisition opportunity.
+1
Sensor TowerJan 2025

Report29 pages
Sensor Tower India: Mobile Game Market Insights 2025
India is positioned as the world’s largest mobile‑gaming market, with 8.45 billion downloads recorded in FY 2024‑25 yet only $400 million in in‑app purchase (IAP) revenue, underscoring a pronounced monetization gap despite high engagement. Downloads have stabilized post‑pandemic while IAP spending has accelerated, largely driven by Google Play’s dominance and an expanding share of higher‑spending iOS users. Demographic analysis shows that 77 % of players are aged 18‑34, 86 % are male, and lifestyle titles uniquely attract a larger female audience.
Genre‑level insights reveal that casual, family‑oriented categories—Simulation (driving/flight), Arcade (platformer/runner), and Tabletop board games—generate the bulk of download volume. In contrast, monetization is concentrated in competitive, engagement‑heavy segments such as Shooter (Battle Royale), Casino, and Strategy (4X). Publishers are advised to pair mass‑appeal casual titles with monetization strategies that target the growing cohort of high‑value, competitive gamers.
India‑based publishers maintain robust domestic download volumes through culturally resonant titles like Ludo King and Dream11, yet monetization remains modest. To offset this challenge, publishers are expanding overseas revenue streams, with the US, Saudi Arabia, and the UK emerging as key markets. The dual strategy of leveraging local appeal for mass reach while pursuing international growth is presented as a pathway to enhance overall profitability in India’s mobile‑gaming ecosystem.
- India is the world's largest mobile-gaming market by volume, recording 8.45 billion downloads in FY 2024-25 but generating only $400 million in in-app purchase (IAP) revenue.
- Monetization is heavily concentrated in competitive, engagement-heavy genres including Shooter, Casino, and Strategy (4X), while high-volume downloads are driven by casual Simulation, Arcade, and Tabletop titles.
- The player base is predominantly male (86%) and aged 18-34 (77%), though lifestyle titles represent a unique segment for attracting female gamers.
- While domestic publishers maintain high download volumes through culturally resonant titles like Ludo King and Dream11, they are increasingly targeting the US, Saudi Arabia, and the UK to offset modest domestic monetization.
- IAP spending is showing signs of acceleration, supported by Google Play’s market dominance and an increasing share of higher-spending iOS users.
+1
Sensor TowerJan 2025