Skip to main content
Game Industry
Library
Library
Search
Ask AI
News
Connect your AI
Browse
The Catch Up
Topics
Collections
Writers
Help
Subscribe
Game Industry
Library
Library
Search
Ask AI
Saved
Library
34 reports matching your filters
All Types
Reports
Articles
Presentations
Whitepapers
Financial
Legal
Other
Search
Salary
Employment
Market Analysis
Global
Diversity & Inclusion
Europe
North America
USA
Game Development
UK
Player Demographics
Investment
Market Forecast
Asia
Japan
Streaming
Finland
Serbia
Clear
Filters
1
Salary
Recently added
Newest first
Oldest first
Title A–Z
Title Z–A
Report
36 pages
State of the Game Development Industry 2023: Workplace Health & HR Culture, Mental Trends
The game industry experienced significant instability in 2023, with 28% of the workforce affected by layoffs and an Employee Net Promoter Score of -19% indicating widespread dissatisfaction.
Economic recalibration and management failures are the primary drivers of industry distress, while AI automation currently accounts for only 3% of total job losses.
Workplace culture is suffering from 'quiet hiring' practices, where 37% of employees are absorbing expanded responsibilities without corresponding increases in compensation.
Employment
Salary
Diversity & Inclusion
+1
80 Level
Jan 2023
Report
61 pages
2023 Games & Interactive Salary & Satisfaction Survey
Salary has overtaken flexible work as the primary driver for career moves, with 31% of UK and Western European respondents citing higher pay as their main reason for leaving a position.
Artist compensation has seen a sharp 35% increase between 2021 and 2023, with mid-level artists now earning approximately £75k.
Project close-out periods are a critical retention risk, as 22% of UK respondents decline new offers to finish current projects and 46% of global staff are actively job hunting.
Salary
Employment
Global
Skillsearch
Jan 2023
Report
3 pages
UK Games Jobs Summary: November 2022
UK games industry recruitment contracted significantly in November 2022, resulting in over 500 fewer open vacancies compared to June 2022.
Mobile studios experienced the highest proportional reduction in job postings, largely driven by the completion or cancellation of roles following corporate mergers.
Despite the broader market decline, the industry added over 600 new job postings during the month, and the total number of tracked studios grew by eight companies.
Employment
Market Analysis
Salary
+1
Games Jobs Live
Nov 2022
Report
3 pages
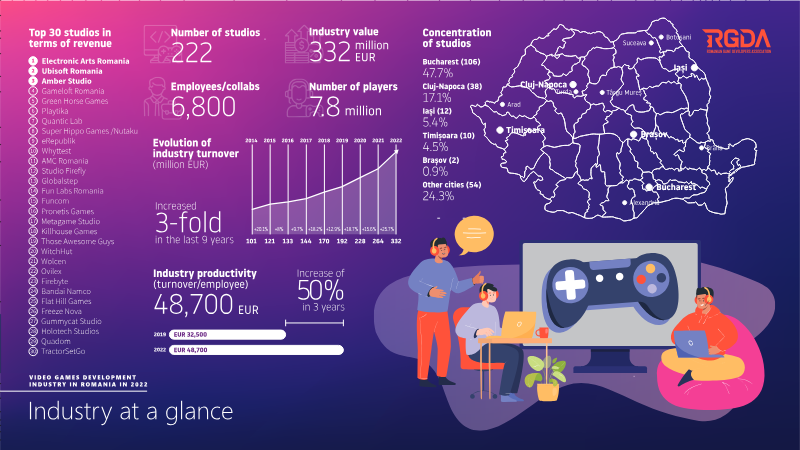
Video Games Development Industry in Romania – 2022 (Summary & Key Insights)
The Romanian video game industry generated between €222 million and €332 million in 2022, driven by a highly export-oriented model where over 70% of revenue comes from foreign markets.
Market concentration is high, with the top three players—Electronic Arts Romania, Ubisoft Romania, and Amber Studio—accounting for approximately 47% of total industry revenue.
Electronic Arts Romania is the largest single entity in the sector, reporting €106 million in revenue, followed by Ubisoft Romania and Amber Studio, which represent significant market shares of 47.7% and 38% respectively.
Market Analysis
Employment
Salary
+1
RGDA – Romanian Game Developers Association
Jan 2022
Report
17 pages
Annual Barometer of the Video Game Industry in France 2021
France is the second most attractive country globally for video game development, supported by a strong reliance on national tax credits and regional funding utilized by 41% of companies.
The industry is highly productive with approximately 1,350 games in development during 2021, 92% of which are original intellectual properties.
Despite high levels of optimism regarding the market, 36.5% of studios reported a financial deficit in 2020, marking the highest rate of insolvency since 2014.
Market Analysis
Salary
Employment
+1
Syndicat National du Jeu Vidéo
Jan 2021
Report
38 pages
Romanian Game Development Industry Report: 2020
The Romanian game development industry generated €218.5 million in revenue in 2020, marking a 19.1% year-on-year growth rate.
The broader IT sector, bolstered by state-aid schemes and tax exemptions, employed over 113,000 people and contributed approximately 6.8% of Romania's GDP in 2020.
Major AAA support studios including EA Romania, Ubisoft, and Gameloft employ roughly 750 developers in the country, contributing to global franchises like FIFA and Assassin’s Creed.
Market Analysis
Employment
Salary
+1
RGDA – Romanian Game Developers Association
Jan 2021
Whitepaper
2 pages
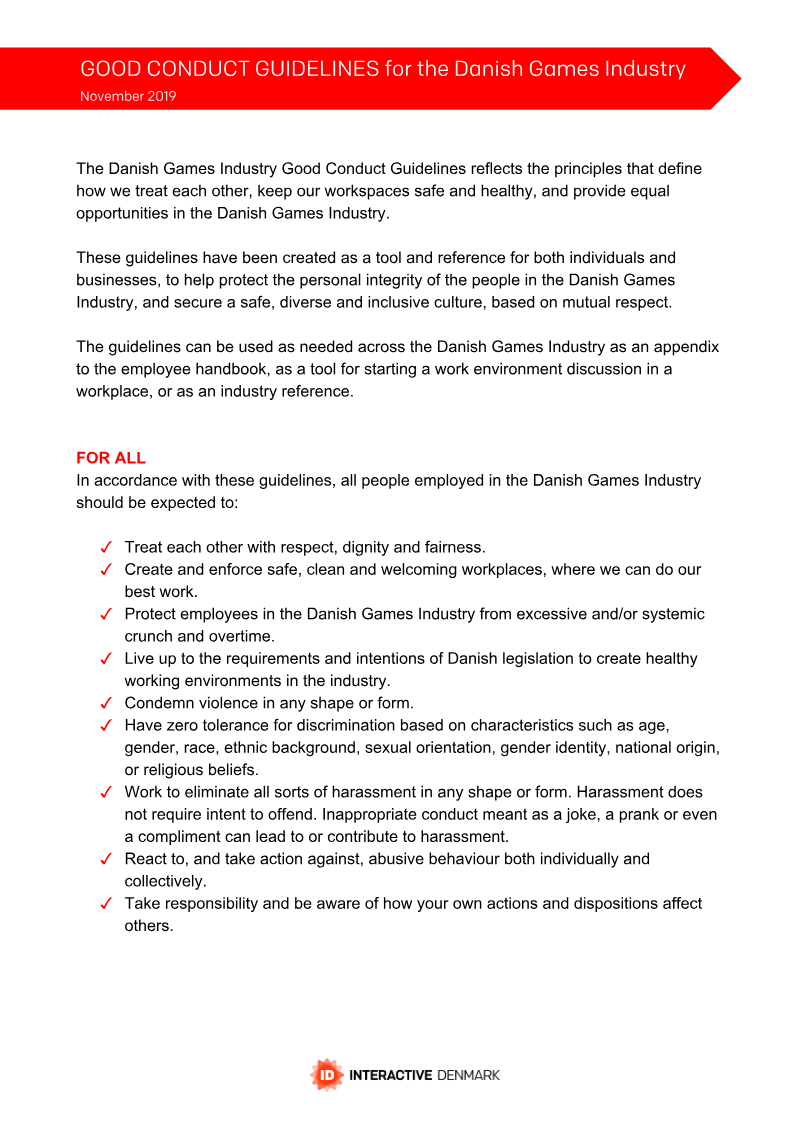
Good Conduct Guidelines for the Danish Games Industry
The Good Conduct Guidelines, published in November 2019, establish a standardized framework for professional behavior and workplace safety across the Danish game development sector.
The policy mandates the elimination of systemic crunch and excessive overtime to ensure a sustainable working environment for all industry staff.
Harassment is defined by its objective impact on the victim rather than the intent of the perpetrator, and the industry maintains a zero-tolerance stance toward all forms of abusive behavior.
Diversity & Inclusion
Employment
Salary
Danish Games Industry
Nov 2019
Report
41 pages
Romanian Game Development Industry Report 2019
The Romanian game development industry generated $188.5 million in 2018, representing a 19.2% year-over-year growth.
The sector employs over 6,000 professionals across approximately 103 active entities, primarily concentrated in Bucharest, Cluj-Napoca, and Timișoara.
77% of industry firms focus exclusively on game development, while the remainder provide ancillary services like quality assurance, testing, and publishing for international clients.
Market Analysis
Europe
Salary
RGDA – Romanian Game Developers Association
Jan 2019
Report
46 pages
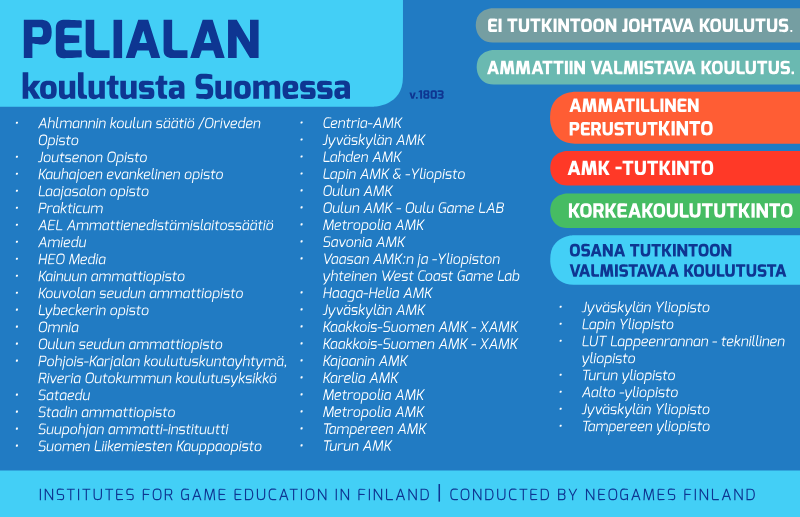
Koulutusta Suomessa
The Finnish educational landscape includes a diverse range of institutions such as Ahlmannin koulun säätiö, Oriveden Opisto, and Joutsenon Opisto.
Vocational and specialized training providers listed include AEL Ammattienedistämislaitossäätiö, Amiedu, and Kouvolan seudun ammattiopisto.
Media-focused education is represented by institutions such as HEO Media and Laajasalon opisto.
Employment
Salary
Finland
+1
Neogames Finland
Jan 2018
Report
51 pages
The Games Monitor 2018
The Games Monitor 2018 provides an updated analysis of the Dutch games industry, following previous research editions published in 2012 and 2015.
Market Analysis
Employment
Europe
+1
Dutch Games Association
Jan 2018
Report
36 pages
Dutch Games Monitor: The Netherlands 2015
The Dutch Games Monitor was first established in 2012 to provide comprehensive industry data through extensive surveys and interviews.
The 2012 edition served as the inaugural research project to offer a broad, structured insight into the state of the Dutch games industry.
Interest in data regarding the games industry has significantly increased in the years following the 2012 report.
Market Analysis
Employment
Europe
+1
Dutch Games Association
Jan 2015
Report
16 pages
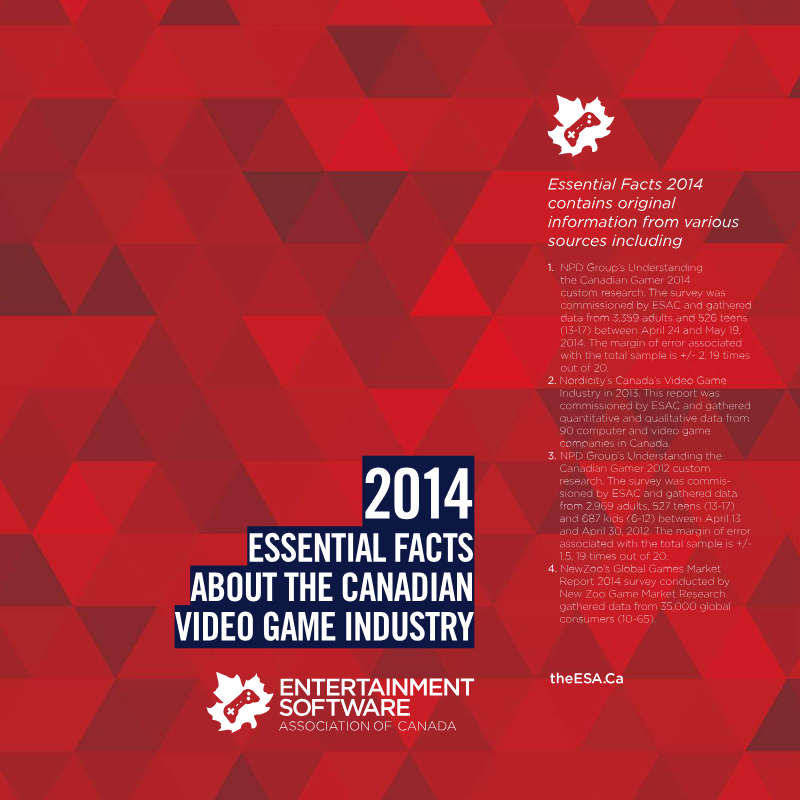
Essential Facts 2014: Canada
Canada’s video game sector directly employs 16,500 people, representing 27,000 full-time equivalent jobs.
The industry contributed $2.3 billion to Canada’s GDP and generated $1.6 billion in direct spending, marking a 12.5% increase since 2011.
Employment in the sector grew by 5% between 2011 and 2013, with 40% of firms projecting a 25% staff expansion within two years.
Market Analysis
Player Demographics
Salary
+1
ESAC – Entertainment Software Association of Canada
Jan 2014
Report
60 pages
Canada's Video Game Industry in 2013: Final Report
Canadian video-game firms rate tax credits as highly effective, awarding them an average satisfaction score of 4.4/5.
The tax-credit regime is a primary driver of industry expansion, with 40% of firms projecting revenue growth exceeding 25% in the coming year.
Tax incentives are most effective at creating project opportunities, which received an impact score of 4.0/5, followed by strong benefits for employee retention and industry visibility.
Market Analysis
Employment
Salary
+1
ESAC – Entertainment Software Association of Canada
Jul 2013
Report
19 pages
Faits Essentiels 2011 sur le Secteur Canadien des Jeux Vidéo et Informatiques
Canada’s video game industry generated C$1.7 billion in direct economic impact in 2011, ranking third globally in revenue and first in jobs per capita.
The sector employed approximately 16,000 workers across 350 firms, with an 11% growth rate over the previous two years and a projected 17% increase for the following two.
Quebec serves as the industry hub with 8,236 employees and C$733 million in spending, while Ontario exhibits the fastest growth trajectory at 20–21%.
Market Analysis
Salary
Player Demographics
+1
ESAC – Entertainment Software Association of Canada
Jan 2011
Previous
1
2
Next