1 free read left. Create a free account for unlimited reading + AI research.
Create free account
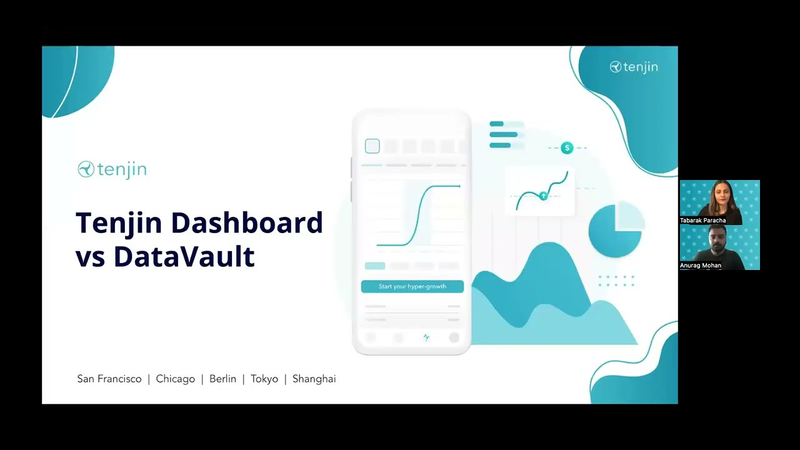
Tenjin Dashboard vs DataVault
Key insights
6 takeaways- 01Tenjin’s Dashboard provides an aggregated visualization interface for high-level performance tracking, supporting over 100 metrics including cohorted LTV and ROI.
- 02DataVault offers granular, user-level data access via a Redshift-hosted warehouse, enabling custom analysis and integration with external BI tools like Tableau.
- 03The Dashboard is organized into three specialized tabs dedicated to user acquisition, ad monetization, and SKAdNetwork performance tracking.
- 04Organizations can use DataVault to optimize bidding strategies by analyzing spend data at the creative level, segmented by geographic region.
- 05DataVault allows for advanced LTV calculations using impression-level revenue data, providing a more precise alternative to standard session-based metrics.
- 06The Growth Full Stack ETL service is available for organizations that require custom data implementations but lack the internal resources to manage complex data pipelines.
Ask AI about this video
Transcript
hi everyone this is the Barak from the marketing team at tenjin hey guys my name is anurag I'm from the customer success team at dungeon and today we will be discussing the tension dashboard versus data boat so anurag what is the difference between the tangent dashboard and Data Vault yeah so this is a very common question that we get from our customers um so tension has a lot of different features but the dashboard and data world is what customers use quite often um so the dashboard to quickly explain is the place where you can see all of your data at an aggregated level and dataworld is essentially the same data which is available at a much more granular level and also at the user level and what does the tangent dashboard look like and what metrics can I get access to yeah so our dashboard essentially is one of the best dashboards in the industry it has a very clean UI and a lot of our customers really love it um so our dashboard has more than 100
metrics available from cohorted metrics to non-covered metrics so cohorted metrics such as your LTD Roi otherwise is available on the dashboard and the dashboard is broken down into three different tabs one is the user guide position dashboard the ad monetization dashboard and also the scad network dashboard a quick example of the kind of data you can see on the dashboard is we do add Revenue allocation on the dashboard so we tell you which campaign generated how much lpv and how much revenue for you and we also give you cohorted Roi data for your in-app purchases data and also for the ad Revenue data so all of this visualization and aggregation is available on the dashboard field great and what is Data Vault so as I mentioned dataworld is a data warehouse where you can see all of the same data at a user level so it's a space that we give you on redshift and will be our own data warehouse so this is where you would have your user level data so the same data but at a lower
latency and this essentially allows you to build much more specific use cases and custom use cases Beyond whatever data you can see on the dashboard so a lot of our customers use dataworld essentially to have their own use cases and their own custom analysis and how do companies use data World exactly yeah so some of the common use cases that we see with dataworld is customers use it for data virtualization purposes so they use all of this data and feed it into a bi tool such as Tableau or any other bi tool and build out certain specific visualizations that they use for their internal reporting another common use case that we see is uh data World allows you to look at your spend data at the creative level so what this allows you to do is it allows you to optimize your bidding for your UA efforts much more better so once you know what sort of spend you have let's say broken down by country for each of your creatives you can get this data
into a bidding tool that you're using and optimize on your bids and another very common use case that now we see is with uh calculating LTV using your ilrd data which essentially is your impression level Revenue data the tension dashboard calculates ldb based on sessions but if you want your ltvs to be calculated based on the compression level Revenue data that you have from your mediation provider you can use dataworld to sort of track this information and then calculate LPB based on that data and this is something that we can also build out using our new ETL service called both full stack so uh if a customer on an Advertiser is not comfortable building all these complex data pipelines we can help them out using growth full stack and build out this specific use case for them great thanks anurad that was really helpful and thank you everyone for listening if you do have any questions
on the tangent dashboard or Data Vault please either leave us a comment on this video or contact us directly at support tension.com thanks thank you
Summary
The Tenjin platform offers two primary analytical tools, the Dashboard and DataVault, which serve distinct purposes based on the level of data granularity required by mobile advertisers. The Dashboard functions as an aggregated visualization interface, providing a high-level overview of performance metrics. It features a clean user interface and supports over 100 metrics, including cohorted data such as lifetime value (LTV) and return on investment (ROI). The Dashboard is organized into three specialized tabs covering user acquisition, ad monetization, and SKAdNetwork, enabling users to perform tasks like ad revenue allocation and campaign-level performance tracking.
In contrast, DataVault serves as a dedicated data warehouse hosted on Redshift, providing access to the same underlying data at a granular, user-level scale. While the Dashboard is optimized for quick, aggregated insights, DataVault is designed for custom analysis and specialized use cases that require deeper data manipulation. By offering lower latency and raw data access, it allows organizations to integrate their metrics into external business intelligence tools like Tableau for bespoke reporting.
Common applications for DataVault include optimizing user acquisition bidding strategies by analyzing spend data at the creative level, broken down by geographic region. Furthermore, it enables advanced LTV calculations based on impression-level revenue data, which provides a more precise alternative to session-based calculations found in standard dashboards. For organizations lacking the internal resources to manage complex data pipelines, the platform provides an ETL service known as Growth Full Stack to facilitate these custom implementations. Together, these tools provide a tiered approach to data management, balancing ease of use with the flexibility required for sophisticated performance marketing.




















Comments