Skip to main content
Game Industry
Library
Library
Search
Ask AI
News
Connect your AI
Browse
The Catch Up
Topics
Collections
Writers
Help
Subscribe
Game Industry
Library
Library
Search
Ask AI
Saved
Tenjin | Game Industry Library
Writers
Tenjin
Back to Writers
Tenjin
Research
11 documents
Documents
Reports
Presentations
Whitepapers
Articles
Financial
Legal
Other
Recently added
Newest first
Oldest first
Title A–Z
Title Z–A
Report
19 pages
Hyper-Casual 9 Games Benchmark Report: Q3 2022
iOS maintains a significant retention advantage over Android across all performance tiers, with top-tier iOS games achieving 51% day-1 and 22% day-7 retention compared to 42% and 16% on Android.
The cost-per-install (CPI) gap between Android and iOS has narrowed to 10 cents, down from a four-year average of 15 cents, indicating intensified competition on the Android platform.
Median hyper-casual titles show a clear performance disparity between platforms, with iOS recording 25% day-1 and 6% day-7 retention versus 19% and 3% on Android.
Monetization
Market Analysis
Tenjin
Jan 2025
Report
11 pages
From Hyper to Hybrid: 2023 Follow-up
In-app purchase (IAP) activity grew significantly between 2022 and H1 2023, with revenue increasing by 23% on Android and 24% on Apple platforms.
On iOS, the United Kingdom, Canada, and Germany have displaced China and Saudi Arabia in the top five markets for installs, signaling a pivot toward Western regions.
Google Ads became the top-performing network for Android installs in H1 2023, while AppLovin reclaimed the leading position for iOS installs.
Market Analysis
Mobile
Hypercasual
+4
Tenjin
Jan 2023
Report
27 pages
Hyper to Hybrid: Mobile Gaming Market Trends 2023
Mobile developers are shifting from hyper-casual to hybrid-casual models to counter declining ad revenue profitability caused by Apple’s App Tracking Transparency and post-pandemic behavioral shifts.
In-app purchase volume grew across both Android and iOS in 2022, signaling a successful industry-wide pivot toward diversified revenue streams beyond traditional advertising.
Ad-centric monetization models faced a cooling market in 2022, characterized by a downward trend in both ad impressions and effective cost per mille (eCPM) on all platforms.
Market Analysis
Monetization
User Acquisition
+3
Tenjin
Jan 2023
Report
11 pages
From Hyper to Hybrid in 2023
In-app purchase revenue grew significantly between January 2022 and June 2023, with a 23% increase on Android and a 24% increase on iOS.
Google Ads became the top-performing network for Android installs in H1 2023, while AppLovin rose to the number one position for iOS installs.
Meta has successfully entered the top five ad networks on both Android and iOS platforms as of H1 2023.
Monetization
User Acquisition
Mobile
+1
Tenjin
Jan 2023
Report
27 pages
From Hyper to Hybrid in 2023 (2023)
The mobile gaming market is shifting away from pure hyper-casual models toward hybrid strategies that combine ad revenue with in-app purchases (IAP) to counter declining profitability.
Profitability in the hyper-casual sector has been negatively impacted by iOS App Tracking Transparency, post-COVID user behavior shifts, and higher publisher thresholds for hit metrics.
The United States leads global eCPM earnings across both Android and iOS, while India holds the top position for total ad impressions and IAP volume.
Monetization
In-Game Advertising
Market Analysis
+3
Tenjin
Jan 2023
Report
27 pages
From Hyper to Hybrid: Hypercasual Gaming Trends 2023
The mobile gaming industry is shifting from hyper-casual to hybrid-casual models, driven by declining ad revenue profitability and the impact of iOS App Tracking Transparency.
Developers are increasingly adopting in-app purchases and meta-gameplay components to replace the traditional reliance on pure advertising revenue.
Data from 2022 shows a consistent downward trend in ad impressions and eCPMs across both Android and iOS platforms, while in-app purchase volume grew.
Market Analysis
Monetization
User Acquisition
+1
Tenjin
Jan 2023
Report
17 pages
Hyper-Casual Games Benchmark Report: Q4 2022
Hyper-casual median CPI reached an all-time high of $0.42 in Q4 2022, with iOS experiencing a significant $0.17 increase compared to the previous quarter.
iOS consistently outperformed Android in retention, with top-tier (top 2%) games achieving 45% Day 1 retention on iOS compared to 38% on Android.
The United States recorded the highest iOS median CPI among top ad-spending countries at $0.80, while Brazil fell out of the top ten ranking.
Market Analysis
Monetization
User Acquisition
+3
Tenjin
Dec 2022
Report
19 pages
Hyper-Casual Benchmark Report Q3 2022
Hyper-casual revenue remains primarily driven by high-volume user acquisition paired with optimized ad mediation to maximize value during short player lifecycles.
Market leadership among ad networks is defined by the ability to deliver massive scale at low costs per install while integrating seamlessly with attribution partners.
Successful publishers are mitigating the impact of privacy-driven attribution changes by utilizing sophisticated data analytics to balance ad spend across diverse networks.
Market Analysis
Monetization
User Acquisition
+3
Tenjin
Sept 2022
Report
18 pages
Hyper-Casual Games Benchmark Report
Median CPI for hyper-casual games reached an all-time high of $0.42 in Q4 2022, signaling a significant increase in user acquisition costs.
Median CPL rose to $0.20 on both Android and iOS in Q4 2022, with Android costs increasing by $0.05 and iOS costs by $0.17 compared to Q3.
iOS consistently outperforms Android in player retention, with top-tier games achieving 45% day-1 retention on iOS compared to 38% on Android.
Monetization
User Acquisition
Tenjin
Jan 2022
Report
1 pages
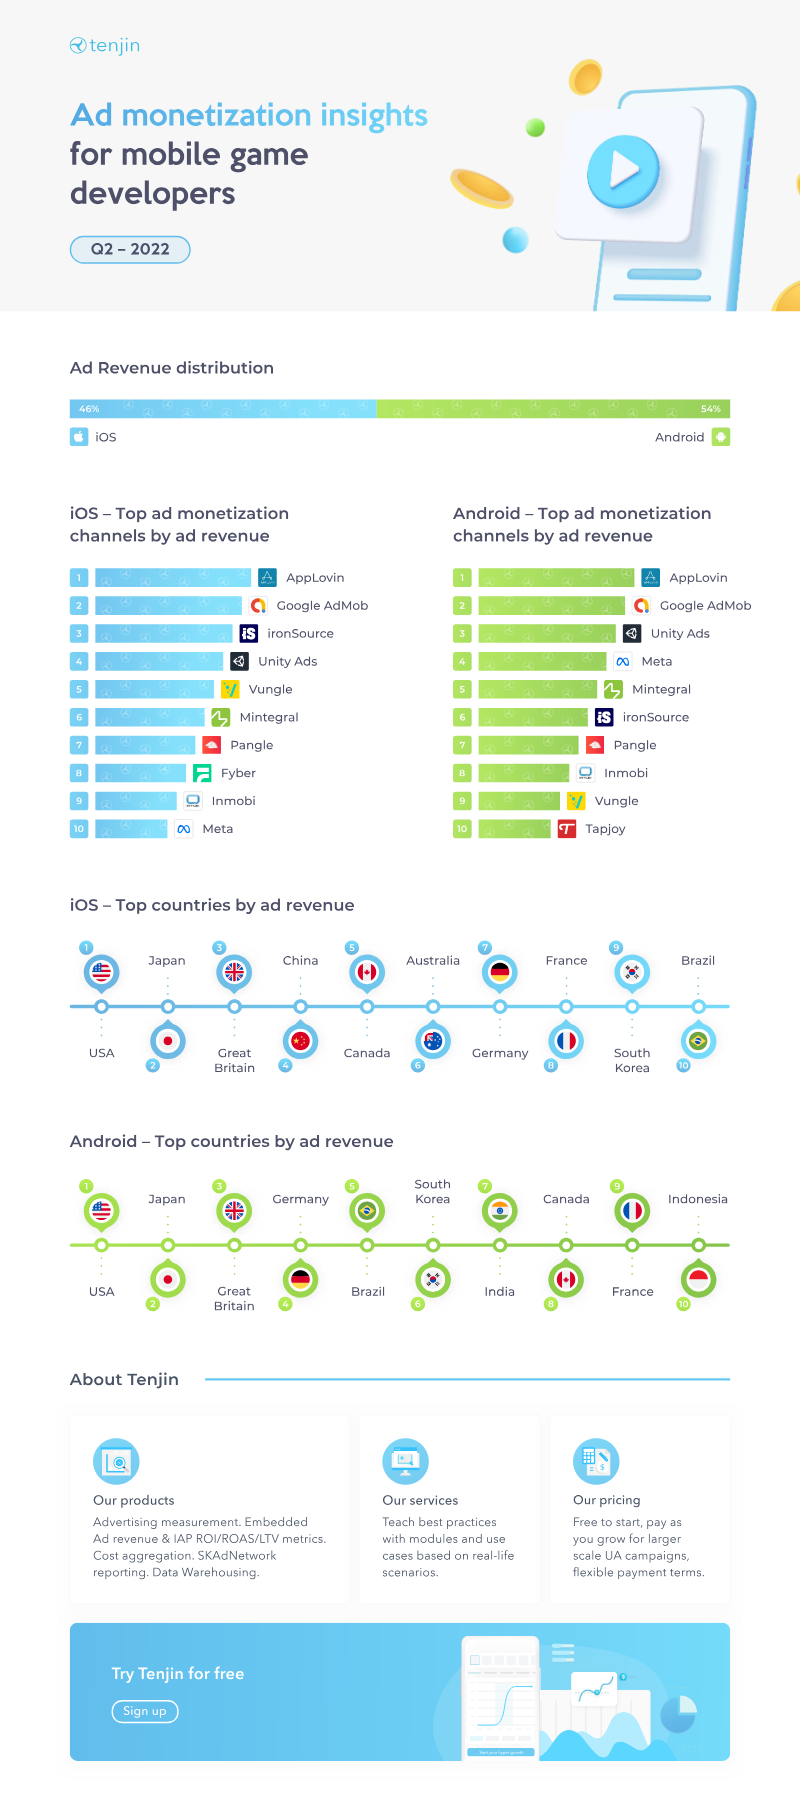
Ad Monetization Insights for Mobile Game Developers 2022
Advertising accounts for 54% of total revenue across the mobile game markets surveyed in 2022.
Effective monetization requires integrating ad revenue, in-app purchase data, and cost metrics to accurately calculate ROI, ROAS, and LTV.
Key regional markets for mobile game monetization include Germany, Japan, South Korea, Canada, and Indonesia.
Monetization
Advertising
Global
+1
Tenjin
Jan 2022
Report
17 pages
The Hyper-Casual Benchmark Report: Q3 2022
Retention is the primary differentiator for success, with top-tier hyper-casual games significantly outperforming the median cohort as acquisition costs rise.
Median cost-per-install (CPI) reached record highs in Q4 2022, hitting $0.20 on Android and $0.42 on iOS.
iOS consistently outperforms Android in retention, with top-tier titles achieving 45% Day 1 retention on iOS compared to 38% on Android.
Market Analysis
Monetization
User Acquisition
+5
Tenjin
Jan 2022