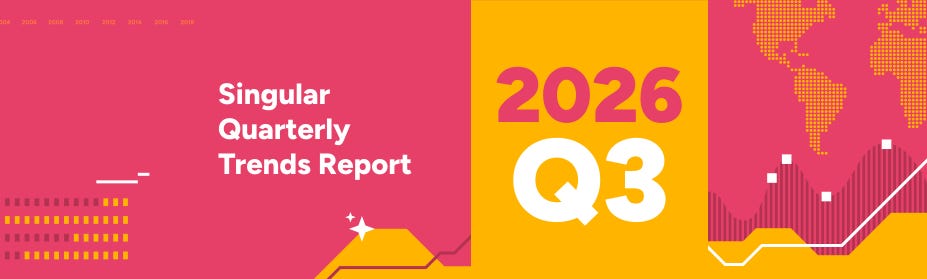
The mobile game marketing landscape in the second quarter of 2026 experienced a notable recovery in ad spending, characterized by a 14.77% quarter-over-quarter increase across the mobile app ecosystem. This growth was balanced between Android and iOS platforms, though iOS continues to command a larger share of total spend at 53.42%. Despite the rise in expenditure, iOS impressions declined by 5.40%, contributing to a 21.36% surge in cost-per-mille (CPM) on the platform. Conversely, Android saw a 6.40% increase in impressions. The analysis, based on a massive dataset of billions of dollars in ad spend and trillions of impressions, highlights a shift in market dynamics where hypercasual games have unexpectedly transitioned into a more expensive genre category.
Marketing efficiency metrics showed mixed results, with the average cost-per-install (CPI) rising 8.47% to $1.25. Gaming-specific CPI reached $1.12, reflecting a 9.30% increase. The cost disparity between platforms remains significant, as an iOS install now costs 4.37 times more than an Android install. Geographically, the United States remains the dominant market, accounting for 59.11% of total ad spend. While spend in the U.S. grew by 12.33%, the fastest growth occurred in Tier 2 East and Tier 1 East regions. Additionally, the App Tracking Transparency (ATT) opt-in rate for games was recorded at 9.84%, though this figure is influenced by a new calculation methodology that includes all iOS users.
The ad network landscape saw Google Ads, AppLovin, and Moloco leading in spend growth, while Meta emerged as the top network for acquiring new advertisers. Notably, OpenAI entered the ad network rankings for the first time, signaling the growing influence of AI platforms in user acquisition. Furthermore, data regarding AI-driven app recommendations indicates that store pages remain the primary source for citations, with higher-ranked recommendations consistently providing more verifiable sources than those lower on the list.
GameDev Reports · 2026
GameDev Reports · 2026
GameDev Reports · 2026
GameDev Reports · 2026
GameDev Reports · 2026
GameDev Reports · 2026

GameDev Reports · 2026
GameDev Reports · 2026
GameDev Reports · 2026

GameDev Reports · 2026
GameDev Reports · 2026
GameDev Reports · 2026
Tenjin · 2023
Tenjin · 2022
AdQuantum · 2022
SocialPeta · 2021
Gamesforum
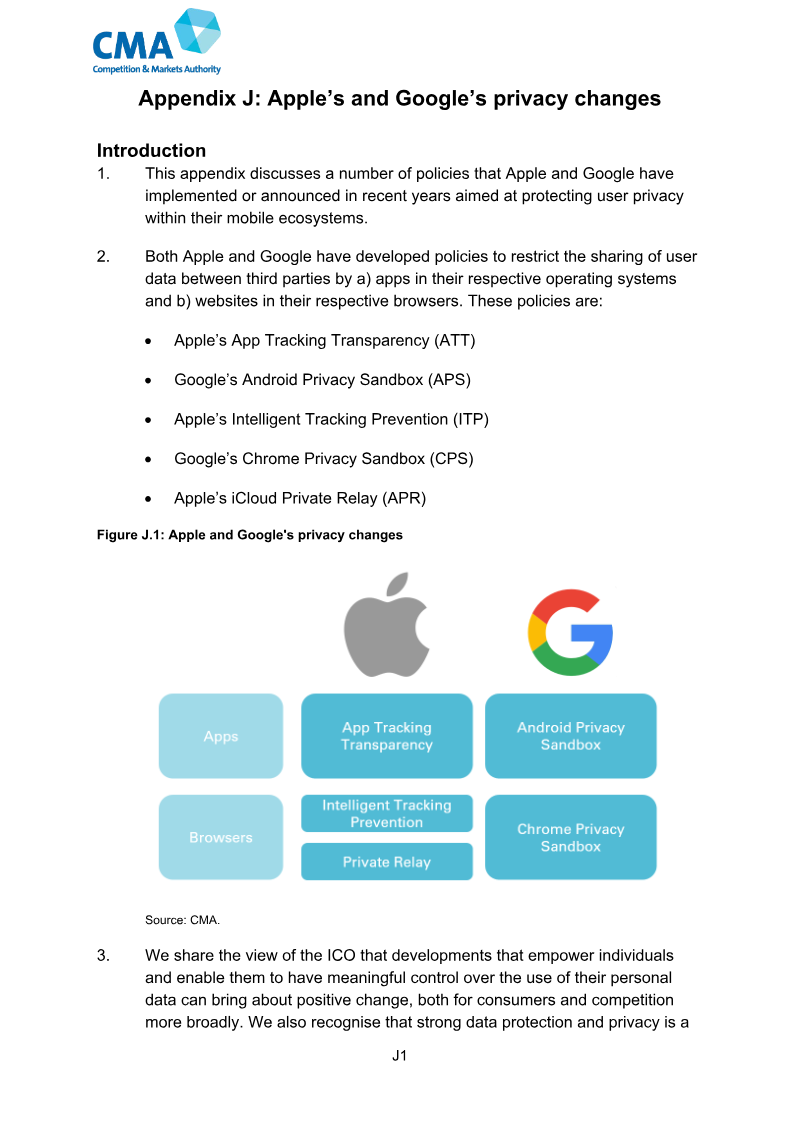
Competition · 2026
Almedia · 2026
Gamesight · 2026

SocialPeta · 2026
SocialPeta · 2026
InvestGame · 2026

SocialPeta · 2026