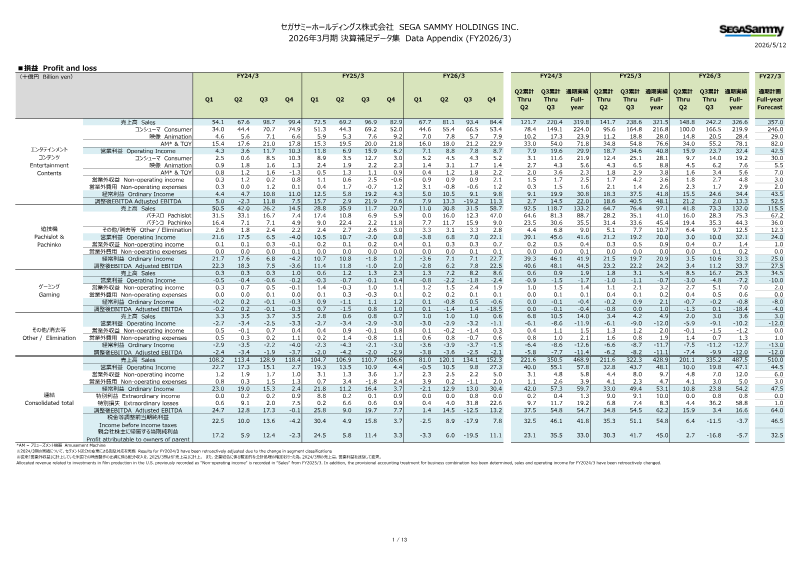
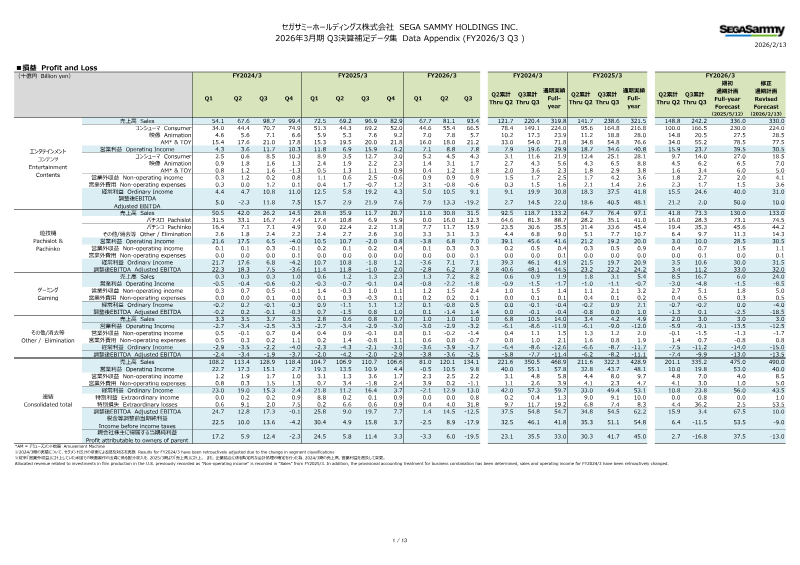
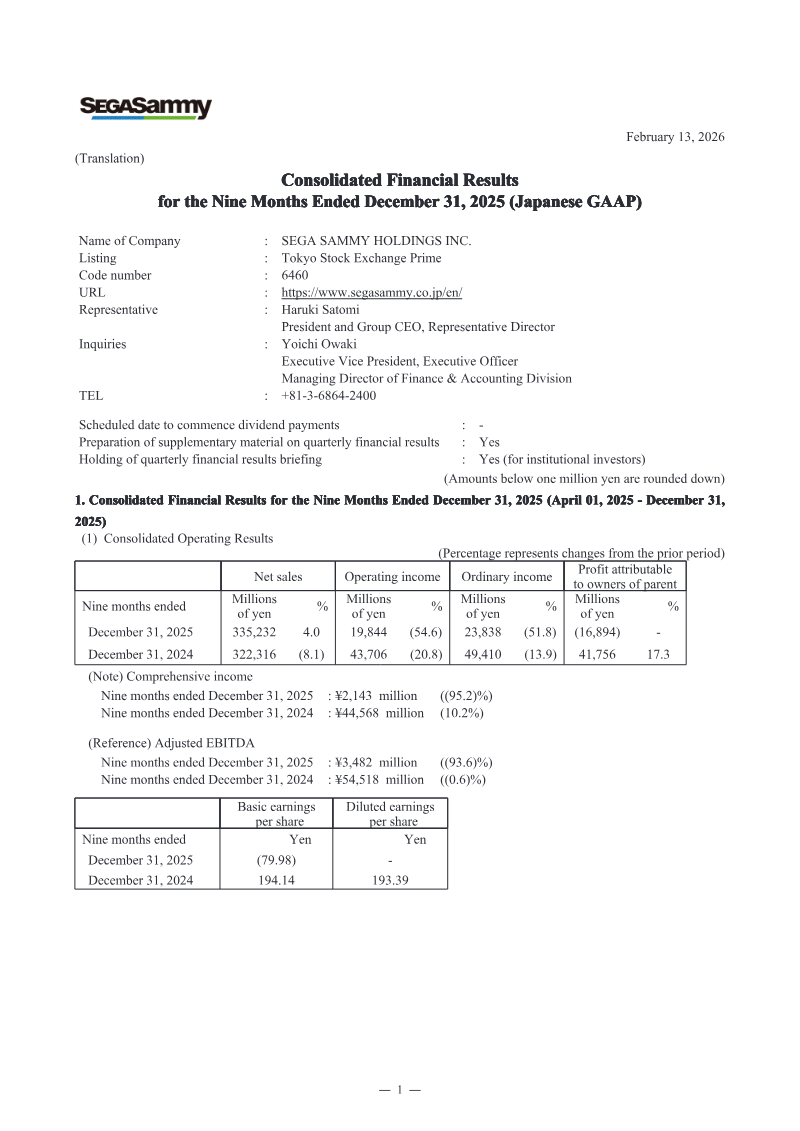
The analysis demonstrates a robust expansion of the company’s revenue and profitability over the FY24/3 to FY27/3 period, with total sales projected to climb from ¥54.1 bn in the first quarter of FY24/3 to ¥357.0 bn by FY27/3. This growth is largely driven by the consumer and entertainment segments, which account for roughly 70 % of overall sales. Operating income is expected to rise from ¥4.3 bn in FY24/3 Q1 to ¥78.1 bn by FY27/3, while adjusted EBITDA is projected to increase from ¥5.0 bn to ¥62.2 bn, underscoring improving profitability margins.
Segment‑level data reveal that consumer sales doubled over the period, whereas entertainment content and gaming experienced moderate gains. International markets consistently outperform domestic ones, with overseas sales maintaining a ratio above 60 % across all years. Within the gaming portfolio, flagship IPs such as the Sonic series saw a 20 % year‑over‑year increase in unit sales during FY26/3 Q1–Q3, and the War series grew by 15 %. Free‑to‑play titles added only one new launch and saw two cancellations, indicating a cautious approach to that segment. The casino division posted revenue growth from KRW 91.2 bn in Q1 FY24/3 to KRW 156.2 bn by the end of FY26/3, driven largely by a 30 % rise in casino sales and a 25 % increase in hotel revenue.
Pachinko and Pachislot performance metrics show fluctuating market share for the company, with sales shares ranging between 21 % and 24 % from 2023 to 2024. Prototype approval rates varied widely, from 21 % to 80 % for Pachislot and 23–34 % for Pachinko between 2023‑2025. Utilization shares declined modestly, with Pachislot utilization falling from 30.8 % in FY25/3 to 30.1 % in FY26/3, and Pachinko utilization dropping from 34.9 % to 23.8 %, suggesting a relative loss of market activity compared with competitors.
Overall, the data indicate sustained top‑line growth and improving profitability driven by strong international performance and a diversified product mix, while the company faces increasing competition in the Pachinko/Pachislot arena that may require strategic adjustments to maintain market share.
Sega Sammy Holdings · 2026

Sega Sammy Holdings · 2026
Sega Sammy Holdings · 2026
Sega Sammy Holdings · 2026

Sega Sammy Holdings · 2025
Sega Sammy Holdings · 2025
Sega Sammy Holdings · 2025
Sega Sammy Holdings · 2024

Sega Sammy Holdings · 2024
Sega Sammy Holdings
Sega Sammy Holdings
Sega Sammy Holdings

Sony Group Corporation · 2026

Bandai Namco · 2026

InvestGame · 2025

Square Enix · 2025
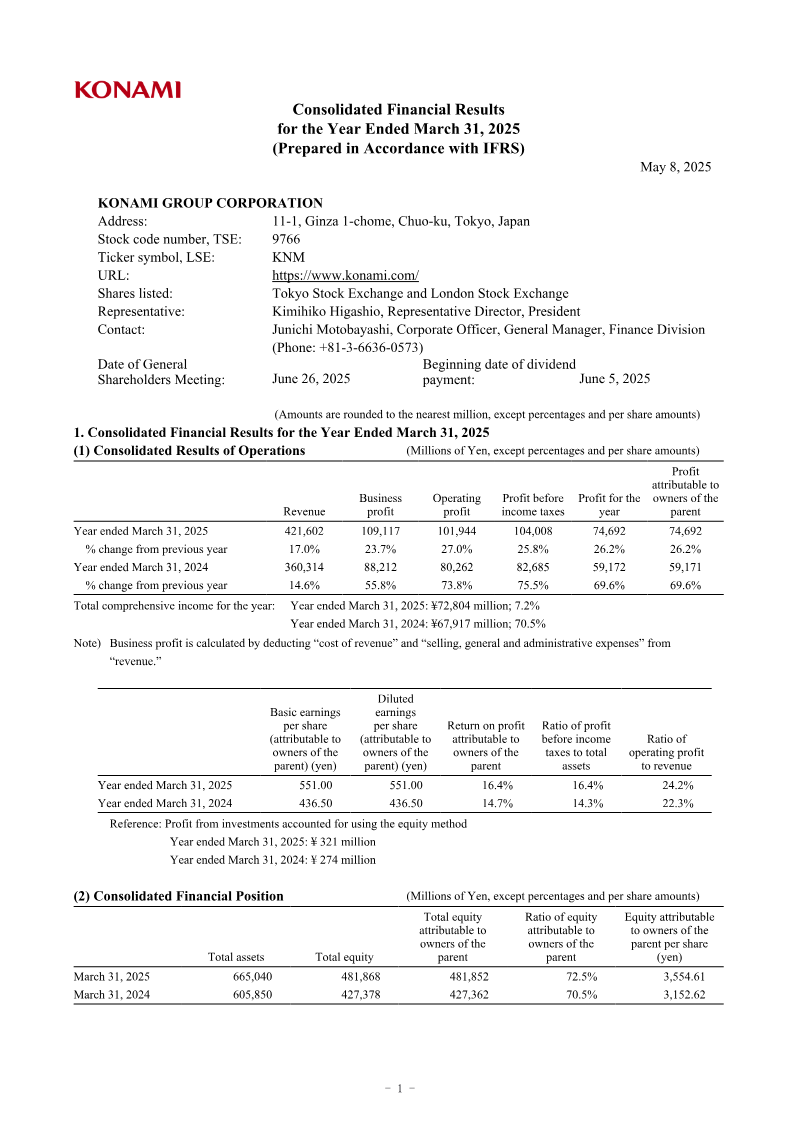
Konami · 2025
Nintendo · 2024
Bandai Namco · 2022

Bandai Namco · 2021
GREE · 2017

Bandai Namco · 2017
GREE Inc. · 2016
Bandai Namco · 2014