FinancialSega Sammy Holdings
Fiscal Year Ended March 2026: Results Presentation
62 pages~81 min full read
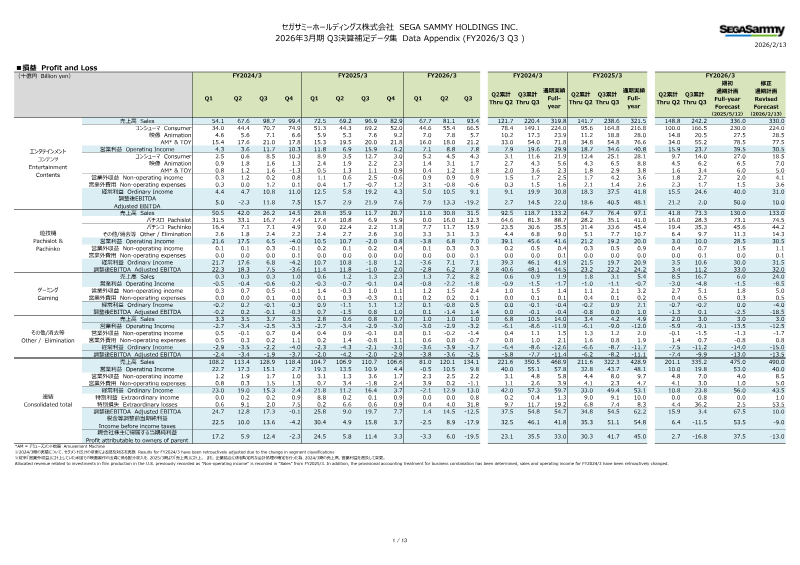
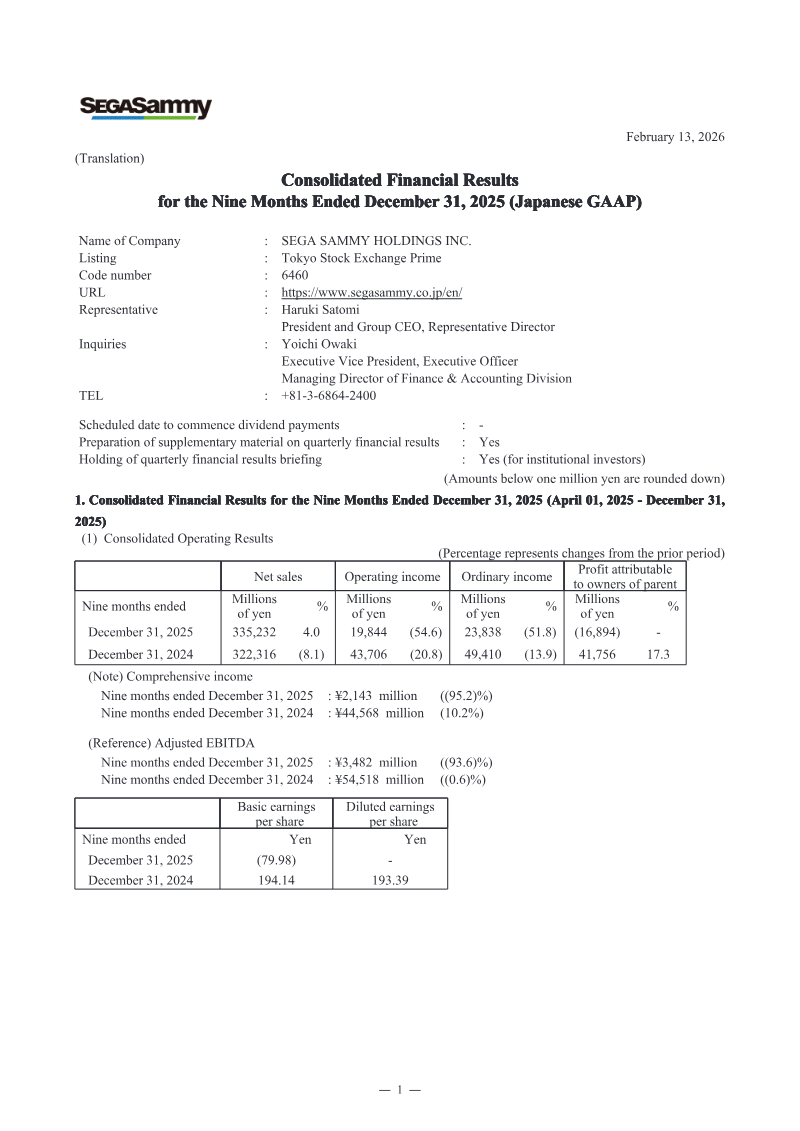
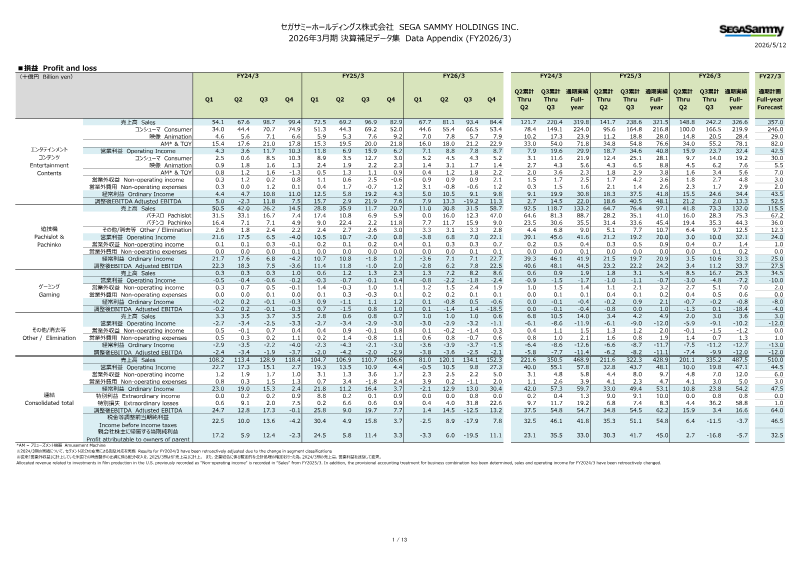
Fiscal Year 2026/3 saw Sega Sammy’s revenue rise to ¥487.5 billion, driven by robust pachislot and Pachinko sales and the acquisition of two gaming companies. Despite higher top‑line growth, operating income fell to ¥47.1 billion because of a ¥58.8 billion extraordinary loss from goodwill impairments on Rovio and Stakelogic, resulting in a net loss of ¥5.7 billion. Adjusted EBITDA contracted sharply to ¥16.6 billion, though operating forecasts were met and sales are expected to climb further in FY2027/3; profits, however, will likely decline until the newly acquired gaming assets stabilize.
The balance sheet shows goodwill unchanged at ¥26.3 billion, with other intangible assets amortised over 4–20 years. Cash flow from operations rose to ¥25.9 billion, largely due to impairment and amortisation gains, while investing cash outflows of ¥22.5 billion reflected the acquisitions of GAN and Stakelogic, leaving a modest free cash flow of ¥3.4 billion.
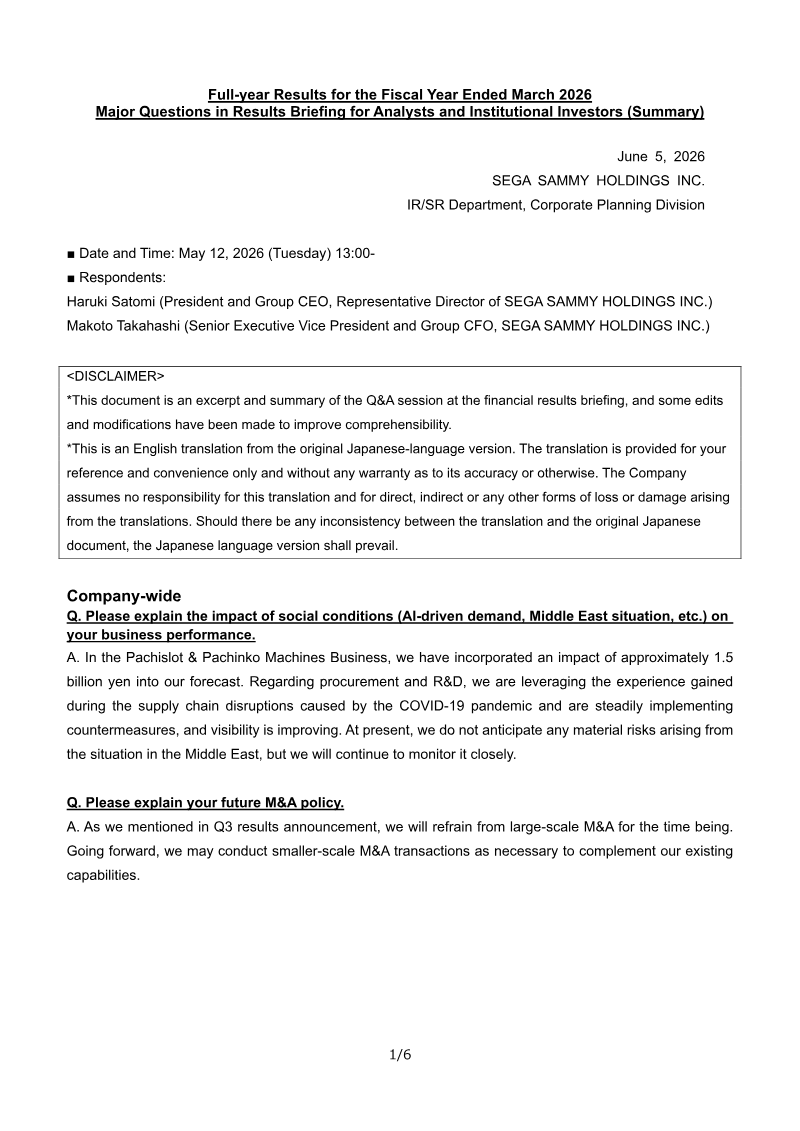
Pachislot and Pachinko machine sales reached ¥132 billion, supported by flagship titles such as Smart Pachislot Hokuto No Ken and the new IP Tokyo Revengers. Operating income for this segment climbed to ¥32.1 billion, but a forecasted decline in FY2027/3 sales to ¥115.5 billion is anticipated, driven by fewer mainstay titles, a shift toward lower‑priced reel units, and rising semiconductor costs. The company expects new IP launches in the second half of FY2027/3 to offset this downturn.
Medium‑term projections now target cumulative adjusted EBITDA just under ¥110 billion, far below the original over‑¥180 billion goal, and a return on equity that will miss the 10 % benchmark. Sales are projected to exceed ¥500 billion for the first time since FY2007/3, yet adjusted EBITDA and ordinary income for FY2027/3 are expected to fall short of plan targets. Key challenges include underperformance of new free‑to‑play titles, launch delays, and the need to improve profitability from recently acquired assets.
Rovio’s post‑acquisition sales have underperformed, with Angry Birds 2 stabilising but remaining below prior levels. The strategy focuses on revitalising core titles, expanding the Angry Birds IP through film and licensing initiatives, and launching additional mobile games in China to restore earnings. Operational improvements, trans‑media expansion, and targeted IP development underpin the plan for steady growth.
Gaming‑machine sales continue to grow, reaching ¥8.3 billion in FY2026/3 with profitability across all profit levels. A strategic shift toward lease‑centric revenue is expected to drive medium‑to‑long‑term profits, despite a modest FY2027/3 sales forecast. Key titles such as the Railroad RICHES and Super Burst series maintain high utilisation, supporting strong casino revenue. The company is expanding its B2B footprint in the U.S., launching a next‑generation “V2” platform and pursuing social‑casino porting, while implementing proactive marketing and cost‑control initiatives across B2C and B2B segments.
Sega Sammy Holdings Inc. operates as a Nevada‑registered public company, with subsidiaries licensed to manufacture, distribute, and provide information services for gaming equipment in Nevada and other jurisdictions. Shareholders are subject to Nevada Gaming Authority rules, with similar regulatory constraints potentially applying elsewhere. Forward‑looking statements acknowledge uncertainties arising from economic, regulatory, and operational risks that could materially affect future performance.
Sega Sammy Holdings · 2026

Sega Sammy Holdings · 2026
Sega Sammy Holdings · 2026
Sega Sammy Holdings · 2026
Sega Sammy Holdings · 2025
Sega Sammy Holdings · 2025
Sega Sammy Holdings · 2025
Sega Sammy Holdings · 2024

Sega Sammy Holdings · 2024
Sega Sammy Holdings
Sega Sammy Holdings
Sega Sammy Holdings

Sony Group Corporation · 2026

Bandai Namco · 2026

InvestGame · 2025
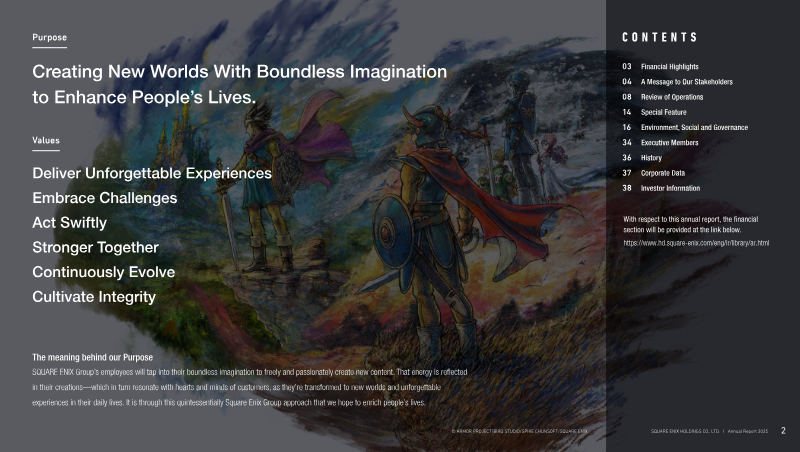
Square Enix · 2025
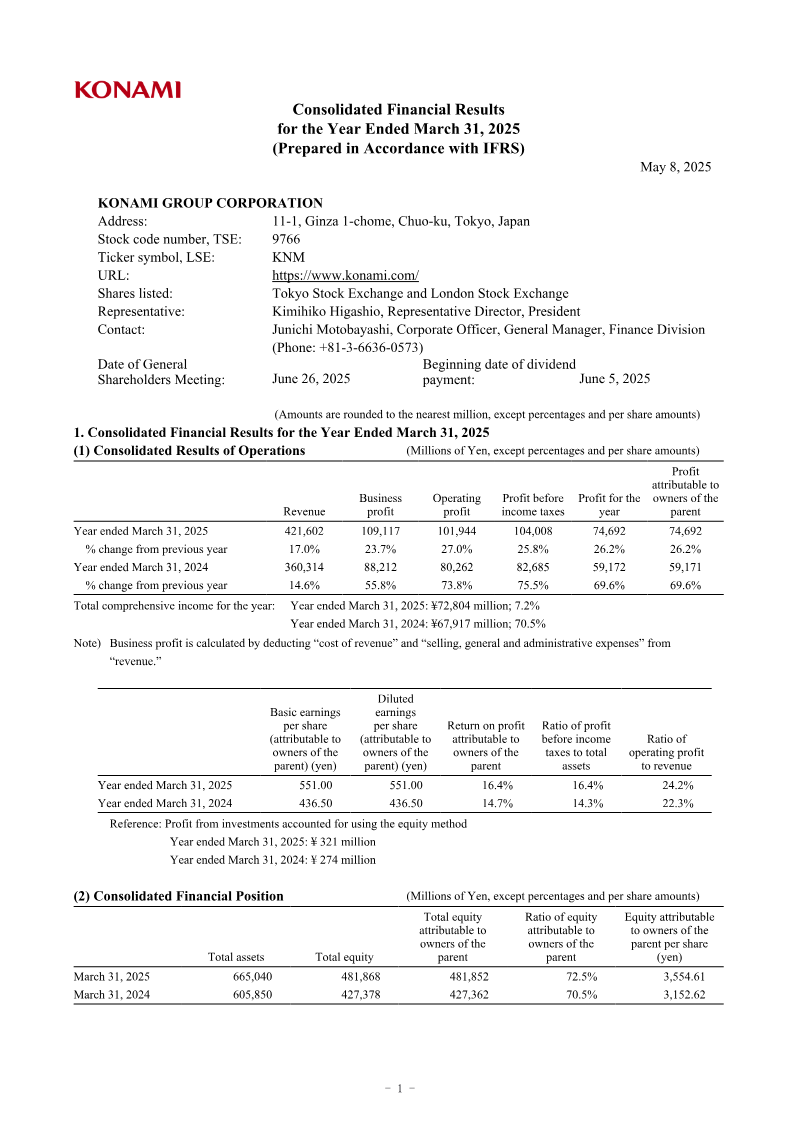
Konami · 2025
Nintendo · 2024
Bandai Namco · 2022

Bandai Namco · 2021
GREE · 2017

Bandai Namco · 2017
GREE Inc. · 2016
Bandai Namco · 2014