FinancialSony Group Corporation
FY2025 Consolidated Financial Results
7 May 202628 pages~27 min full read
Sony Group’s FY2025 consolidated results demonstrate modest revenue growth and a mixed profitability profile across its core business units. Total sales increased 4 % to ¥12.48 trn, largely driven by higher operating income in the Imaging & Sensing Solutions (I&SS) and Music segments. Operating income rose 13 % to ¥1.45 trn, while net income attributable to shareholders fell 3 % to ¥1.03 trn because of a larger equity‑method loss in the Financial Services arm and higher impairment charges. Operating cash flow remained flat at ¥1.97 trn, and the spin‑off of Sony Financial Group was treated as a discontinued operation from Q1 FY25 onward.
Within the Music division, sales climbed 15 % to ¥277.5 billion, propelled by growth in Recorded Music and Music Publishing streaming revenues (+9 % and +14 % respectively), live‑event income, and a strong contribution from the Demon Slayer franchise. Operating income in this segment surged 25 % to ¥89.7 billion, reaching a record high even after excluding one‑time items. Sony projects flat sales for FY2026, with operating income expected to decline 11 % to ¥47 billion as streaming gains are offset by the loss of Demon Slayer’s impact.
The company consolidates its Pictures and Music results on a U.S. dollar basis, translating foreign‑currency sales and costs using weighted average exchange rates while accounting for hedging transactions. Foreign‑exchange fluctuations affect both sales and operating income, with I&SS hedging gains or losses incorporated into these calculations. These disclosures supplement, but do not replace, Sony’s IFRS‑compliant consolidated financial statements.

Bandai Namco · 2026

InvestGame · 2025

Square Enix · 2025
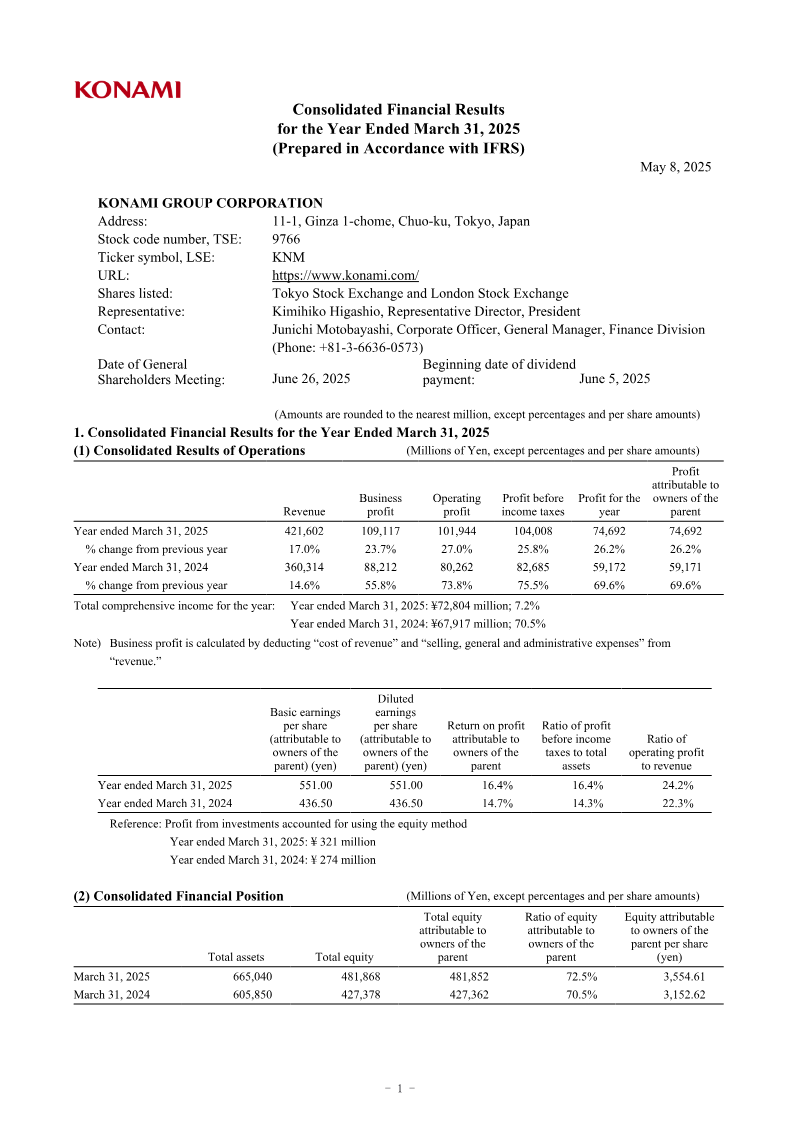
Konami · 2025

Nintendo · 2024
Bandai Namco · 2022

Bandai Namco · 2021

GREE · 2017

Bandai Namco · 2017
GREE Inc. · 2016
Bandai Namco · 2014
GREE · 2014