VideoTwo & a Half Gamers
📊 Creative Optimization Masterclass: All your ads in ONE Dashboard?!
16 Sept 202510 min video
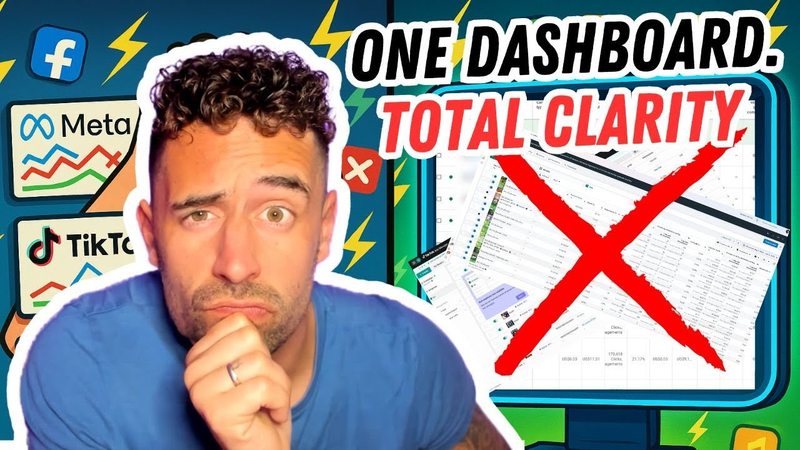
Once everything is in in one place, you start spoiling these patterns instantly. For example, this creative is performing slightly better in US than the rest then we have different kind of creatives broken down by a geo. So you know this one it does really well in US, UK and I would say even South Korea. This one definitely doing well in Germany and not the US that much. Mate drops knowledge made of golden ice with ads making those coins rise. Jack up designs worlds chasing the sky with the two and a half gamers the midnight crew talking UA adverts and game design too mate feel shaku bringing the insight we're rocking those vibes till the early day master eyes on the prize tracking data through the cyber space feels like a wizard in disguise crafting realms to the high and gamers talking smack slow got your backs are beautiful they click it fast don't delayh Uh-huh.
Uh-huh. Ah. Ah.
Hello. Hello. Hello. Welcome. This is Mate Ancharage and this is another solo episode. This time we're looking at doing things slightly differently. And today I'm going to talk about creatives and creative optimization because your creatives across every channel. finally in one place. Ever felt like your ad reporting looks a little bit messy? Oh yeah, all the different dashboards. You got Meta dashboards, Google dashboard, Tik Tok dashboards, and somehow they never quite agree with each other. You see different numbers in different places and don't even get me started on the creative naming conventions. So today I'm going to show you how Appsar creative optimization tool brings all your creatives into one dashboard and why this is an actual and total superpower for UA managers like us. You
know as UA managers we live in dashboards and I've been spending so many minutes in dashboards in each of the channel. Then the creative split across platforms is like trying to watch Avengers movies in the wrong order. I mean sure you can do it but doesn't really make that much sense. So this is where the apps comes in. It centralizes all the creatives across all the networks into one single dashboard. You know, think of it as a command center for your ad strategy. And now we're going to look into the the actual dashboard and how does it look like. Here's the here's a peak how it works. So let's say we're running like some campaigns. I log in and immediately I see all the creatives across all the all the different networks. I mean we have the the creative type by installs but if I scroll down here I have all as I mentioned all the creatives across different networks with all the numbers campaign names and all the different
KPIs. Obviously we don't only look at the installs but we also look at the revenues. So we can customize the columns and go into the metrics because what I'm really interesting in obviously Ross on day zero, Russ on day one, day three, day seven and ideally also day 30 because we want to know how the the creatives performance improves over time because that is very important. It's very important. That's what we always care about. So uh you know we can see all the different creatives the UGC stuff we can see different game plays and then everything else like how they perform in the last seven days. What's interesting also is that we can actually change the creative type instead of looking into the video images and carousels. We can go and pick the actual creative and the creative name. So you can go and drink the performance by day by day. And also, you know, as I mentioned, the the CTRs, installs and
ROI, everything is here. But here's the interesting thing stuff. I mentioned the naming conventions and all of the all of the fun stuff around like the mess of the creatives. So up actually automatically groups creatives by what they are, not by whatever random file name we uploaded and used it. So this means if we run let's say this Uncle Ben video it's it's kind of grouped by all all the different UA channels that we used in the and also in the by creative name and also all the different Uncle Ben iterations that we have are going to be uh are going to be tied to this one. So because it's also tied by a similarity. So you can you know we can check the creative performance across different UA different metrics right so a different UI channels and different campaigns. So in this case this one is used on the Tik Tok we have others other creatives that are used across see uh different different campaigns and different UA channels. But what is really interesting in here is well
besides the fact that we have tutorials in uh in the right hand side and right hand corner where we can also check like what what we can do with the dashboard the ad fatigue you usually hits hard and you know quite important to measure. So here's something that every U measures always felt you know like your best creative is slowly turning into the dead weight and the apps are actually create uh attracts creative age and also that the creative fatigue. So but what we what we should do to actually measure this and like how we can go about it. So here in the grouping in the middle section we have last seven days two different creatives. We add the CTR in this case and then obviously we will also want to add the CPI metric in here as well. And what it does it actually shows us the the spend by the creative, the CTR by the creative and the CPI by the creative. So as soon as it loads then then we'll have three different tabs in here right here. So we see the Galactus video was kind of going up
today. It's not full day but still we can see since the let's say August 30 the CTR is going down. So if this trend continues and I'm I'm going to just check it in here. If this trend continues that's the signal for us to be thinking about a creative refresh. Is this ad getting old? Yep. Time to refresh it. And uh you know uh you can clearly see it in here. It kind of gets you the early warning as as well. So you don't really need to watch basically all the different channels. This is kind of even though this was our best performing creative back in the in the days. The clear sign of dropping the CTRs and then increasing the CPI means that we need to definitely refresh and and think about what can be done in here. Besides the the actual creative fatigue and uh and all of the different KPIs that we we can check, we can group by different things. creative similarities, end cards, geos, channels, sources and all the other stuff. So if we go to geo then uh we can
also check uh what kind of geos and the creatives are kind of working in a different geos. Anyway, so for example, you know, once everything is in in one place, you start spotting these patterns instantly. For example, this creative is performing slightly better in US than the rest. Then we have different kind of creatives broken down by geo. So, you know, this one it does really well in US, UK, and I would say even South Korea. This one definitely doing well in Germany and not the US that much. And then this one is only doing really well in in US, which is fine. But then then we have also this one which is uh working way better in Israel rather than just US and UK. So you can then kind of spot this immediately because people prefer this type of ad in Germany and not in the US and we can see that in seconds which is amazing. So let's let's kind of recap. An unified creative dashboard means one place where you can see all your creatives. No, she share
automatic grouping by content not by the names. Automatic grouping by like the similarity that we saw and it's like it easy cross network and geo comparisons like we saw now and this detections you know where you need to refresh the creatives. So basically this means we can spot winning formats faster, adapt the strategy upper region as well and uh you know refresh creatives as soon as they tank. So for you this means saving hours every week and making kind of data back decisions with uh without the kind of a headache, right? And if you want to try this dashboard for your own campaigns, go for it. And also show this to your creative team because they will definitely benefit from from this dashboard. usually share this with my creative motion designers and the whole creative team. So, we don't really need to play this game why this creative doesn't work. They can they can saw it by their own eyes in this dashboard. If you find this breakdown useful, give this video a thumbs up and subscribe.
Share your comments in the comment section. And I got more deep dives coming including how AI tagging reveals um your winning creatives and way more. Thank you very much. And remember in UA the data is your superpower and this dashboard is definitely your ultimate power up. See you next time guys. Thank you very much. Bye-bye. [Music] [Music] [Music] [Applause] Heat. Heat. [Music]
Auto-generated captions from YouTube — names and numbers may be misheard.
Distilling the key insights…
The primary challenge for User Acquisition (UA) managers in the mobile gaming industry is the fragmentation of performance data across multiple advertising networks, such as Meta, Google, TikTok, and AppLovin. Disparate naming conventions and inconsistent reporting metrics across these platforms create significant operational friction, making it difficult to identify high-performing creative assets or detect early signs of ad fatigue. The central thesis is that unifying creative performance data into a single, automated command center allows UA teams to move beyond manual reporting, enabling faster decision-making and more efficient creative refresh cycles.
The core functionality of modern creative optimization tools involves automatically grouping assets based on visual similarity rather than inconsistent file names. By centralizing data, managers can track key performance indicators—including Click-Through Rates (CTR), Cost Per Install (CPI), and Return on Ad Spend (ROAS) from day zero through day 30—across all networks and geographic regions simultaneously. This aggregation allows for the immediate identification of regional performance nuances, such as specific creative formats resonating more strongly in Germany versus the United States or South Korea.
A critical finding is the ability to detect creative fatigue through automated trend analysis. By monitoring the correlation between declining CTRs and rising CPIs, the dashboard provides early-warning signals that an asset has reached its performance limit, signaling the need for a creative refresh. This data-driven approach saves significant time for UA managers and provides creative teams with objective evidence regarding why specific assets are underperforming. Ultimately, the integration of cross-network and cross-geo analytics transforms creative strategy from a manual, fragmented process into a streamlined, data-backed operation, empowering teams to scale winning formats and minimize wasted advertising spend.

Two & a Half Gamers · 2026

Two & a Half Gamers · 2026

Two & a Half Gamers · 2026

Two & a Half Gamers · 2026

Two & a Half Gamers · 2026

Two & a Half Gamers · 2026

Two & a Half Gamers · 2026

Two & a Half Gamers · 2026

Two & a Half Gamers · 2026
Two & a Half Gamers · 2026

Two & a Half Gamers · 2026

Two & a Half Gamers · 2026

Two & a Half Gamers · 2026
Naavik · 2026

Two & a Half Gamers · 2026

Two & a Half Gamers · 2026
Two & a Half Gamers · 2026

Two & a Half Gamers · 2026
Deconstructor of Fun · 2026

Two & a Half Gamers · 2026

Two & a Half Gamers · 2026

Deconstructor of Fun · 2026
Two & a Half Gamers · 2026
Two & a Half Gamers · 2025
Comments