VideoTwo & a Half Gamers
Creative optimisation 101: Creative chaos solved by Matej Lancaric
29 Oct 202522 min video
Once everything is in in one place, you start spoiling these patterns instantly. For example, this creative is performing slightly better in US than the rest then we have different kind of creatives broken down by a geo. So you know this one it does really well in US, UK and I would say even South Korea. This one definitely doing well in Germany and not the US that much.
[music]
drops knowledge made of golden ice with ads making those coins rise. Jack up designs worlds chasing the sky with the two [music] and a half gamers the midnight crew talking UA adverts and game design too mate feel shaku bringing the insight we're rocking [music] those vibes till the early daylight master eyes on the prize tracking data through the cyerspace [music] skies feels like a wizard in disguise crafting realms lift us to the high two and a half gamers talking smack slow hockey thick got [music] your backs are beautiful they like the way click it fast don't delayh Uh-huh.
Uh-huh. Aha. [music] Ah. Ah. [music]
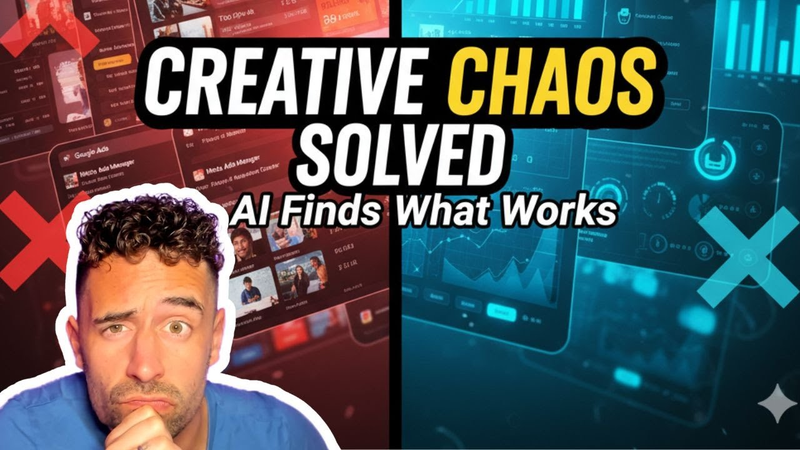
Hello. Hello. Hello. Welcome. This is Mate Ancharage and this is another solo episode. This time we're looking at doing things slightly differently. And today I'm going to talk about creatives and creative optimization because your creatives across every channel. finally in one place. Ever felt like your ad reporting looks a little bit messy? Oh yeah, all the different dashboards. You got Meta dashboards, Google dashboard, Tik Tok dashboards, and somehow they never quite agree with each other. You see different numbers in different places and don't even get me started on the creative naming conventions. So today I'm going to show you how Appsar creative optimization tool brings all your creatives into one dashboard and why this is an actual and total superpower for UA managers like us. You
know as UA managers we live in dashboards and I've been spending so many minutes in dashboards in each of the channel then the creative split across platforms is like trying to watch Avengers movies in the wrong order. I mean sure you can do it but doesn't really make that much sense. So this is where the apps comes in. It centralizes all the creatives across all the networks into one single dashboard. You know, think of it as a command center for your ad strategy. And now we're going to look into the the actual dashboard and how does it look like. Here's the here's a peak how it works. So let's say we're running like some campaigns. I log in and immediately I see all the creatives across all the all the different networks. I mean we have the the creative type by installs but if I scroll down here I have all as I mentioned all the creatives across different networks with all the numbers campaign names and all the different
KPIs. Obviously we don't only look at the installs but we also look at the revenues. So we can customize the columns and go into the metrics because what I'm really interesting in obviously Ross on day zero, Russ on day one, day three, day seven and ideally also day 30 because we want to know how the the creatives performance improves over time because that is very important. It's very important. That's what we always care about. So uh you know we can see all the different creatives the UGC stuff we can see different game plays and then everything else like how they perform in the last seven days. What's interesting also is that we can actually change the creative type instead of looking into the video images and carousels. We can go and pick the actual creative and the creative name. So you can go and drink the performance by day by day. And also, you know, as I mentioned, the the CTRs, installs and
ROI, everything is here. But here's the interesting thing stuff. I mentioned the naming conventions and all of the all of the fun stuff around like the mess of the creatives. So up actually automatically groups creatives by what they are, not by whatever random file name we uploaded and used it. So this means if we run let's say this Uncle Ben video it's it's kind of grouped by all all the different UA channels that we used in the and also in the by creative name and also all the different Uncle Ben iterations that we have are going to be uh are going to be tied to this one. So because it's also tied by a similarity. So you can you know we can check the creative performance across different UA different metrics right so different UI channels and different campaigns. So in this case this one is used on the Tik Tok we have others other creatives that are used across see uh different different campaigns and different UA channels. But what is really interesting in here is well
besides the fact that we have tutorials in uh in the right hand side and right hand corner where we can also check like what what we can do with the dashboard the ad fatty usually hits hard and you know quite important to measure. So here's something that every UA managers always felt you know like your best creative is slowly turning into the dead weight and the apps are actually create uh att tracks creative age and also that the creative fatigue. So but what we what we should do to actually measure this and like how we can go about it. So here in the grouping in the middle section we have last seven days two different creatives we add the CTR in this case and then obviously we will also want to add the CPI metric in here as well. And what it does it actually shows us the the spend by the creative the CTR by the creative and the CPI by the creative. So as soon as it loads then then we'll have three different tabs in here right here. So we see the Galactus video was kind of going up
today. It's not full day but still we can see since the let's say August 30 the CTR is going down. So if this trend continues and I'm I'm going to just check it in here. If this trend continues that's the signal for us to be thinking about a creative refresh. Is this ad getting old? Yep. Time to refresh it. And uh you know uh you can clearly see it in here. It kind of gets you the early warning as as well. So you don't really need to watch basically all the different channels. This is kind of even though this was our best performing creative back in the in the days. The clear sign of dropping the CTRs and then increasing the CPI means that we need to definitely refresh and and think about what can be done in here. Besides the the actual creative fatigue and uh and all of the different KPIs that we we can check, we can group by different things. creative similarities, end cards, geos, channels, sources and all the other stuff. So if we go to geo then uh we can
also check uh what kind of geos and the creatives are kind of working in a different geos. Anyway, so for example, you know, once everything is in in one place, you start spotting these patterns instantly. For example, this creative is performing slightly better in US than the rest. Then we have different kind of creatives broken down by geo. So, you know, this one it does really well in US, UK, and I would say even South Korea. This one definitely doing well in Germany and not the US that much. And then this one is only doing really well in in US, which is fine. But then then we have also this one which is uh working way better in Israel rather than just US and UK. So you can then kind of spot this immediately because people prefer this type of ad in Germany and not in the US and we can see that in seconds which is amazing. So let's let's kind of recap. An unified creative dashboard means one place where you can see all your creatives. No, she share
automatic grouping by content not by the names. Automatic grouping by like the similarity that we saw and it's like easy cross network and geo comparisons like we saw now and this detections you know where you need to refresh the creatives. So basically this means we can spot winning formats faster, adapt the strategy upper region as well and uh you know refresh creatives as soon as they tank. So for you this means saving hours every week and making kind of data back decisions with uh without the kind of a headache, right? And if you want to try this dashboard for your own campaigns, go for it. And also show this to your creative team because they will definitely benefit from from this dashboard. usually share this with my creative motion designers and the whole creative team. So, we don't really need to play this game why this creative doesn't work. They can they can saw it by their own eyes in this dashboard. If you find this breakdown useful, give this video a thumbs up and subscribe.
Share your comments in the comment section. And I got more deep dives coming including how AI tagging reveals um your winning creatives and way more. Thank you very much. And remember in UA the data is your superpower and this dashboard is definitely your ultimate power up. We are going to talk about AI and the secret DNA of winning ads. Every UA manager asks the same question. Why did this create work? Was it because of the humor? Is it the game play? Is it the voice over? Or maybe it's just, you know, Deadpool breaking the fourth wall again. I will show you how upslier creative optimization tool uses AI tagging to break down your creatives into their DNA. You will see exactly what elements drive with performance, which creatives, which scenes, so all of it. Let's dig in. Here's the thing. Most of us track installs, CTRs, IPMs, and obviously ROS as well. But we rarely
know why creative work. We need to be honest with ourselves. For example, you run two ads. One is cinematic CGI trailer. One is very, you know, goofy UGC reaction or the street interviews, the UGC or the street interview ad wins. But why do you know why was it because of the humor? Because of the shorter runtime, the fact that it showed gameplay in the first few seconds without tagging? We don't know. We're guessing. And guessing is not the great strategy, is it? So, this is where the AI powered tagging saves the day. And uh you know, here's the Marvel Snap campaign in the dashboard. the system automatically tags the creatives. No more manual spreadsheets. So, let me actually share the screen. So, here is the the Marvel Snap campaign or the the creatives that I have in all of the campaigns in the dashboard system. Automatically tax each creative. No more spreadsheets and manual checkings. Check out all these examples. So, we have some pre preloaded tags with all the different things in here. The AI is
literally dissecting your ads frame by frame. So you can compare performance by creative elements, scenes, and text, not by file names as we discussed. So let's let's look at the elements for example here. We can try all of the different things. Okay, let's try the the actual power of the the search and and grouping in uh in this case. So now here's the magic. You can search and group the creatives by whatever you want, right? By the creative tags. So, let's say I want to know ads with Galactus. Did they perform better than Deadpool? Let's see. So, we have all the Galactos creatives with one clicks. Just filter by Galactus. Then suddenly I've got a clean view and list of every ad in this category with obviously with all costs, IPM, CTRs, the the ROS day seven or whatever K other KPI I want because it's fully customizable. Now let's try
actually videos with real people. Okay, it's all of the real people right here. Different things which is nice. Let's actually go one step further. Videos with Ben Ro cuz uh historically this worked really well. Ben brought only. Oh, hello. Nice. All the videos in the last seven days. Let's try last 30 days and see if the the videos went with Ben Bro actually are there. Oh yeah, all the video videos with Ben Bro, this is also with with Ben are here. Nice. Okay, this is pretty cool. Let's check out also the scenes and elements afterwards as well. So what do we have here? Scenes. Let's try live scenes. Okay. All the videos or like all the scenes with people in the in the actual situation. Awesome. This is used in one creative. This one is used in four creatives out of 100. This is in two. So you can see all the all
the different KPIs obviously. Then we can go to elements and let's try to find videos only with Spider-Man. Here you go. All the elements in here. Spider-Man cards. This is a video with Spider-Man as well in inside. And we can go to text as well and try to take try to find different different texts, right? It's it's right here. Uncle Ben strategies g whatever you can think think of carnage. Here we are. Nice. Okay. But then what are you going to do with this knowledge? Well, easy. you stop relying on gut feeling and start actually building creatives based on these patterns. So if your top three ads are let's say gameplay or fastpace, you tell your creative team that you know guys like let's make more of these. Or you have the Uncle Ben which is which is working well or the the Galactus with like how people react to the Galactus cards and you know you go and check check this with your creative team. Tell them let's let's make more of these Galactus reactions. Or you can flip it if your
bottom performers are, let's say, static text heavy statics or we have two cards just text here. Yeah, you know, let's not bake these anymore. Unless you you want to waste your budget. I mean, it's it's up to you, right? It's almost like finding out explosions really do equal conversions. Who knew? I mean, jokes aside, you can recap the the power of AI tagging because it's automatically also break down your creatives into the DNA level tags. You can filter and compare ads by tone, style, format or concept or different scenes and elements. So you finally learn why your best ads work and why some fall as well. So what do you know what works for you? It could be humor, it could be UGC or even just the right voice over style or captions or different texts. So, if you want to see your own ad DNA, check out the the creative optimization tool in your App Slider dashboard and don't forget to subscribe, like the video. Next up, we
will look at how to tie creatives directly to your inapp events and ROS, which is very, very important. Remember, in UA sites are your X-ray vision with AI tagging. Basically, Professor X of ad strategy. What if I told you that I'm going to talk about creative ROI and scaling across different networks? So, here's the truth. Not all installs are created equally. Some users install the game, they open once and vanish. Either stick pen and become your payers or whales. So I will show you how upsider creative optimization tool corrects each and every creative not just installs but also retention and most importantly ROI as well. All the inapp events you can think of. Let's use Marvel Snap ads to see why some of the players bring only installs and some of the players
actually bring revenue. So we have two ads. one ad brings,000 installs and one ad brings 700 installs. But what what we are looking at here looking at the great conversion rate or CTR or just the install just uh spent well there's more obviously is the CPI really important maybe maybe not most of the dashboards would say okay so we have low lower CPI in here the that should be the winner but it's not the only thing that we we care about is it no it's not uh because I want to always know what's the quality of the users on the creative level. So here we are uh looking at uh the e level 18 we can have a level whatever else we can have a level 13 level 18 obviously the number of purchases what's the cost per action or the cost per purchase here and most importantly the the ROI because you know we're looking at the long-term row numbers rather than just installs what
if I told you that right but I mean you're already looking at the creative level ROAS Right. So here's how the dashboard makes it super super easy and very clear. I select in here multiple different KPIs because you can you can use the different metrics. Obviously you can have draws 14 or inapp events level three level five tutorial completion level level 15 whatever else that you can you can track. Uh also the the different partner metrics it doesn't matter. and just hit apply and then you will have all of these inside your creative table. So yeah, amazing, right? So the tool lets me slice it by any inapp events as I mentioned level 15 purchasers and even like any other milestones. So you can actually judge creatives by what matters to the business, not just clicks or installs or conversion rate or the CPIs. The most
important part is the CPI needs to be all lower than the LTV. And that's that's how we measure the creative success. Again, what's happening here? Instead of the the chasing the cheap CPIs, you prioritize the creatives with high value players, which also bridges the the UA and the product teams. So, imagine telling your designers, you know, uh this can creative and it's getting installs, but actually Galactus right here is actually getting pairs. So, let's make more of these. Suddenly your creative strategy aligns with the lifetime value, not the vanity metrics like installs. Not the not that bad, right? But there's another question. How many hours do you waste every week pulling the creative reports for the team? Be honest. What if instead of just exporting all of the spreadsheets, you can actually spend time brainstorming and brainstorming the next winning creative? Well, look, you have all of I already started sharing this at the very beginning. Slayer helps you scale across also different networks and make UA
creative collaboration very smooth. So you don't really need to ask a lot of different questions. You just share the dashboards with your creative team. So let's say right now for Marvel Sniper run only mostly Facebook, Tik Tok and Google. But next quarter I want to scale up login or Mo or whatever else. Normally that means new workflows and sometimes new headaches. But with apps it's quite seamless. So the dashboard pulls all the the new networks as soon as you integrate them in the integration section and matches them with the creative well the existing creatives in one unified view. So no matter the ch channel your creatives are tracking consistently which is future proof. Look here we have the Facebook ads. If we click on here go here Facebook and Tik Tok at the moment. Here this one also it's running on Facebook and Tik Tok. So when I add up loavian mo or everything else then it's going to be another UI channel which says Apple. So quite quite
interesting. So now the collaboration the UI managers and motion designers all of them live in the different universes but with this creative gallery view you can see the same thing the actual thumbnails right here performance metrics and you can even play the ad right here in the dashboard. So in a team meeting instead of debating and you can say you know here's the top top ad which is the galacus and look at the first 5 seconds that's what's working. Let's do let's do more of that. So no more endless requests for like hey can you send me the performance by theme by hook and whatever else the data is actually live and it's always ready in here. So let's recap. Uh scaling to new networks, zero extra hustle. Teams finally speak the same language with creatives and metrics side by side. You can you can see it all in dashboard. So uh more time for brainstorming sessions.
Also instas are nice. The retention tell the real story. Ros is all that matters. AppSlider links the creatives uh links creatives directly to inapp events so you know which ad deliver delivers the the best quality players and which ads deliver the best rows. You don't always optimize for volume. You always optimize for value aka ROAS. So for Marvel Snap, this means the UA and creative teams can sit down, see the same insights and plan the next campaign together. If you're ready to ditch the reporting hell and spend more time building ads, hit the link in the in the show notes, book the demo with Absler. Don't forget, subscribe for more UA insights because this in this business, collaboration is an optional. It's your competitive edge. Thank you very much for listening. See you next time. [music] Bye-bye. Heat. Heat.
Auto-generated captions from YouTube — names and numbers may be misheard.
The provided content outlines a modern approach to creative optimization in mobile user acquisition (UA), emphasizing the transition from manual, spreadsheet-heavy reporting to automated, data-driven decision-making. The primary thesis is that while AI has democratized ad creation, the true competitive advantage lies in identifying which specific creative elements drive high-quality users and long-term profitability. By centralizing data from disparate networks—such as Meta, TikTok, Google, and AppLovin—into a unified dashboard, UA managers can move beyond vanity metrics like install volume to focus on Return on Ad Spend (ROAS) and user lifetime value.
Key findings highlight that creative fatigue is a critical performance killer, which can be mitigated by tracking creative age and performance trends to trigger timely refreshes. The methodology centers on AI-powered tagging, which dissects advertisements frame-by-frame to categorize them by DNA-level elements such as specific characters, themes, scenes, or text. This granular analysis allows teams to move away from gut-feeling decisions, enabling them to double down on high-performing concepts—such as specific gameplay hooks or influencer-led content—while cutting spend on underperforming assets.
The scope of this approach covers the entire mobile gaming industry, focusing on the intersection of UA, game design, and ad monetization. By aligning creative teams with performance data, organizations can bridge the gap between creative production and business outcomes. The ultimate conclusion is that data serves as a strategic "superpower," where the ability to correlate specific creative attributes with in-app events and revenue milestones allows for more efficient scaling, reduced wasted spend, and improved cross-team collaboration.
Two & a Half Gamers · 2026
Two & a Half Gamers · 2026

Two & a Half Gamers · 2026
Two & a Half Gamers · 2026
Two & a Half Gamers · 2026
Two & a Half Gamers · 2026
Two & a Half Gamers · 2026

Two & a Half Gamers · 2026
Two & a Half Gamers · 2026
Two & a Half Gamers · 2026
Two & a Half Gamers · 2026
Two & a Half Gamers · 2026
Naavik · 2026
Two & a Half Gamers · 2026
Two & a Half Gamers · 2026
Two & a Half Gamers · 2026
Two & a Half Gamers · 2026
Two & a Half Gamers · 2026
Two & a Half Gamers · 2026
Deconstructor of Fun · 2026
Deconstructor of Fun · 2026
Two & a Half Gamers · 2026
Deconstructor of Fun · 2026
Two & a Half Gamers · 2026
Comments