Reports in the Market (Overall) category.
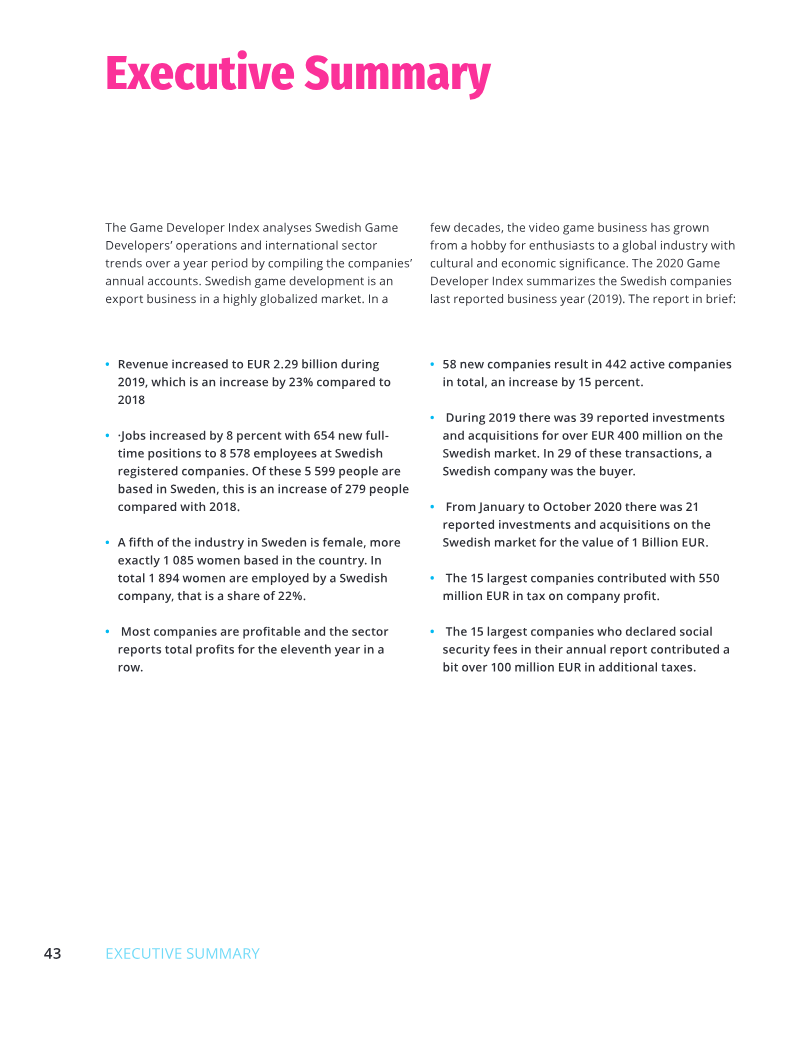
The Swedish game development industry demonstrates robust economic expansion and sustained profitability, functioning as a highly globalized export sector. By analyzing annual accounts from Swedish-registered companies, the industry reports a significant revenue increase to EUR 2.29 billion in 2019, representing a 23 percent growth over the previous year. This marks the eleventh consecutive year of total sector profitability, supported by a 15 percent increase in the number of active companies, which reached 442 by the end of 2019.
Employment trends reflect this upward trajectory, with the workforce growing by 8 percent to a total of 8,578 full-time positions. Of these, 5,599 employees are based within Sweden. While the industry continues to scale, gender diversity remains a focal point, with women comprising 22 percent of the total workforce. The sector’s economic impact extends to significant tax contributions, as the 15 largest companies alone provided EUR 550 million in corporate profit taxes and over EUR 100 million in additional social security fees.
Investment activity highlights the industry's maturity and attractiveness to capital. During 2019, the market saw 39 transactions involving investments and acquisitions totaling over EUR 400 million, with Swedish firms acting as the primary buyer in the majority of cases. This momentum accelerated into 2020, with 21 transactions recorded between January and October valued at EUR 1 billion. Despite these successes, the industry identifies ongoing challenges, particularly regarding the access to specialized talent and the navigation of complex digital market regulations. Future growth is expected to rely on regional clusters, incubators, and a continued commitment to increasing workforce diversity to maintain global competitiveness.
This analysis examines global investment and merger and acquisition (M&A) activity within the video game industry from 2020 through 2022. The primary thesis posits that the industry has passed a historic peak of deal-making and is now entering a "Great Reset" characterized by market cooling, lower valuations, and a shift in investor priorities. While the era of massive public offerings and late-stage venture capital (VC) surges has slowed due to macroeconomic headwinds like inflation and rising interest rates, the industry remains fundamentally strong with significant "dry powder" available for early-stage startups and strategic consolidations.
The data reveals a volatile three-year cycle. M&A activity reached a zenith in 2022 with $37.7 billion in closed deals—a 199% increase in value from 2021—driven by massive consolidations such as Take-Two’s acquisition of Zynga. Conversely, public offerings plummeted by 82% in 2022 as the IPO and SPAC windows effectively closed. Private investments also saw a 16% decline in value in 2022 after doubling the previous year. Despite these drops, early-stage VC remained resilient, with over $6.2 billion raised by gaming-focused funds ready for deployment.
Geographically and segmentally, the scope is global, with specific attention paid to the decline of mobile gaming hype post-IDFA and the rising interest in PC, console, and AI-driven startups. The report highlights a stark cooling in Web3 gaming, where investor "FOMO" has been replaced by a focus on fundamental gameplay and infrastructure. Gender diversity remains a challenge in the sector; 89% of funded or acquired companies were led by men in 2022, a negligible change from 90% in 2021.
Methodologically, the findings are based on tracked closed transactions across video game publishers, developers, and hardware providers. Data was aggregated from public media, S&P Capital IQ, and partner insights, utilizing a weighted ranking system to identify the most active investors. The analysis concludes that while the "peak wave" has passed, the industry is transitioning into a more disciplined phase of the investment cycle.
The 2020 Global Games Market Report provides a comprehensive analysis of the video game industry during a landmark year defined by the COVID-19 pandemic and the transition to next-generation consoles. The central thesis posits that gaming has evolved beyond simple entertainment to become a primary social network and a precursor to the "metaverse," with interactive virtual spaces increasingly replacing traditional social media for younger generations.
Key findings indicate that the global games market was projected to generate $159.3 billion in 2020, representing a 9.3% year-on-year increase. Mobile gaming remained the largest segment, accounting for $77.2 billion (48% of the market), driven by low barriers to entry and the rise of hypercasual titles. Console and PC segments followed with $45.2 billion and $36.9 billion respectively. Geographically, the Asia-Pacific region dominated the landscape, generating $78.4 billion—nearly half of all global revenues—while the Middle East and Africa emerged as the fastest-growing region. By the end of 2020, the global player base was expected to reach 2.7 billion, with forecasts suggesting the market would surpass $200 billion and 3 billion players by 2023.
The scope of the analysis covers 30 key markets representing over 90% of global revenues, with data segmented by region (Asia-Pacific, North America, Europe, Latin America, and Middle East/Africa) and platform. Methodology relies on a top-down predictive model integrating macroeconomic data, financial reports from over 100 public companies, and primary consumer research involving 62,500 respondents.
The report concludes that while lockdown measures provided a short-term surge in engagement and revenue, the industry faces long-term shifts toward platform-agnostic cloud gaming and subscription models. Additionally, it highlights the successful globalization of Chinese gaming firms, which pivoted to international markets following domestic regulatory freezes, now leading the industry in mobile development and cross-border investment.
The tower defense sub-genre represents a high-performing segment within the casual arcade category, characterized by strong monetization potential and deep player engagement. Analysis of global mobile gaming data from 2020 reveals that tower defense titles significantly outperform related genres like platformers and idlers in key financial metrics. Specifically, the sub-genre boasts an Average Revenue Per Paying User (ARPPU) of $83 and an Average Revenue Per Daily Active User (ARPDAU) of $1.66. These figures are supported by a robust daily conversion rate of 3.83%, which is more than double that of board games.
Geographic performance varies across different engagement and monetization KPIs. Italy leads in Day 7 retention at 39%, while France records the highest average daily playtime at 210 minutes. However, China emerges as the most effective market for monetization, achieving a conversion rate of 8.7%, nearly double that of the United States. These statistics are derived from a massive dataset encompassing over 134,000 integrated games and 900 million unique monthly players, providing a granular view of the competitive landscape.
The success of the genre is attributed to its accessible core mechanics combined with high replayability. Developers leverage meta-features such as daily challenges, PvP options, and RPG elements to drive long-term retention. By introducing new characters or obstacles, studios can shift the game meta without the resource-heavy requirement of designing entirely new maps. Notable titles launched in 2020, such as Kingdom Wars Defense and Rush Royale, exemplify these trends by blending traditional defense mechanics with innovative strategy and merging elements to maintain high user ratings and market relevance.
The 2020 fiscal year marked a historic period of consolidation and capital infusion for the global video game industry, largely catalyzed by the COVID-19 pandemic and the resulting surge in at-home entertainment. Total deal value reached $33.6 billion across 664 transactions, encompassing mergers and acquisitions, private investments, and public offerings. The United States and China emerged as the primary geographical drivers, collectively representing 63% of the total deal value. The market demonstrated significant resilience, recovering from a stagnant first quarter to reach record-breaking activity levels in the second half of the year.
M&A activity was a primary pillar of this growth, totaling $12.6 billion across 219 deals. This sector was dominated by public strategic acquirers such as Tencent, Embracer Group, Stillfront, and Zynga, who accounted for 60% of the total M&A value. Private investment also reached new heights, with $5.9 billion raised through venture capital and corporate rounds, specifically targeting multiplatform developers and mobile studios. Public markets followed a similar trajectory; after a quiet start to the year, public offerings surpassed $15.1 billion, supported by high-profile IPOs from companies like Unity Software and Kakao Games, as well as significant fixed-income activity as firms moved to refinance debt at lower interest rates.
The analysis segments the industry into gaming, platform technology, and esports. While gaming remained the most active sector, platform and tech saw substantial late-stage investments in companies like Roblox and Epic Games. Looking forward, the industry is expected to see continued consolidation led by Nordic and Chinese firms, increased competition between traditional venture capital and large strategic investors, and a robust pipeline of IPO candidates. This data was compiled by tracking closed transactions across public media and financial databases, excluding pure gambling and betting entities to focus on the core video game ecosystem.
The global gaming industry is undergoing a generational transformation, evolving from a niche hobby into a pervasive cultural and economic force. This transition is characterized by a shift from traditional PC and console play toward a diversified ecosystem defined by mobile accessibility, free-to-play models, and the convergence of playing, watching, and social interaction. By 2022, the industry reached a state of "lifetime gamers," with a projected trajectory toward cross-market disruption by 2027.
Market data highlights the massive scale of this sector, with approximately 2.7 billion gamers globally and 1.3 billion spenders. The COVID-19 pandemic significantly accelerated this growth, leading to a $16 billion upward adjustment in 2020 revenue forecasts. Mobile gaming has emerged as the dominant segment, accounting for 49% of global consumer revenues. Furthermore, the rise of cloud gaming is expected to generate $4.8 billion in revenue by 2023, supported by major infrastructure plays from companies like Microsoft, NVIDIA, and Tencent.
Consumer behavior is also shifting, as evidenced by Newzoo’s segmentation which identifies diverse personas ranging from "Hardware Collectors" to "Backseat Viewers." Notably, 29% of enthusiasts do not rank playing as their primary interest, focusing instead on viewing or hardware. This engagement extends into new value chains, including in-game e-commerce—where players purchase physical goods directly through apps—and the integration of gaming with traditional media and travel industries.
The competitive landscape is defined by technological innovation and strategic content plays. While Sony emphasizes exclusive titles for its hardware, Microsoft focuses on subscription-based services. Simultaneously, the rise of esports and live-streaming has created new opportunities for celebrity engagement and music integration. As mobile esports viewership sees exponential growth on platforms like YouTube, the industry continues to blur the lines between casual and core gaming experiences, driven by global studios and empowered creator communities.
The European video games industry experienced steady growth in 2019, reaching a total market turnover of €21.6 billion. This represents a 3% year-on-year increase and a 55% rise since 2014 across key markets. Revenue is increasingly driven by digital ecosystems, with online and app-based income accounting for 76% of the market, while physical sales represent 24%. Within the online segment, 66% of revenue is generated through in-game extras and downloadable content. Console gaming remains the leading hardware category by revenue at 43%, closely followed by mobile and tablets at 40%.
Demographic data indicates that 51% of the European population aged 6 to 64 plays video games, with an average player age of 31. While engagement is highest among younger cohorts, 31% of those aged 45 to 64 are active players. Gender representation is nearly balanced, as women make up 45% of the player base and over half of all mobile gamers. On average, European players spend 8.6 hours per week gaming, significantly less than the time spent on social media or television.
The industry maintains a strong focus on responsible gameplay through the PEGI age rating system, which is active in over 35 countries. Approximately 67% of parents are aware of these labels, and 85% have established agreements with their children regarding in-game spending. Beyond consumer protection, the sector is expanding its educational footprint. Initiatives like the Games in Schools project, conducted with European Schoolnet, have trained over 4,000 teachers across 73 countries to integrate commercial games into pedagogical frameworks.
Data for these findings was primarily extrapolated from the 2019 GameTrack and Newzoo reports, utilizing surveys and sales tracking across major European territories including France, Germany, Italy, Spain, and the United Kingdom. The scope covers the 2019 calendar year while acknowledging the emerging impact of the COVID-19 pandemic on 2020 industry trends.
The 2018 Gaming Spotlight Review analyzes the global gaming landscape, focusing on the shifting dynamics between mobile, PC, and console platforms. The report establishes that mobile gaming has solidified its dominance, with consumer spending in 2018 exceeding the combined totals of home consoles, PC/Mac, and handheld consoles by nearly 20%. This represents a significant shift from 2016, when mobile spending trailed these combined categories by 14%. The analysis covers global markets with specific emphasis on North America, Asia-Pacific, and Western Europe, utilizing consumer spend data from app stores and retail tracking.
A primary finding is the maturation of mobile gaming into a platform for sophisticated, hardcore experiences. While games accounted for only 35% of total app downloads, they generated 75% of total consumer spend on the iOS App Store and Google Play. The market is increasingly bifurcated between hyper-casual titles that monetize through advertising and hardcore-leaning multiplayer games. In 2018, three of the top five grossing mobile games featured real-time multiplayer elements, such as Battle Royale and MOBA mechanics, reflecting a trend where mobile experiences now rival traditional console and PC gameplay.
Geographically, the Asia-Pacific region remained the leader, accounting for over 55% of global mobile game spending despite a nine-month freeze on new game approvals in China. In North America, the Nintendo Switch drove strong home console performance, while the handheld market faced contraction as franchises like Pokémon migrated from the Nintendo 3DS to more modern platforms. Methodologically, the report compares 2018 data against historical benchmarks from 2014–2017 and incorporates a 2018 survey of U.S. gamers, which revealed a 3.5% increase in hardcore-leaning players compared to 2015. The conclusion highlights that publishers with PC or console backgrounds are increasingly dominant in mobile monetization, holding seven of the top ten spots for consumer spend.
This analysis examines the ten-year trajectory of the Google Play Store, detailing its growth from January 2012 through August 2018. During this period, the platform facilitated nearly 330 billion downloads and generated over $85 billion in consumer spend. By August 2018, the ecosystem supported over 2.8 million available apps, with more than 5,000 individual titles surpassing $1 million in lifetime consumer spend. The findings exclude pre-installed applications and focus on worldwide performance, excluding China.
Geographic data reveals a significant divide between volume and monetization. India leads the world in total downloads with 36.9 billion, followed closely by the United States and Brazil. However, Japan represents the largest market by consumer spend, contributing $25.1 billion, which significantly outpaces the United States at $19.3 billion and South Korea at $11.2 billion. This revenue growth was heavily influenced by the 2012 introduction of in-app subscriptions and a 2017 policy change that reduced developer transaction fees for long-term subscribers, resulting in a 55% year-over-year increase in spend between 2016 and 2017.
The gaming sector remains a primary driver of engagement and revenue. Subway Surfers and Candy Crush Saga are identified as the most downloaded games of all time, while Monster Strike and Puzzle & Dragons lead in total consumer spend. Outside of gaming, Facebook-owned properties dominate the download charts, while communication and entertainment apps like LINE, Tinder, and Netflix lead in revenue. The analysis concludes with a forecast that Google Play consumer spend will reach $42 billion by 2022, representing a 90% increase from 2017 levels, driven by the continued evolution of video streaming, social platforms, and subscription-based monetization models.
The global gaming industry experienced a significant shift in 2017 as mobile gaming solidified its dominance over traditional platforms. Mobile consumer spending exceeded the combined total of home consoles, PC, Mac, and handheld consoles by more than one-third, representing a substantial increase from the single-digit margin recorded in 2016. While games accounted for less than 40% of total mobile app downloads, they generated nearly 80% of combined consumer spend on the iOS App Store and Google Play. This growth was primarily driven by the Asia-Pacific region, particularly China, Japan, and South Korea, which accounted for over 60% of all mobile game spending.
A critical trend identified throughout the year was the rise of live player-versus-player (PvP) and cooperative gameplay. For the first time in mobile history, the top two grossing games on both major app stores featured live PvP elements, a shift influenced by PC gaming heritage and the rising popularity of esports. In the United States, survey data from 3,991 gamers revealed that those engaging in live PvP or co-op modes skewed younger and male, played more hours per week, and were significantly more likely to spend money on titles compared to those playing single-player or turn-based games.
The handheld console market also reflected this shift toward multiplayer engagement, with four of the top five grossing titles supporting live PvP or co-op. Despite the continued strength of the Nintendo 3DS in 2017, the industry began transitioning toward hybrid and mobile platforms, evidenced by major franchises like Pokémon moving away from dedicated handhelds. Analysts concluded that the maturation of live multiplayer engagement, bolstered by the emergence of the battle royale genre, would remain the primary driver for industry growth and monetization moving into 2018.
This analysis examines the growth and performance of the Google Play Store over a nearly seven-year period, spanning from January 2012 to August 2018. Utilizing data from the App Annie platform, the findings track the evolution of the Android ecosystem from its early stages to a mature marketplace featuring over 2.8 million available apps. During this timeframe, the platform recorded nearly 330 billion total downloads and generated over $85 billion in consumer spend, with more than 5,000 individual apps surpassing the $1 million revenue milestone.
Geographic trends reveal a significant divide between volume and value. India leads the world in total downloads at 36.9 billion, followed closely by the United States and Brazil. However, Japan emerges as the most lucrative market, contributing $25.1 billion in consumer spend, significantly outpacing the United States and South Korea. The data highlights a shift in monetization strategies, particularly the 2017 transition toward in-app subscriptions. This change, supported by a reduction in Google’s transaction fees for long-term subscribers, resulted in a 55% growth in spend for non-gaming apps between 2016 and 2017.
The competitive landscape is dominated by major social media and gaming entities. Facebook-owned properties occupy the top four spots for all-time downloads, while LINE and Tinder lead in non-gaming consumer spend. In the gaming sector, Subway Surfers is the most downloaded title, but GungHo Online’s Puzzle & Dragons and Mixi’s Monster Strike lead in total revenue. Looking forward, the analysis projects continued aggressive growth, estimating that annual consumer spend on Google Play will reach $42 billion by 2022, a 90% increase from 2017 levels.