Ugc
5 documents·6 publishers
Documents

Report9 pages
Where the UGC Dollars Flow: Mapping $9B Investments in Creator Economy
The analysis maps a $9 billion investment wave in user‑generated content (UGC) gaming from 2020 to 2025, covering roughly 80 companies and titles. Early‑stage rounds (pre‑seed to Series A) account for $0.5 billion, while late‑stage and corporate deals bring the total to $8.9 billion, including major platform names such as Roblox, Epic Games (Fortnite), Linden Lab, and Sandbox. Corporate venture capital and strategic investors contribute $3.5 billion, with notable commitments from Sony/Kirkbi ($2 billion in 2022) and Disney ($1.5 billion in 2024). Modding ecosystems—overwolf, mod.io, CurseForge—receive $0.4 billion in VC or M&A activity.
The report tracks engagement metrics, noting Roblox’s 73.5 billion logged hours in 2024 and a peak concurrent user base of 21 million, while Fortnite Creative stabilizes around 1.3 million concurrent users. Creator payouts have risen sharply, with Roblox and Fortnite together disbursing approximately $1.5 billion to developers in 2024, and quarterly earnings showing a 38 % increase from Q2 23 to Q3 23.
Funding follows a classic hype cycle: an initial surge during Roblox’s IPO and metaverse buzz (2020‑21), a pullback in 2022, and renewed strategic investment from incumbents in 2023‑24. Early‑stage rounds remain steady, averaging 12–15 deals per year, targeting “next Roblox/Fortnite” platforms and infrastructure. The largest early‑stage investments include $50 million raised by YAHAHA in 2020 and multiple $15–40 million Series A rounds for platforms such as ZAllbaba, Manticore, and Lighforge.
Overall, the data illustrate a mature UGC ecosystem that has evolved from hobbyist modding to professionalized creator economies, with sustained capital inflows and growing monetization pathways for both platforms and individual creators.
- The UGC gaming sector attracted $9 billion in total investment between 2020 and 2025, with $8.9 billion concentrated in late-stage and corporate deals.
- Strategic investment from industry incumbents is a primary driver, highlighted by Sony/Kirkbi’s $2 billion commitment in 2022 and Disney’s $1.5 billion investment in 2024.
- Creator monetization is scaling rapidly, with Roblox and Fortnite collectively disbursing approximately $1.5 billion to developers in 2024 and reporting a 38% quarterly earnings increase between Q2 and Q3 2023.
- Roblox remains the dominant platform with 73.5 billion logged hours in 2024 and 21 million peak concurrent users, while Fortnite Creative maintains a stable base of 1.3 million concurrent users.
- Early-stage funding remains consistent at 12–15 deals per year, focusing on infrastructure and platforms attempting to replicate the success of established leaders like Roblox and Fortnite.
+3
InvestGame
Report26 pages
Video Gaming Report 2025: How Platforms Are Colliding and Why This Will Spark the Next Era of Growth
The global video game industry is currently emerging from a three-year period of stagnation, transitioning toward a future defined by platform convergence and hardware-agnostic ecosystems. The traditional era of console-centric competition is being replaced by a multiplatform landscape where success is increasingly dictated by community engagement, user-generated content, and discoverability. This structural shift is underpinned by the integration of generative AI, the expansion of cloud gaming, and the diversification of distribution channels, which collectively aim to move the industry beyond the limitations of legacy hardware.
Cloud gaming is projected to reach $18.3 billion in revenue by 2030, serving as a primary catalyst for this growth. However, this transition introduces significant challenges, most notably the risk of market saturation caused by an influx of low-quality, AI-generated content. To maintain profitability and relevance, developers are pivoting toward direct-to-consumer monetization strategies, including tiered pricing models, windowing, and the integration of in-game advertising. These tactics are designed to capture value from a increasingly price-conscious global player base while navigating a shifting regulatory environment.
The dominance of incumbent app stores is simultaneously being challenged by the rise of developer-owned webstores and alternative distribution platforms. While these new channels offer the potential for improved margins and deeper player relationships, their long-term viability depends on the industry’s ability to address consumer concerns regarding security and platform convenience. Ultimately, the next era of growth will be defined by the ability of stakeholders to balance technological innovation with the necessity of fostering sustainable creator economies, ensuring that discoverability remains the central pillar of the modern gaming experience.
- Cloud gaming is projected to reach $18.3 billion in revenue by 2030, acting as a primary driver for industry growth as the market moves toward hardware-agnostic ecosystems.
- The industry is shifting from console-centric competition to a multiplatform model where success depends on user-generated content, community engagement, and discoverability.
- Developers are adopting direct-to-consumer monetization strategies—including tiered pricing, windowing, and in-game advertising—to address a price-conscious global player base.
- The rise of developer-owned webstores and alternative distribution platforms is challenging the dominance of incumbent app stores to improve margins and deepen player relationships.
- Market saturation caused by an influx of low-quality, AI-generated content poses a significant risk to profitability and requires a focus on sustainable creator economies.
+3
Boston Consulting GroupJan 2025
Report8 pages
UGC Impact Study 2025
The 2025 UGC Impact Study, conducted by GameDiscoverCo and commissioned by mod.io, analyzes the commercial and engagement benefits of integrating official user-generated content (UGC) support into video games. The research demonstrates that games offering official modding tools or content-sharing solutions consistently outperform those without such features across PC, console, and VR platforms. By examining a dataset of approximately 1,200 Steam games that generated at least $1 million in their first month, the study finds that titles with UGC support see an 8% revenue advantage after one year, which expands to 31% after five years.
The primary driver for this long-term financial success is significantly higher player retention. On PC, games with UGC support maintain 75% higher concurrent user counts after two years and 115% higher after five years compared to games without these features. Furthermore, the research refutes concerns regarding the cannibalization of official content; games with UGC support actually see 105% higher median revenue per DLC. Case studies, such as Baldur’s Gate 3 and SnowRunner, support these findings, with the latter noting that players using mods were 2.4 times more likely to purchase official DLC.
The scope of the study extends beyond PC to include PlayStation, Xbox, and Meta Quest platforms. On consoles, the impact is even more pronounced in the short term, with UGC-supported titles showing a 16% performance boost on PlayStation and a 24% boost on Xbox after one year. In the VR sector, titles with UGC support experienced 30% more median growth over the past year than those without. The methodology evolved from previous years to include not just Steam Workshop, but also middleware solutions like mod.io and proprietary studio tools, suggesting that the positive correlation between UGC and commercial longevity is a robust, industry-wide trend.
- Games with official UGC support see a 31% revenue advantage over non-UGC titles after five years, growing from an 8% advantage in the first year.
- UGC support drives long-term player retention, resulting in 75% higher concurrent user counts after two years and 115% higher after five years on PC.
- Official UGC does not cannibalize sales; games with modding support see 105% higher median revenue per DLC, with SnowRunner players using mods being 2.4 times more likely to purchase official DLC.
- Console platforms show significant short-term gains from UGC integration, with a 16% performance boost on PlayStation and a 24% boost on Xbox after one year.
- VR titles integrating UGC support experienced 30% more median growth over the past year compared to those without such features.
+2
GameDiscoverCoJan 2025
Report3 pages
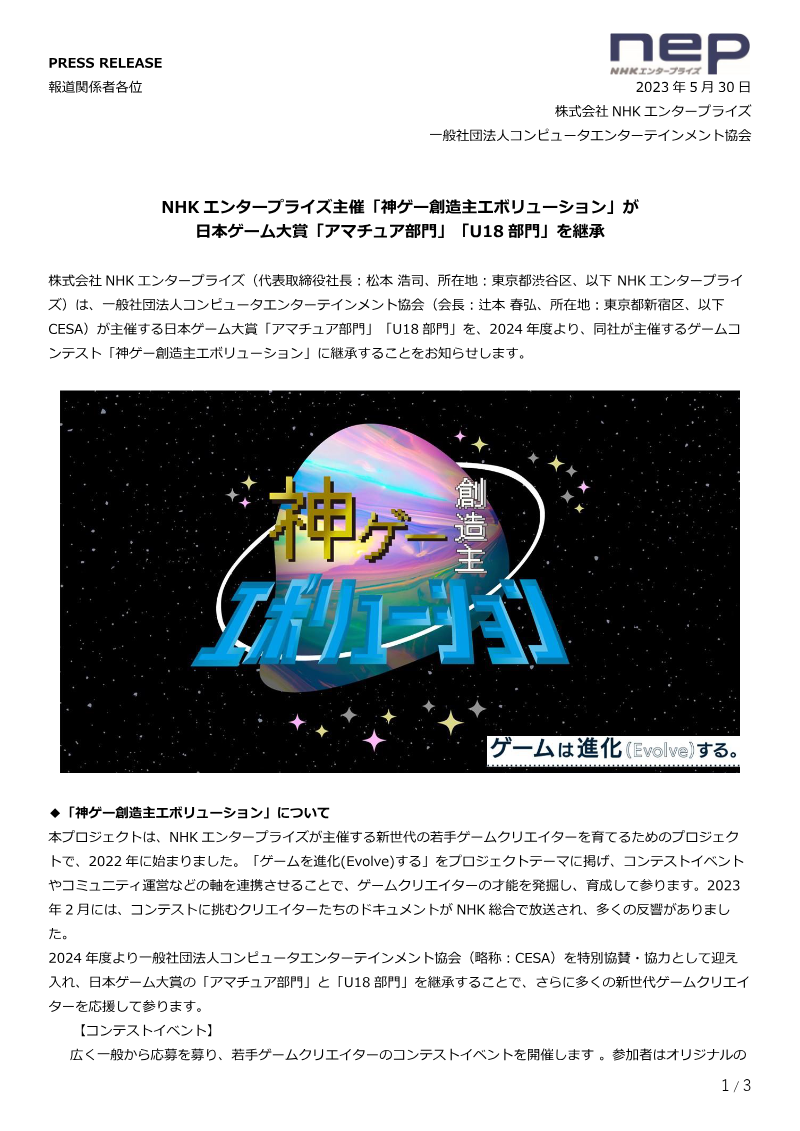
NHK Enterprise's 'Kami-Ge Creator Evolution' Succeeds Japan Game Awards 'Amateur' and 'U18' Divisions
NHK Enterprise is launching the “Kami‑Ge Creator Evolution” contest as a dedicated platform for nurturing the next generation of Japanese game developers, and from 2024 it will incorporate the Japan Game Awards’ Amateur and U18 divisions. The initiative, begun in 2022 under the theme “Evolve the Game,” seeks to discover and develop talent through a series of contest events, community support, and media exposure, including a documentary broadcast on NHK General in February 2023 that generated strong public interest.
The competition invites creators from across Japan to submit original games, which are evaluated for innovative expansion of the medium’s boundaries by a diverse panel of established game designers, media artists, and other industry figures. In addition to expert judging, a public popularity vote is conducted, and the contest awards a Grand Prize, Excellence Awards, and Honorable Mentions in the Amateur category, while the U18 category focuses on participants aged 18 or younger, reflecting the Japan Game Awards’ long‑standing commitment to youth development since 2018. The 2024 schedule begins with an entry period from 1 February to the end of April, followed by nomination, second‑round video submissions in July, third‑round game submissions in October, finalist announcements at the end of October, and a final event slated for December.
A closed Discord community supports participants with exclusive benefits, knowledge sharing, and mentorship, reinforcing the project’s role as a learning environment. Special cooperation from the Computer Entertainment Supplier’s Association (CESA) provides additional industry credibility and resources. The contest is open to individuals, teams, corporations, and organizations regardless of age, gender, nationality, or the number of entries, emphasizing inclusivity and broad outreach.
By integrating the Amateur and U18 awards, the “Kami‑Ge Creator Evolution” aims to broaden the creative framework of Japanese games, foster innovative design, and strengthen the pipeline of skilled developers. The organizers are actively seeking sponsors to sustain the project’s growth and align with NHK Enterprise’s broader commitment to sustainable development and cultural enrichment.
- NHK Enterprise has integrated the Japan Game Awards’ Amateur and U18 divisions into its 'Kami-Ge Creator Evolution' contest, effective from 2024.
- The 2024 competition timeline spans from February 1 to a final event in December, featuring a multi-stage evaluation process including video submissions in July and game submissions in October.
- The contest is open to all applicants regardless of age, nationality, or organizational status, with specific categories for general amateur creators and those aged 18 or younger.
- Participants gain access to a closed Discord community providing mentorship, knowledge sharing, and exclusive resources to support developer growth.
- The initiative is supported by the Computer Entertainment Supplier’s Association (CESA) to provide industry credibility and resources for the project.
+2
CESA – Computer Entertainment Supplier's AssociationMay 2023
Report66 pages
How UGC, AI, & Cloud Are Transforming Gaming
The gaming industry is currently undergoing a fundamental transformation driven by the social behaviors of Gen Alpha and Gen Z, over 90% of whom utilize gaming as their primary interactive outlet. This demographic shift has catalyzed the rise of User-Generated Content (UGC), artificial intelligence, and cloud infrastructure, collectively democratizing development and allowing indie titles to compete with AAA productions. The cloud gaming market is expanding rapidly, reaching nearly 400 million users within four years, while the integration of AI in gaming is projected to achieve a $4.2 billion valuation by 2029.
UGC has emerged as a critical driver of retention, with dominant platforms like Roblox, Minecraft, and Fortnite accounting for 19% of total global playtime and distributing over $1.3 billion to creators in 2023. To overcome the technical and legal hurdles of content creation, the industry is increasingly turning to generative AI, a sector expected to reach $1.8 billion by 2025. These tools automate complex processes such as texture upscaling and level generation, lowering the barrier to entry for creators across diverse genres.
While cloud technology offers the potential for real-time updates and massive concurrency, infrastructure limitations remain a significant bottleneck. Approximately 76% of players identify latency as a primary concern, suggesting that while 5G will eventually facilitate mass consumer adoption, the immediate utility of the cloud lies in B2B applications like secure playtesting and instant discoverability. The convergence of these technologies is ultimately moving the industry toward a live-service ecosystem of "endless games," where the boundaries between traditional media and interactive community-driven platforms continue to blur.
- User-generated content (UGC) is a primary driver of player retention, with Roblox, Minecraft, and Fortnite accounting for 19% of global playtime and distributing $1.3 billion to creators in 2023.
- The integration of AI in gaming is projected to reach a $4.2 billion valuation by 2029, while the generative AI sector specifically is expected to hit $1.8 billion by 2025.
- Cloud gaming has scaled to nearly 400 million users in four years, though 76% of players cite latency as a primary barrier to mass adoption.
- Generative AI is lowering development barriers by automating complex technical tasks like texture upscaling and level generation, enabling indie titles to compete with AAA productions.
- Over 90% of Gen Alpha and Gen Z now utilize gaming as their primary interactive outlet, forcing a shift toward live-service ecosystems and community-driven platforms.
+2
NewzooJan 2023