Moba
2 documents·2 publishers
Documents
Report6 pages
2025 eSports Player Rankings: By Game and Earnings in Korea
South Korea’s professional gaming landscape is characterized by a title-centered evaluation system where prize earnings are highly concentrated among elite players. Analysis of the country’s top eSports competitors across five major PC-based titles—League of Legends, StarCraft II, Valorant, Overwatch 2, and PlayerUnknown’s Battlegrounds (PUBG)—reveals significant disparities in cumulative wealth based on the longevity and global scale of each game’s competitive scene.
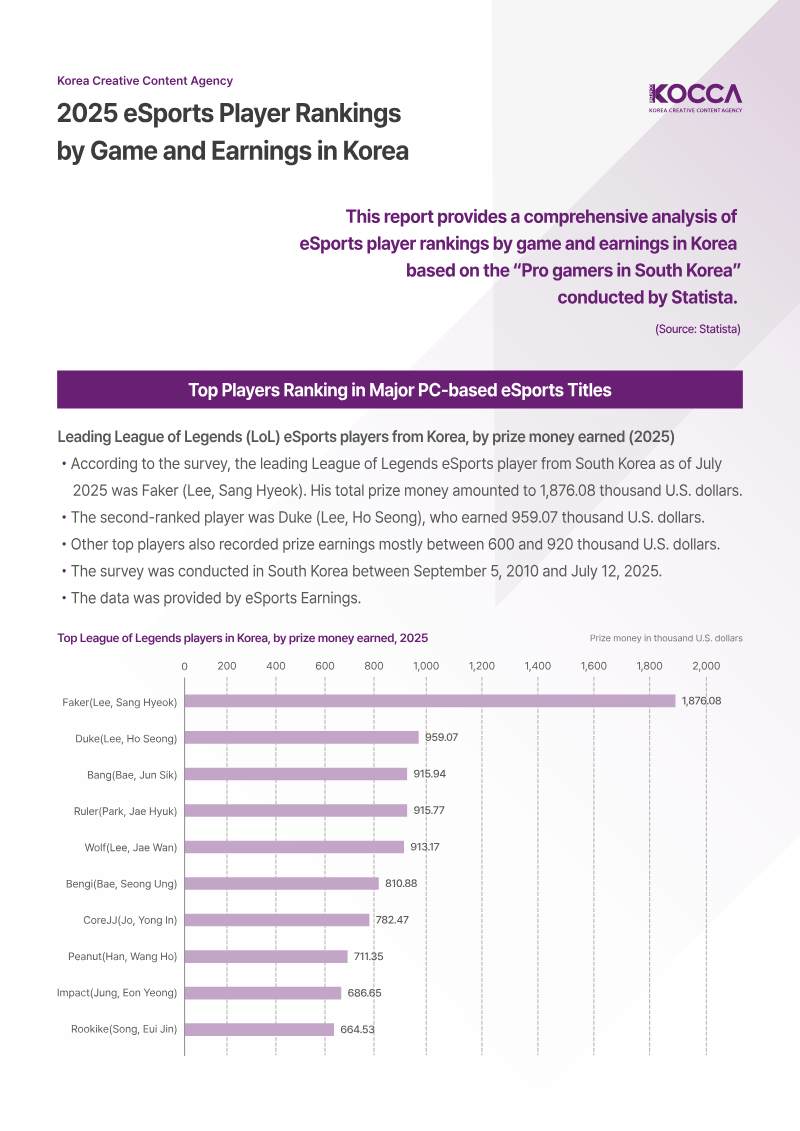
League of Legends remains a dominant sector, with Lee Sang-hyeok (Faker) leading all players with approximately $1.88 million in prize money as of July 2025. This exceeds the top earners in other disciplines, such as Cho Sung-choo (Maru) in StarCraft II, who earned $1.39 million, and Park Jung-young (Loki) in PUBG, who secured $1.25 million. In contrast, newer or more recently transitioned titles like Overwatch 2 and Valorant show lower cumulative earnings, with top players Choi Tae-min (MER1T) and Kim Jong-min (Lakia) earning $375,450 and $164,980 respectively.
The data, sourced from eSports Earnings and compiled by the Korea Creative Content Agency, utilizes a longitudinal methodology tracking performance from as early as 2010 through mid-2025. While the rankings for League of Legends, StarCraft II, and Valorant reflect 2025 figures, the data for Overwatch 2 and PUBG is current through late 2024. This segmentation highlights a fragmented domestic performance structure where success is measured by game-specific milestones rather than a unified national ranking. The findings underscore a mature market where established titles continue to provide the highest financial returns for top-tier professional talent.
- League of Legends remains the most lucrative eSports title in South Korea, with top earner Lee Sang-hyeok (Faker) accumulating $1.88 million in prize money as of July 2025.
- Established titles offer significantly higher financial returns than newer games, as evidenced by StarCraft II leader Cho Sung-choo earning $1.39 million and PUBG leader Park Jung-young earning $1.25 million.
- Newer competitive titles show a substantial earnings gap compared to legacy games, with top Overwatch 2 player Choi Tae-min earning $375,450 and Valorant leader Kim Jong-min earning $164,980.
- The South Korean professional gaming market lacks a unified national ranking system, relying instead on a fragmented structure where success is measured by game-specific milestones.
- Data compiled by the Korea Creative Content Agency indicates that cumulative wealth in the sector is heavily concentrated among elite players at the top of their respective disciplines.
+1
KOCCA – Korea Creative Content AgencyJan 2025
Report39 pages
The State of MOBA Mobile Games 2021
This analysis explores the Multiplayer Online Battle Arena (MOBA) sub-genre within the mobile gaming market, focusing on its rapid financial growth and competitive landscape. Leveraging data from Sensor Tower’s Game Intelligence and Store Intelligence platforms, the report examines global trends from 2019 through August 2021. The central thesis identifies MOBAs as a "winner-takes-all" market dominated by a few high-performing titles that command significant player spending despite a general stagnation in overall sub-genre downloads.
The findings reveal that MOBAs are among the fastest-growing segments of the Strategy genre, generating approximately $2 billion in global player spending during the first half of 2021. While Asia remains the dominant force, accounting for 84 percent of total revenue, emerging markets like Brazil, Indonesia, and Russia have become critical hubs for daily active users. Honor of Kings stands as the industry leader, surpassing $10 billion in lifetime revenue, while Mobile Legends and Brawl Stars maintain strong global positions. Notably, the September 2021 launch of Pokémon Unite set a new record for the sub-genre, achieving 15 million downloads in its first two days.
The study also highlights a divergence in monetization and engagement strategies. Titles like Brawl Stars favor simplified mechanics and high long-term retention, whereas others utilize "paid advantage" mechanics—such as stat-boosting skins—to drive higher revenue per download at the potential risk of lower retention. In the United States, intellectual property plays a significant role, with licensed IP games accounting for 43 percent of all MOBA installs. Ultimately, the market is characterized by high concentration among top publishers like Tencent, Supercell, and ByteDance, creating a challenging environment for new entrants without established brand recognition.
- The mobile MOBA market is a 'winner-takes-all' environment dominated by Tencent, Supercell, and ByteDance, making it difficult for new entrants to succeed without established brand recognition.
- Global MOBA player spending reached approximately $2 billion in the first half of 2021, with Asia accounting for 84 percent of total revenue.
- Honor of Kings is the industry leader with over $10 billion in lifetime revenue, while Pokémon Unite set a sub-genre record with 15 million downloads in its first two days following its September 2021 launch.
- While overall sub-genre downloads have stagnated, MOBAs remain one of the fastest-growing segments within the Strategy genre.
- Emerging markets including Brazil, Indonesia, and Russia have become critical hubs for daily active user growth.
+1
Sensor TowerJan 2021