Dreams
Game
Documents about Dreams


Q1 FY2026 Presentation Material
CyberAgent achieved record-high consolidated sales of 232.3 billion yen and a nearly threefold increase in operating profit during the first quarter of fiscal year 2026.
- CyberAgent achieved record-high consolidated sales of 232.3 billion yen in Q1 FY2026, reaching nearly 47% of its annual operating profit target in the first three months.
- The Game segment drove performance with a 69.2% year-over-year sales increase and a fivefold surge in operating profit, largely fueled by the global success of Jujutsu Kaisen Phantom Parade.
- AbemaTV reached a key milestone by achieving independent profitability within the Media & IP segment.

Neowiz Investor Presentation: Q3 2025
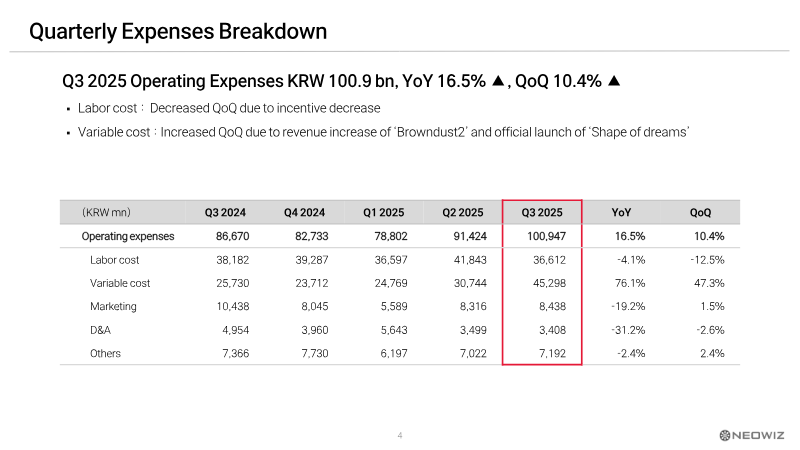
Neowiz’s third-quarter 2025 financial results demonstrate significant growth, characterized by strong revenue expansion and improved profitability across its core gaming segments.
- Neowiz reported Q3 2025 revenue of KRW 127.4 billion, marking a 36.8% year-over-year increase and a 15.8% quarter-over-quarter growth.
- Operating profit reached KRW 26.5 billion with a 20.8% operating margin, while net profit for the quarter was KRW 25.0 billion.
- Mobile revenue grew to KRW 58.5 billion, a 32.8% increase quarter-over-quarter, driven by the seventh consecutive quarter of growth for Browndust2.

Playtika Holding Corp. First Quarter 2025 Results
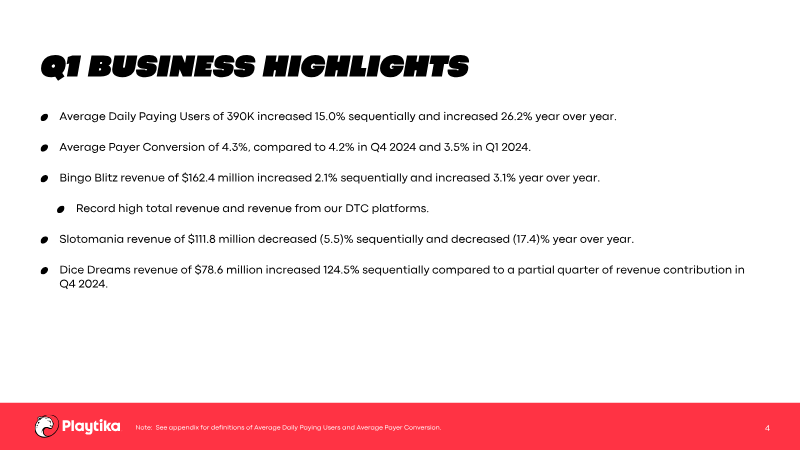
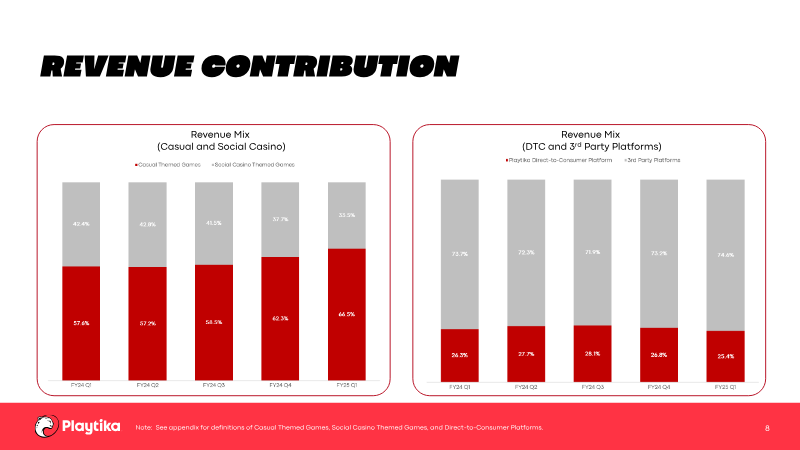
Playtika Holding Corp.’s first quarter 2025 financial results demonstrate a period of revenue growth alongside shifts in profitability metrics.
- Playtika reported Q1 2025 revenue of $706.0 million, an 8.4% year-over-year increase, though GAAP net income fell 42.3% to $30.6 million.
- Adjusted EBITDA declined 9.9% year-over-year to $167.3 million, resulting in a 23.7% margin for the quarter.
- User monetization metrics improved significantly, with Average Daily Paying Users rising 26.2% year-over-year to 390,000 and Payer Conversion increasing to 4.3%.

Playtika Holding Corp. Fourth Quarter 2024 and Full Year 2024 Results
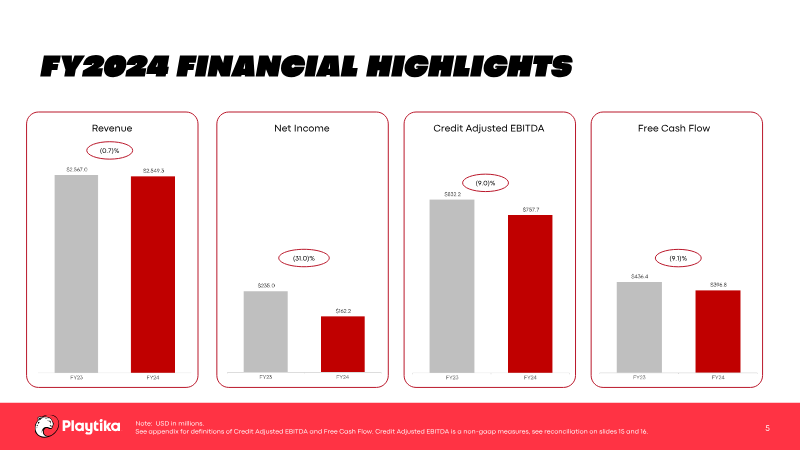
Playtika Holding Corp.’s 2024 fiscal year results reflect a period of strategic transition and operational adjustment within the mobile gaming sector.
- Playtika reported 2024 annual revenue of $2.55 billion, a 0.7% year-over-year decline, with net income falling 31% to $162.2 million.
- The company projects 2025 revenue between $2.8 billion and $2.85 billion, supported by $1.17 billion in liquidity and no immediate debt maturities.
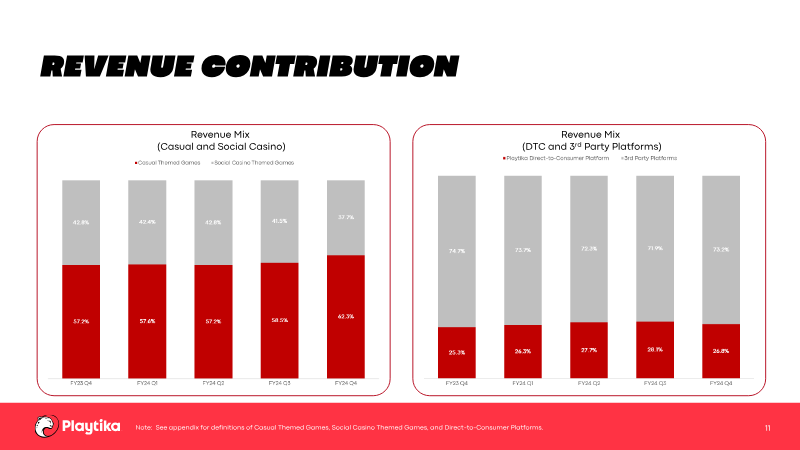
- Casual themed games now represent 58.9% of total revenue, reflecting a strategic shift in the company's product portfolio.


Bandai Namco Group Integrated Report 2018
The 2018 integrated report presents Bandai Namco’s strategic and financial narrative, emphasizing a record-high fiscal performance and a forward-looking “CHANGE for the NEXT” mid-term plan (FY 2018-2021).
- Bandai Namco achieved record fiscal performance in 2018 with consolidated net sales of ¥678.3 billion (up 9.4%) and an operating profit of ¥75.0 billion (up 18.6%).
- The company launched a ¥25 billion strategic-investment fund dedicated to the IP-Creation Unit, aiming to increase the value of core franchises like Gundam and PAC-MAN by 100 to 1,000 times.
- The 'IP-axis' strategy focuses on cross-media expansion, resulting in the production of 309 copyrighted titles totaling 2,560 hours of content across games, toys, animation, and live-action.



Annual Report 2014
The 2014 annual report presents Bandai Namco Group’s financial performance, strategic direction, and corporate governance for the fiscal year ended 31 March 2014.
- Bandai Namco Group achieved net sales of ¥507.7 billion for the fiscal year ending 31 March 2014, marking a 4.2% increase and the first post-integration figure to exceed the ¥500 billion milestone.
- Operating income declined 8.2% to ¥44.7 billion, primarily due to a ¥5 billion forward-looking investment and a ¥1 billion increase in related-party sales to affiliate Happinet.
- Net income grew by 22.6% to ¥25.1 billion, resulting in a 4.2% return on equity and an 8.8% operating margin.
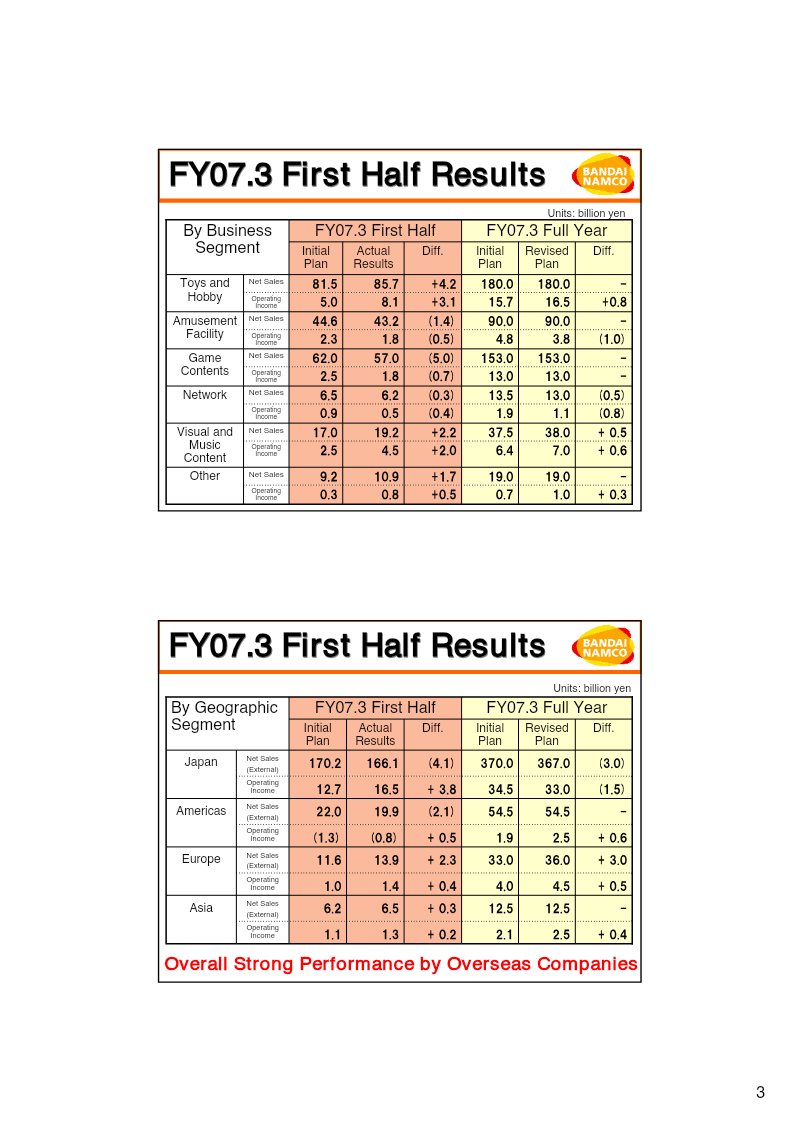


Bandai Namco Group Presentation of Financial Results for the Interim Period of FY 07.3
The Bandai Namco Group’s interim financial results for the fiscal year ending March 2007 outline a period of strategic consolidation and operational adjustment.
- Bandai Namco Group reported interim net sales of 206.6 billion yen and operating income of 17.2 billion yen for the fiscal year ending March 2007.
- The Toys and Hobby segment outperformed expectations, bolstered by strong sales of the Mobile Suit Gundam series and Tamagotchi products.
- The Game Contents segment underperformed during the period due to the postponement of key product releases.

3Q FY2026 Presentation Material
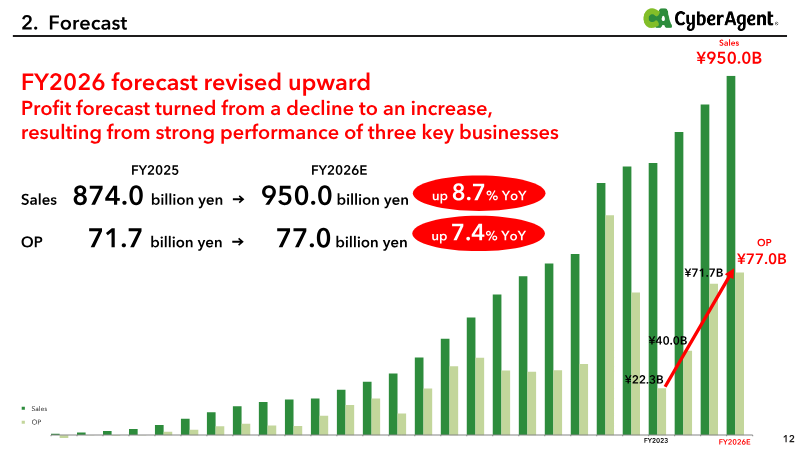
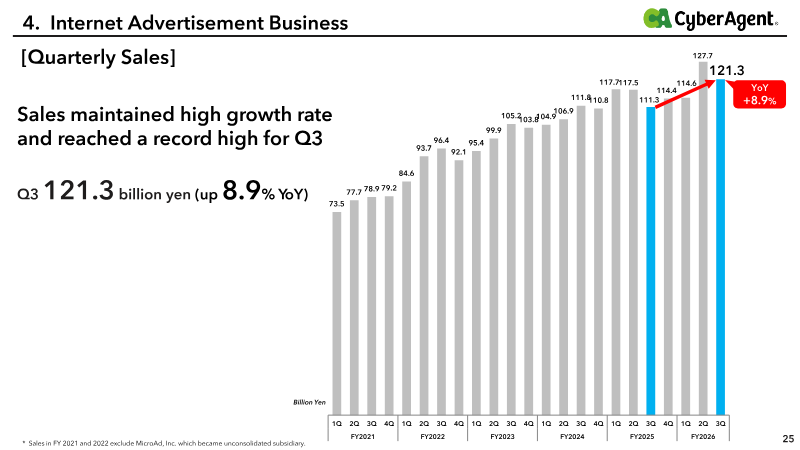
CyberAgent achieved record-high quarterly sales of 230.6 billion yen during the third quarter of fiscal year 2026, representing a 9.4 percent year-over-year increase.
- CyberAgent achieved record-high 3Q FY2026 sales of 230.6 billion yen, a 9.4% year-over-year increase, leading to an upward revision of full-year forecasts to 950 billion yen in sales and 77 billion yen in operating profit.
- The company increased its dividend projection to 20 yen per share, reflecting strong confidence in its financial trajectory and long-term value creation.
- Growth was driven by a 20.8% revenue surge in the gaming segment and the expansion of the ABEMA streaming platform, which reached 31.37 million weekly active users.



Playtika Holding Corp. Third Quarter 2024 Results
Playtika Holding Corp. reported third-quarter 2024 results for the period ended September 30, 2024, showing a revenue of $620.8 million, down 1.0% sequentially and 1.5% year-over-year.
- Playtika agreed to acquire SuperPlay for an upfront $700 million, with up to $1.25 billion in contingent payments tied to performance targets over the next three years.
- Q3 2024 revenue reached $620.8 million, representing a 1.5% year-over-year decline, while net income fell 54.6% sequentially to $39.3 million.
- Direct-to-consumer platforms grew 8.3% year-over-year to $469.1 million, contrasting with a 4.8% decline in third-party platform revenue.