FinancialSega Sammy Holdings
Results Presentation: Fiscal Year Ended March 2025
71 pages~47 min full read
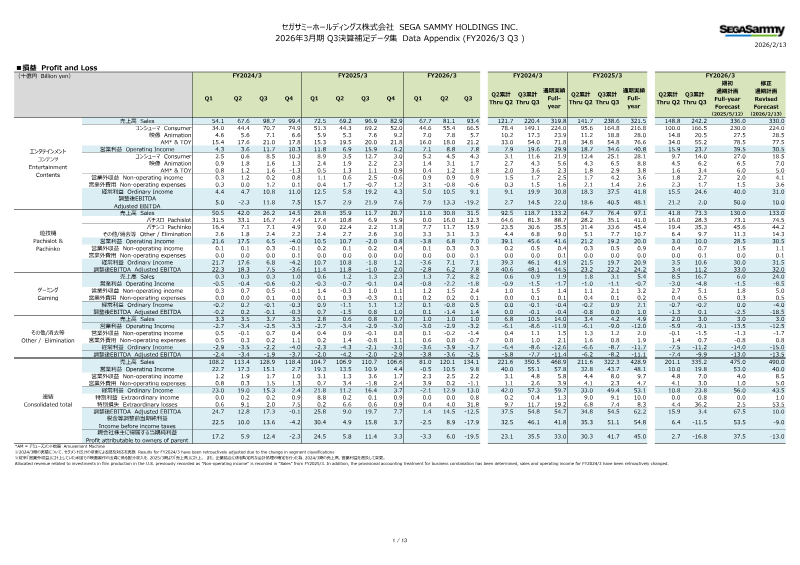
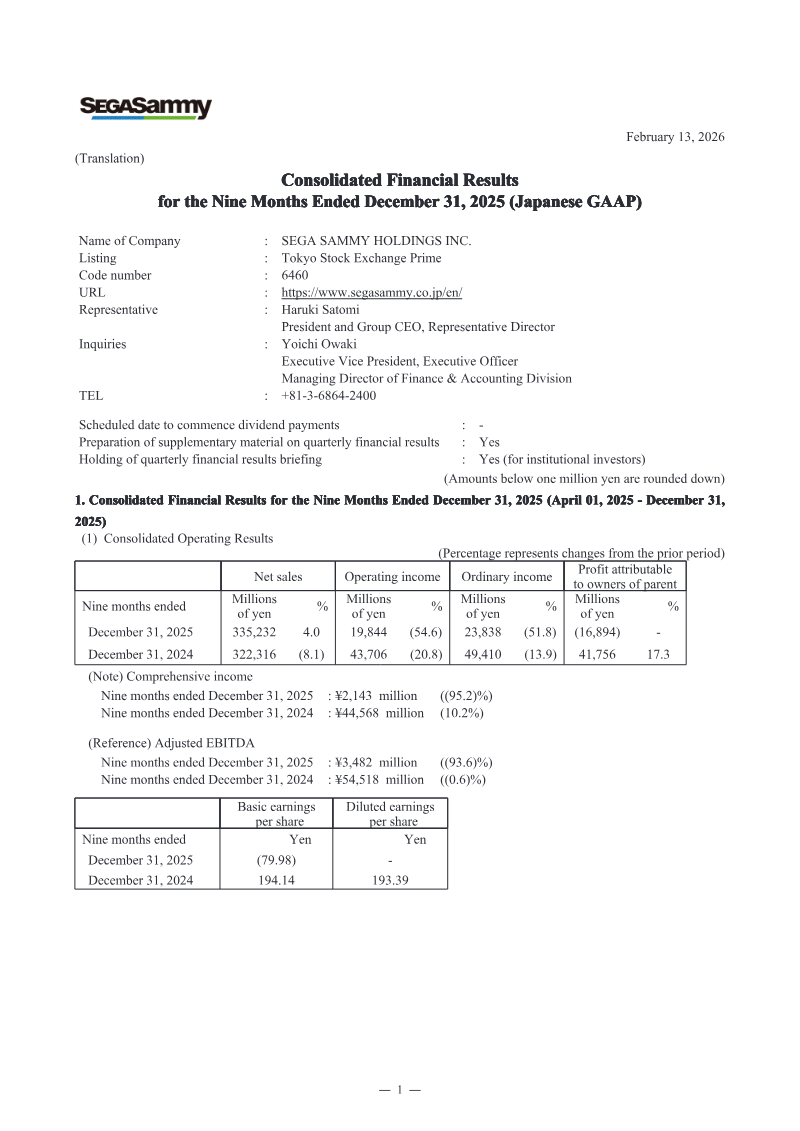
Fiscal year 2025/3 delivered a robust performance across the company’s core entertainment and gaming divisions. Total sales reached ¥468.9 billion, with operating income of ¥48.1 billion and a net profit attributable to owners of ¥45.0 billion, up 36 % from the prior year. The lift was largely driven by a 10‑point rise in extraordinary income from the sale of PHOENIX RESORT shares and strong repeat sales within the Entertainment‑Content segment, where operating income surged from ¥29.9 billion to ¥40.8 billion while new‑title revenue held steady at ¥33.5 billion. High‑margin downloadable content, licensing from CS titles and animation releases further amplified profitability.
Adjusted EBITDA is projected to climb from ¥54.7 billion in FY2024/3 to ¥62.2 billion in FY2025/3, reflecting increased sales and higher operating leverage across consumer and gaming businesses. The company announced a 50‑yen annual dividend, a ¥12 billion treasury‑stock acquisition, and the cancellation of 20 million shares to reinforce shareholder value.
Geographically, the company’s casino operations in Japan posted record revenue, while its hotel segment achieved a new occupancy high. The medium‑term plan targets cumulative adjusted EBITDA of ¥230 billion and an ROE above 10 % through FY2025/3‑FY2027/3, supported by portfolio optimization and enhanced returns. In trans‑media, Sonic IP generated a 140 % YoY rise in licensing revenue from the Sonic X Shadow Generations title and live‑action drama, with new releases slated for 2025‑26. The gaming arm expanded its IP portfolio and introduced gameplay innovations such as the Bonus Trigger for Pachislot, while acquiring Stakelogic to broaden its North American online footprint. Overall, the year’s results underscore sustained growth, strategic portfolio expansion, and a clear focus on shareholder returns.
Sega Sammy Holdings · 2026

Sega Sammy Holdings · 2026
Sega Sammy Holdings · 2026
Sega Sammy Holdings · 2026

Sega Sammy Holdings · 2025

Sega Sammy Holdings · 2025
Sega Sammy Holdings · 2025
Sega Sammy Holdings · 2024

Sega Sammy Holdings · 2024
Sega Sammy Holdings
Sega Sammy Holdings
Sega Sammy Holdings

Sony Group Corporation · 2026

Bandai Namco · 2026

InvestGame · 2025
Square Enix · 2025
Konami · 2025

Nintendo · 2024
Bandai Namco · 2022

Bandai Namco · 2021
GREE · 2017

Bandai Namco · 2017
GREE Inc. · 2016
Bandai Namco · 2014