Skip to main content
Game Industry
Library
Library
Search
Ask AI
News
Connect your AI
Browse
The Catch Up
Topics
Collections
Writers
Help
Subscribe
Game Industry
Library
Library
Search
Ask AI
Saved
Financial Reports | Game Industry Library
Collections
Financial Reports
Back to Collections
Financial Reports
Reports in the Financial Reports category.
12 documents
Reports
Presentations
Whitepapers
Articles
Financial
Legal
Other
Recently added
Newest first
Oldest first
Title A–Z
Title Z–A
Report
9 pages
Q2 2025 Gaming Ad Snapshot
Google Ads and Facebook Ads remain the dominant platforms for mobile gaming promotion in Q2 2025.
The active mobile gaming audience is composed of 61% males, 38.5% females, and 0.8% unclassified users.
High-performing mobile gaming ad assets demonstrate rapid scaling, with impressions growing from an average of 13 million to 47 million over their lifecycle.
In-Game Advertising
User Acquisition
Mobile
+1
MarketIQ
Jun 2025
Report
12 pages
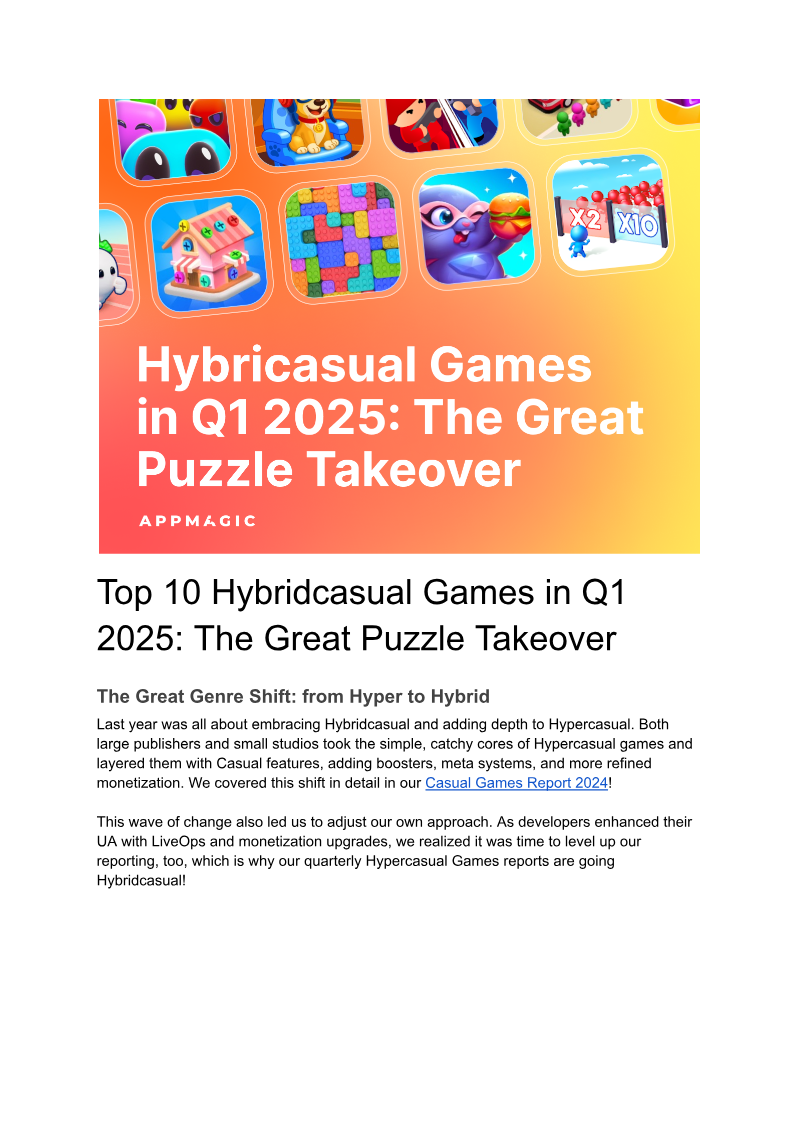
Top 10 Hybridcasual Games in Q1 2025: The Great Puzzle Takeover
The top ten hybrid-casual games generated $87 million in net IAP revenue in Q1 2025, marking a 67 percent year-over-year increase.
Puzzle and arcade titles dominate the hybrid-casual market, collectively accounting for over 90 percent of total earnings with a 48 percent and 45 percent revenue share, respectively.
Block-puzzle games lead the puzzle category with 71 percent of revenue, while sort-puzzle titles experienced the fastest growth, increasing 5.6 times year-over-year.
Market Analysis
Monetization
Mobile
+2
AppMagic
Jan 2025
Report
46 pages
Q4 2024 Digital Market Index
Global in-app purchase (IAP) revenue hit a record $39.4 billion in Q4 2024, a 13.5% year-over-year increase, with non-game apps ($19.2 billion) nearly reaching parity with gaming ($20.2 billion).
iOS remains the primary revenue driver, generating $30 billion (70% of total IAP revenue) and outpacing Google Play’s growth at 15.4% versus 9.7%.
Strategy games became the most lucrative gaming segment with $4.8 billion in Q4 IAP revenue, marking an 80% quarter-over-quarter increase that helped offset an 11% year-over-year decline in RPG revenue.
Market Analysis
Global
Mobile
+1
Sensor Tower
Jan 2024
Report
13 pages
Digital Services Report
Q2 2024 saw robust activity in the digital services sector with over 350 M&A transactions totaling $7.4 billion and 880 fundraising deals raising $8.1 billion.
Major M&A activity was headlined by EQT’s $3.0 billion acquisition of Perficient and Cognizant’s $1.3 billion purchase of Belcan, signaling a strategic focus on digital transformation capabilities.
Generative AI and AI-powered technologies are identified as the primary catalysts for deal momentum, with expectations for increased M&A activity in Q3 2024.
Market Analysis
Mergers & Acquisitions
Global
Drake Star
Jan 2024
Report
17 pages
Global MSP Report
The global MSP market reached a valuation of $305 billion in 2024 and is projected to grow at a 7.2% CAGR to $571 billion by 2033.
Private-placement deal value surged from $34 million in Q3 2024 to $2.2 billion in Q4 2024, driven by a high volume of platform deals.
Strategic buyers dominated Q4 2024 activity, accounting for 83% of total transactions as they aggressively acquired multiple MSPs.
Market Analysis
Mergers & Acquisitions
Investment
+1
Drake Star
Jan 2024
Report
30 pages
Gaming Industry Report: Global & MENAP Outlook Q4 2023
Investment activity in the gaming sector is currently targeting early-stage ventures from pre-seed to Series A, with typical ticket sizes ranging from $1 million to $8 million.
Strategic investment is focused on three core pillars: high-value intellectual property, software solutions that reduce development costs, and ecosystems centered on user-generated content.
The industry is experiencing a rapid convergence of emerging technologies, including AI, VR, cloud gaming, quantum computing, and GPU-as-a-Service, to accelerate content creation and distribution.
Market Analysis
Investment
Global
+1
Shorooq Partners
Dec 2023
Report
42 pages
Insights into Marketing Trends of Global Mobile Games: Q3 2023
Frequent creative turnover is a primary strategy for mitigating ad fatigue and sustaining click-through rates in competitive mobile gaming markets.
Deploying fresh creative assets can improve cost-per-install (CPI) benchmarks by up to 12% compared to static creative pools.
High-volume creative production is a critical growth lever, evidenced by a major publisher launching 6,500 distinct ad assets for a single strategy-lite title in Q3 2023.
Marketing
Advertising
User Acquisition
+2
SocialPeta
Sept 2023
Report
36 pages
Mobile Games: State of the Market & Playtime Benchmarks Q3 2023
Revenue in the mobile sector is highly concentrated, with Coin Master generating €5.3 million on Android in France and €6.7 million on Android in Germany during Q3 2023.
iOS users consistently demonstrate higher engagement than Android users, with average session lengths ranging from 35 to 51 minutes on iOS compared to 29 to 44 minutes on Android.
Japan records the longest average mobile game sessions globally, while France exhibits the smallest platform-based engagement gap at approximately 3.6 minutes.
Market Analysis
Player Behavior
Monetization
+2
Apptica
Sept 2023
Report
109 pages
Mobile Game Marketing: Insights & Trends of Popular Game Genres Q3 2022
The United States remains the dominant revenue driver for casual games, generating over $250 million in Q3 2022, which represents 46% of total revenue and an 11% year-on-year increase.
Southeast Asia is the fastest-growing market for mobile game downloads, recording 11% year-on-year and 12% quarter-on-quarter growth.
Casual games experienced stagnant download growth of less than 1% year-on-year, yet generated a 7% year-on-year revenue increase, totaling approximately $30 million in additional earnings.
Marketing
Advertising
Market Analysis
+2
SocialPeta
Sept 2022
Report
16 pages
The Highest-Grossing Mobile Games on iOS & Android: Q2 2022
Mid-core titles dominated Q2 2022 revenue, led by 'Rise of Kingdoms' which generated $179.5 million.
King was the highest-grossing publisher during the period, earning over $264 million across four leading titles.
Top-earning games outside the mid-core category included 'Candy Crush Saga' ($122 million), 'Coin Master' ($99.2 million), and 'Roblox' ($68.1 million).
Market Analysis
Monetization
Mobile
+2
Apptica
Jun 2022
Report
23 pages
Video Game Streaming Trends Report: 2022 First Quarter
Twitch maintains a dominant market position, accounting for approximately 75% of all streamed hours and 80% of esports viewership.
Total hours watched in Q1 2022 declined 6% from the previous quarter, yet remains 66% higher than Q1 2020 and 140% above Q1 2019 levels.
A small segment of core viewers, representing only 7.8% of the total audience, generates two-thirds of all watch time and is 24 times more receptive to repeated advertising than casual viewers.
Streaming
Market Analysis
Esports
+1
Stream Hatchet
Mar 2022
Report
20 pages
Market Snapshot: Q2 2021 US, China & Japan
Live-service feature updates increased by 37% year-over-year, with Strategy games leading the surge at 208% growth.
Engagement tactics are shifting toward non-recurring live events and limited-time in-app purchase offers, which saw frequency increases of 143% and 122% respectively.
In the US, the Strategy genre grew while the Puzzle genre declined, with Supercell emerging as a top-performing publisher.
Market Analysis
Mobile
USA
+3
GameRefinery
Jan 2021