Development & Publishing
Making and shipping games: design, engines, QA and publishing deals.
169 documents

InvestGame
ReportPublic Mobile Gaming Publishers: Resilience & Adaptation in a Shifting Landscape
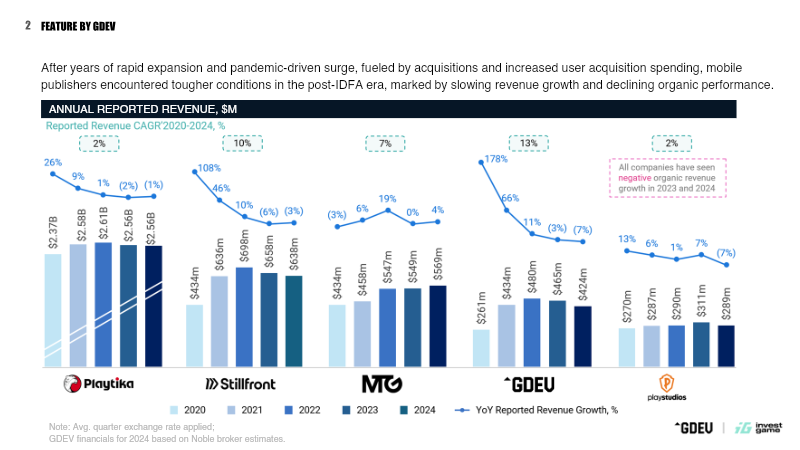
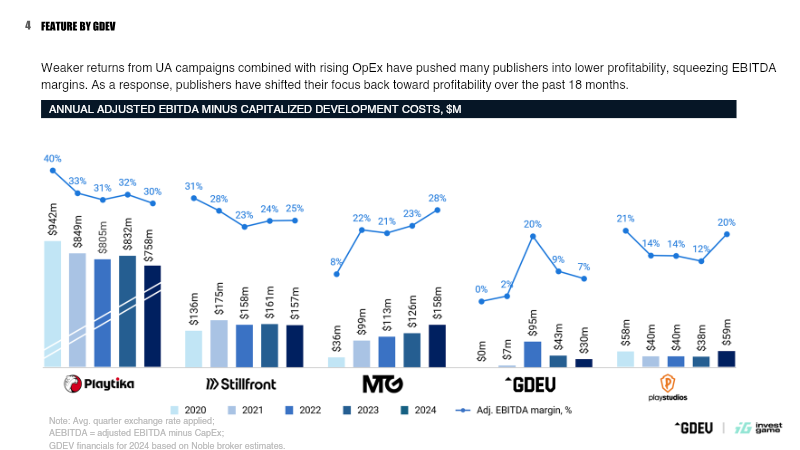
The analysis examines the post-IDFA mobile gaming landscape, focusing on revenue dynamics, user acquisition spending, profitability trends, and market valuation shifts across key publishers. Data reveal that annual reported revenue growth has slowed markedly, with many companies experiencing negative organic revenue and overall declines in 2023-24. User acquisition expenses have surged, reaching peaks of $40 million for some firms, yet returns from these campaigns have weakened, driving higher operating expenses and compressing EBITDA margins. Consequently, publishers are pivoting from aggressive scaling toward profitability, reflected in tighter cost controls and a renewed emphasis on player retention and lifetime value. Daily active user metrics illustrate the broader market contraction, with average DAU figures falling across the sector. Valuation impacts are stark: aggregate market capitalisation for major publishers has fallen by more than 50% since January 2022, and most stocks remain below their pre-IDFA peaks. An exception is MTG, whose disciplined mergers and acquisitions strategy and operational efficiency yielded 9% organic growth in Q4 2024, translating into a 50%+ share price increase and outperforming the S&P 500. The study covers global mobile gaming publishers over a 2022-2025 timeframe, drawing on quarterly financial statements and market data. Methodology includes analysis of reported revenue, user acquisition spend, EBITDA adjustments for capitalised development costs, and market cap changes. The findings underscore a sector in transition, where resilience hinges on profitability focus, retention strategies, and disciplined capital allocation.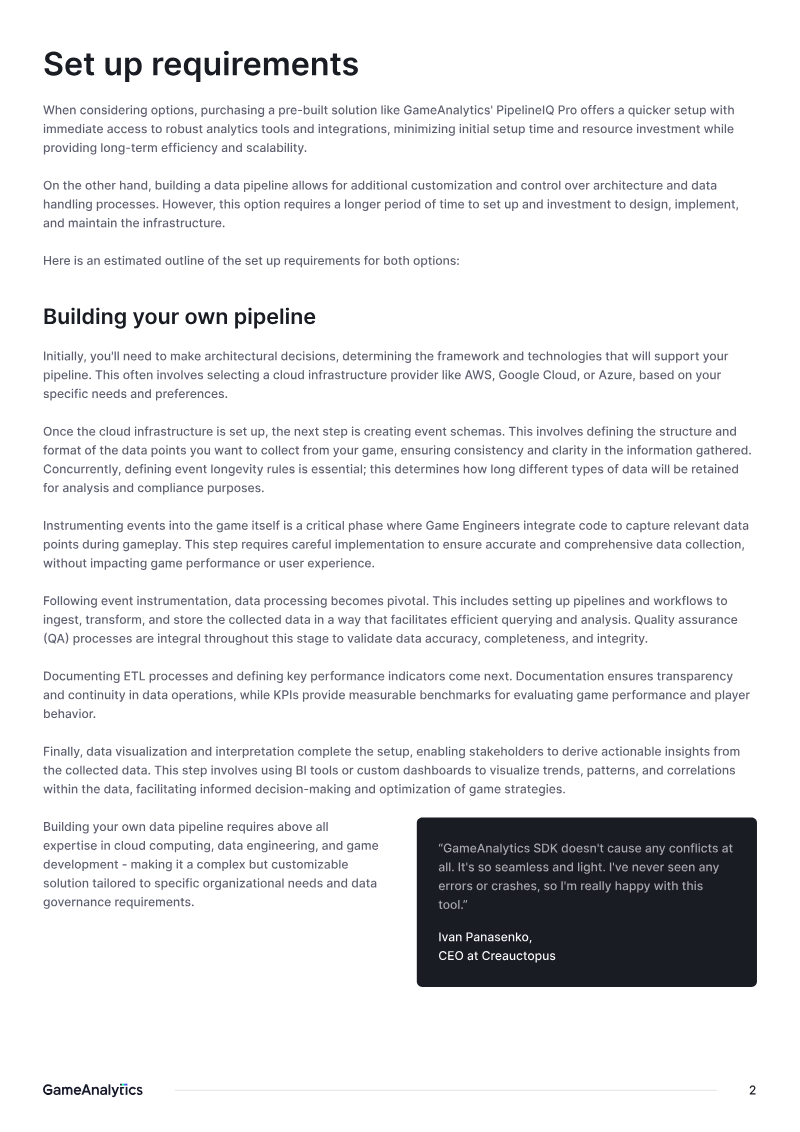

InvestGame
ReportGame Data: Building vs Buying
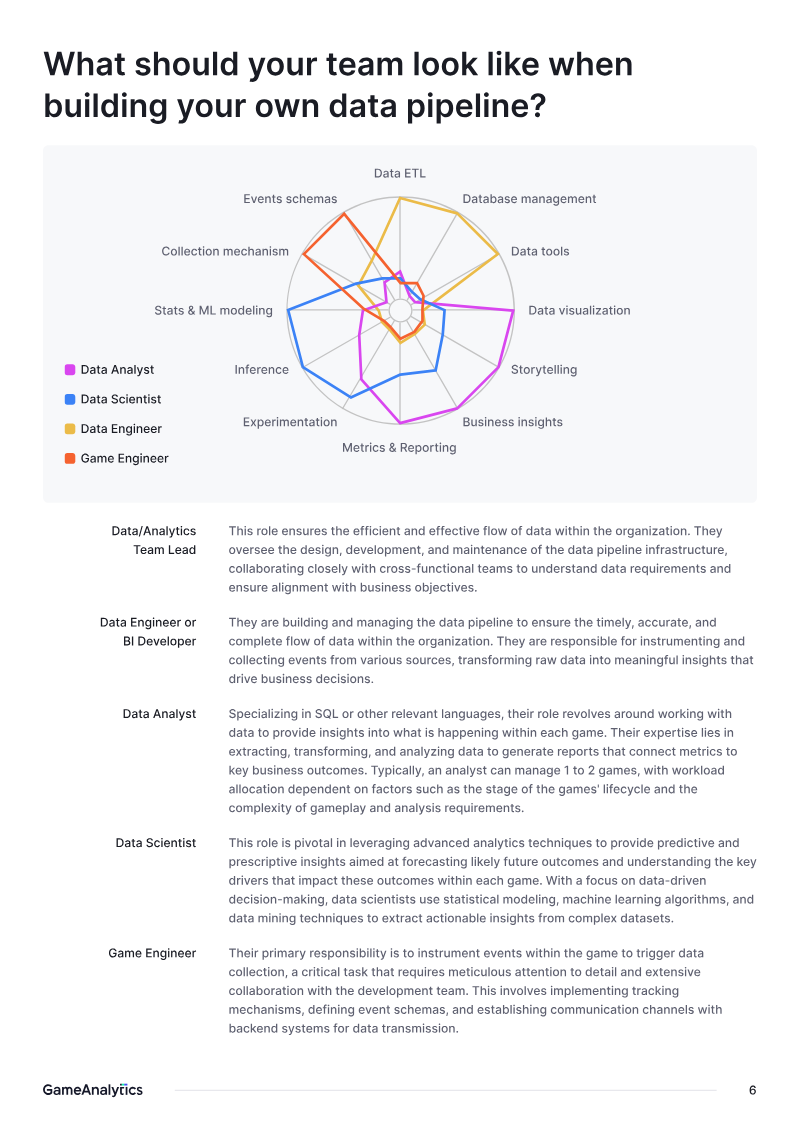
The document evaluates the trade-offs between building an in-house data pipeline and purchasing a third-party solution for game analytics, using GameAnalytics’ PipelineIQ Pro as the primary example. It argues that while custom pipelines offer full control, they demand significant upfront investment in infrastructure, skilled personnel, and ongoing maintenance. The cost of hiring a data team—engineers, scientists, analysts—and cloud services (ingestion, storage, query, visualization) can reach nearly $50 k per month for a mid-size studio with 5 million MAU, with human capital accounting for 89% of the expense. In contrast, a vendor-managed pipeline costs approximately $5.9 k per month, with the same headcount but lower operational overhead; human capital represents 78% of that budget. The analysis highlights additional benefits of third-party solutions, such as standardized event schemas, economies of scale in storage, rapid deployment (hours to days versus months), scalability without knowledge silos, and delegated privacy compliance. Methodologically, the comparison uses a hypothetical studio scenario to calculate total cost of ownership (TCO), breaking down monthly allocations into human, storage, query, and visualization costs. Geographic scope is global, with no regional restrictions noted; the time frame covers current market conditions and projected growth. The conclusion favors purchasing a proven pipeline for studios that lack the resources or urgency to build internally, citing lower TCO, faster time-to-insight, and reduced risk of technical debt.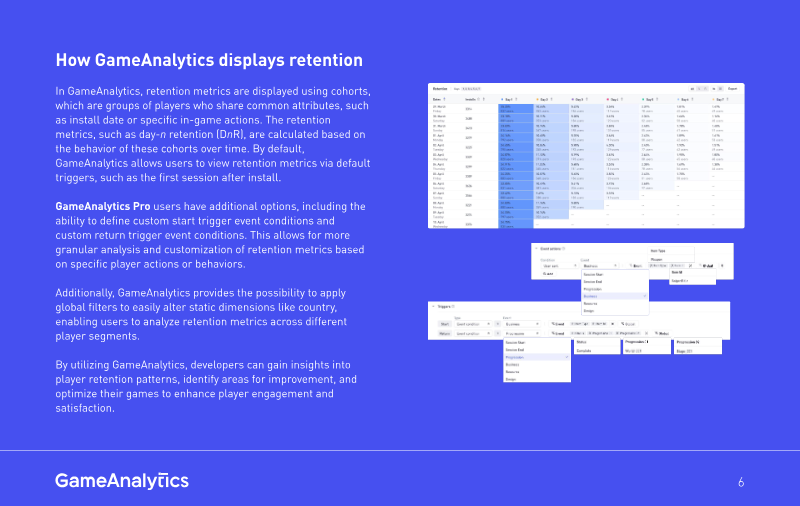

East Side Games
ReportGame Analytics 100: The Retention Curve
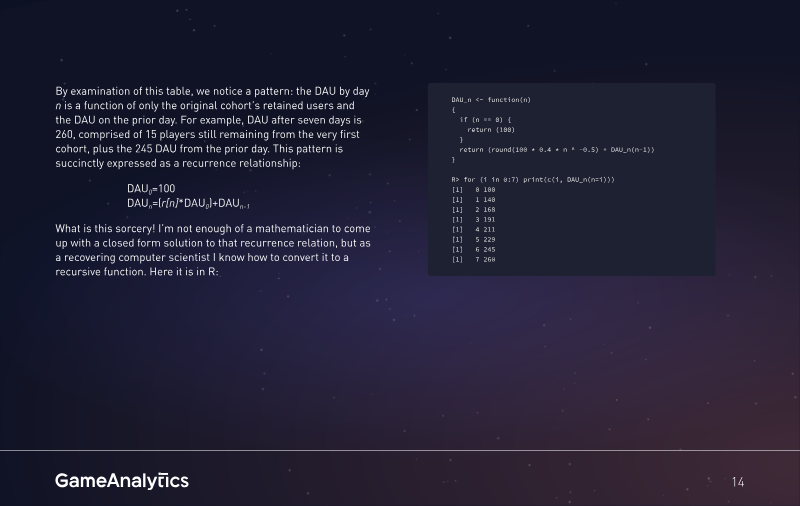
The analysis demonstrates that player retention in mobile games can be accurately modeled with a power-law curve, expressed either as \(r(n)=a\,b^n\) or \(r(n)=a\,n^{b}\). By fitting the curve to a limited set of cohort data—typically day-1, day-3, and day-7 retention—analysts can derive the parameters \(a\) (initial retention level) and \(b\) (decay exponent). Excel’s LINEST function on logged values provides a straightforward method for estimating these coefficients, yielding representative curves such as \(r(n)=0.396\,n^{-0.472}\). Once fitted, the curve serves multiple forecasting purposes. It predicts daily active users for any future day through a recurrence relation that incorporates the retention rate and cumulative DAU. It also enables calculation of player duration by summing \(r(n)\) over time, which feeds directly into lifetime value (LTV) estimates. For instance, with an average revenue per daily active user of \$1.00, the model projects LTV90 around 7.65 and LTV180 near 10.17, illustrating how early retention translates into long-term monetization. The methodology extends to benchmarking against industry standards. By comparing a studio’s day-1, day-7, day-30, and day-90 retention figures to genre-specific percentiles provided by GameAnalytics, developers can identify performance gaps and prioritize optimization efforts. The approach is applicable across mobile game segments worldwide and covers the entire post-install period, offering a scalable tool for forecasting, monetization planning, and competitive analysis.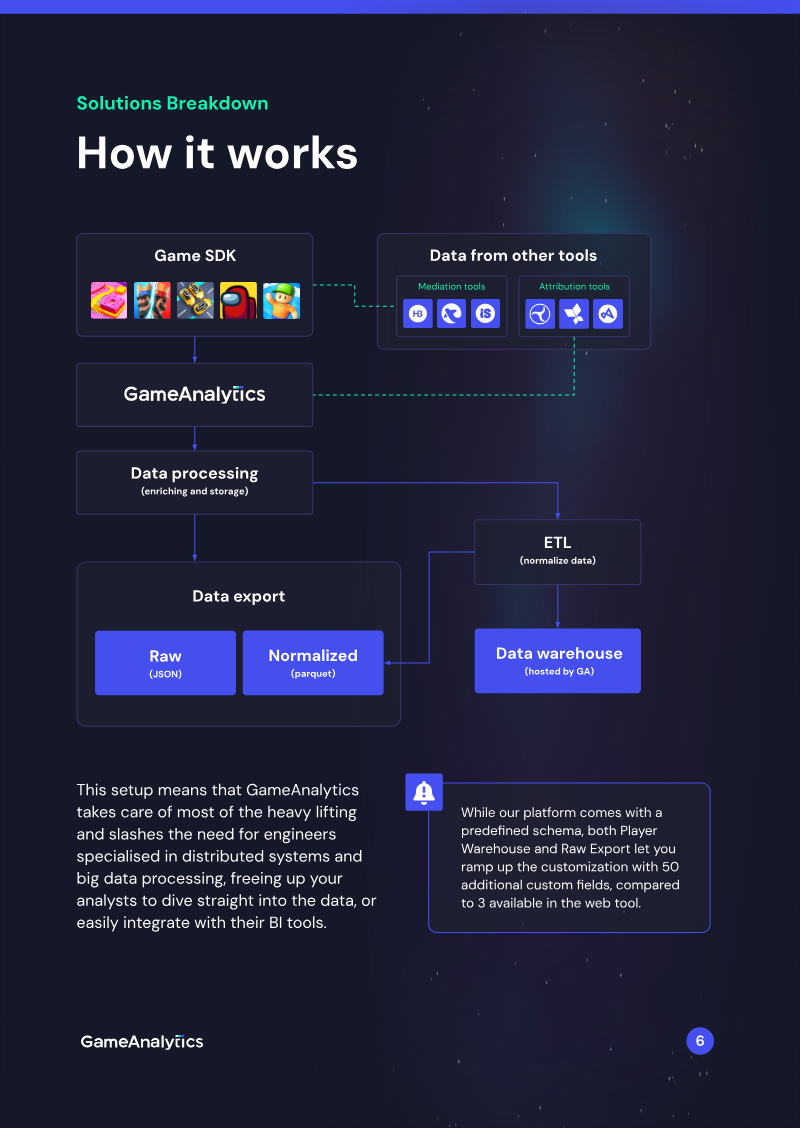
InvestGame
ReportA Shortcut to Your Own Game Insights Platform
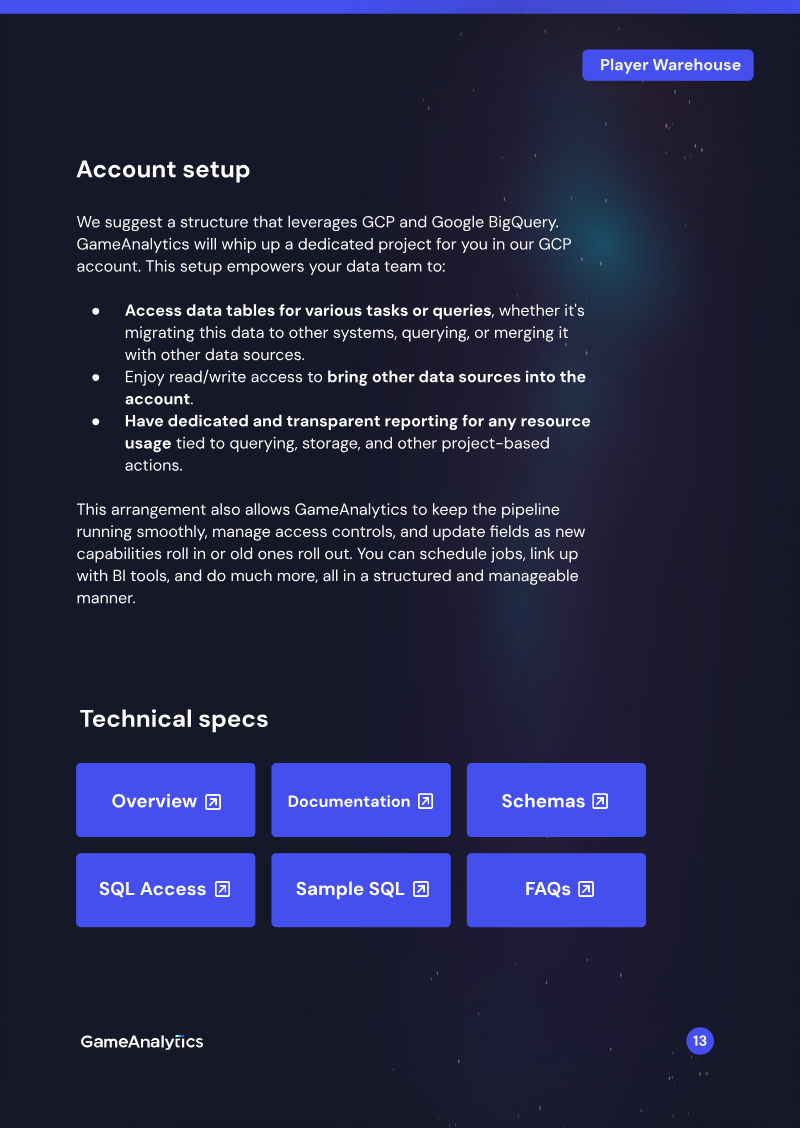
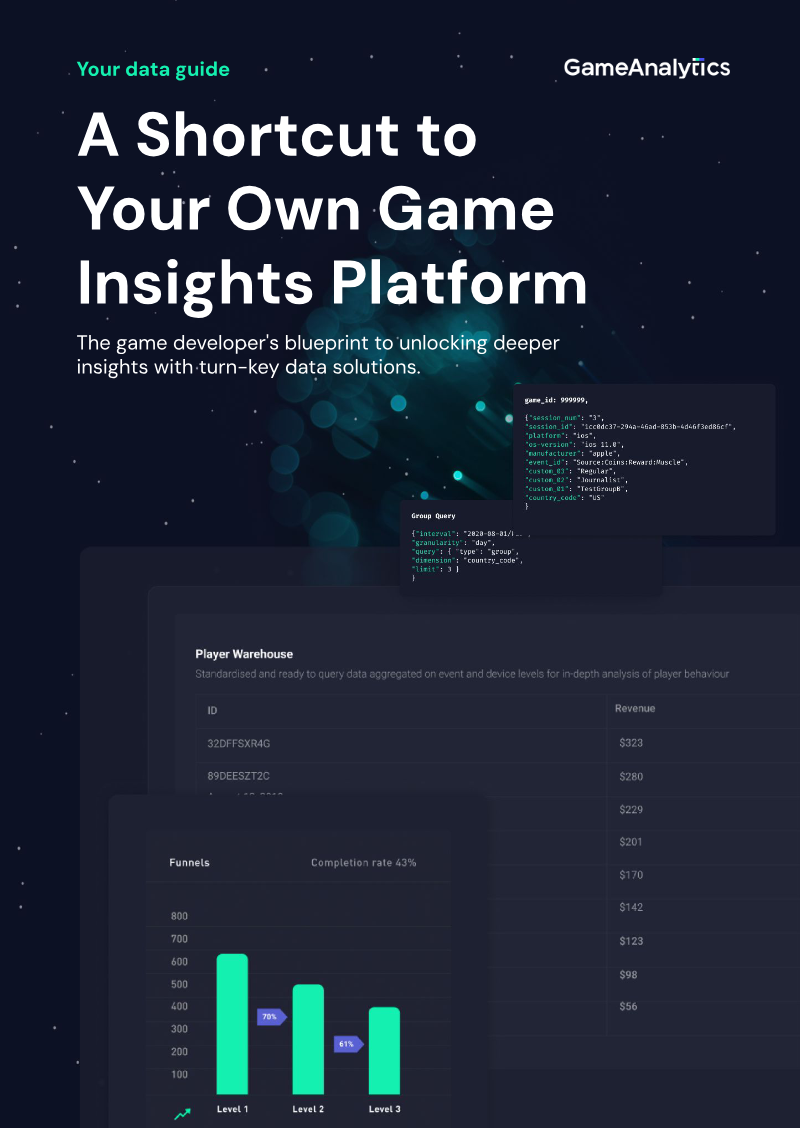
The guide presents a turnkey solution for game studios to build an in-house data pipeline without the high costs of custom engineering. It introduces two core offerings: Player Warehouse, a pre-aggregated data hub delivered in SQL or Parquet to BigQuery, Redshift, Snowflake, or Spark; and Raw Export, a real-time JSON stream that preserves all custom event fields for unstructured analysis. The document emphasizes that these services eliminate the need for proprietary SDKs, ETL development, and ongoing infrastructure maintenance, offering a cost-effective alternative to building a data lake from scratch. Key findings highlight that Player Warehouse provides daily refreshed event and player-level tables, enabling analysts to run advanced SQL queries, blend data from mediation or attribution sources, and retain up to one year of historical data. Raw Export supports real-time analytics, custom dashboards, and long-term enrichment through AWS S3 or BigQuery exports. The guide cites case studies—such as a VR MMO that leveraged Player Warehouse to boost engagement and a publisher that increased LTV by 50% across 19 titles using Raw Export—illustrating tangible ROI gains. The scope covers global game studios, with examples from iOS, Android, Steam, and VR platforms. Timeframes referenced include daily updates for Player Warehouse and real-time streaming for Raw Export, while the data pipeline supports integration with major BI tools (Looker, Power BI, Data Studio) and mediation/attribution services. Methodologically, the platform handles data ingestion via SDKs, normalizes events, and stores them in a cloud warehouse, abstracting SQL handling from end users. The document concludes by positioning GameAnalytics as a privacy-first, ISO-27001 and SOC 2 compliant partner that delivers rapid deployment—hours rather than months—for studios seeking scalable, customizable analytics.

GameAnalytics
WhitepaperYour Data Tracking Plan: A Step-by-Step Guide for GameAnalytics
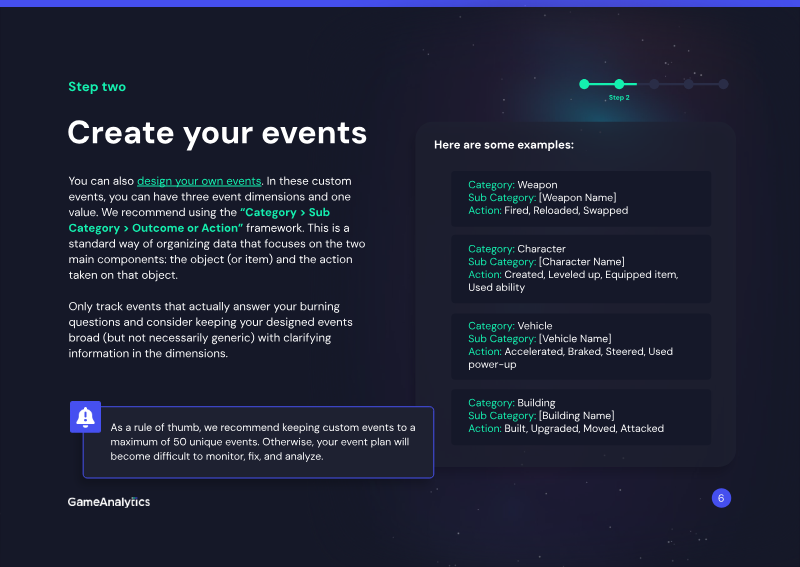
GameAnalytics presents a structured framework for designing and implementing data tracking within games, emphasizing the creation of a comprehensive tracking plan that aligns analytics teams with development stakeholders. The guide outlines five sequential steps: first, brainstorming core questions about player behavior and business objectives; second, translating those questions into specific events using predefined categories such as Session, Business, Resource, Progression, Error, Ads, and Impression; third, defining dimensions and attributes to contextualize events with user identifiers, device details, and custom fields; fourth, integrating the plan through GameAnalytics SDKs tailored to various platforms; and fifth, maintaining an iterative process that revisits questions and updates events as the game evolves. Key recommendations include limiting custom events to a maximum of 50 unique identifiers, adopting a Category > Sub-Action framework for clarity, and ensuring rigorous validation to avoid duplicate or misleading data. The document stresses the importance of consistent documentation, ownership assignment, and cross-functional collaboration to prevent redundant data collection and maintain analytical integrity. By following this step-by-step methodology, developers can establish a reliable data pipeline that supports accurate KPI measurement and informed decision-making throughout the game’s lifecycle.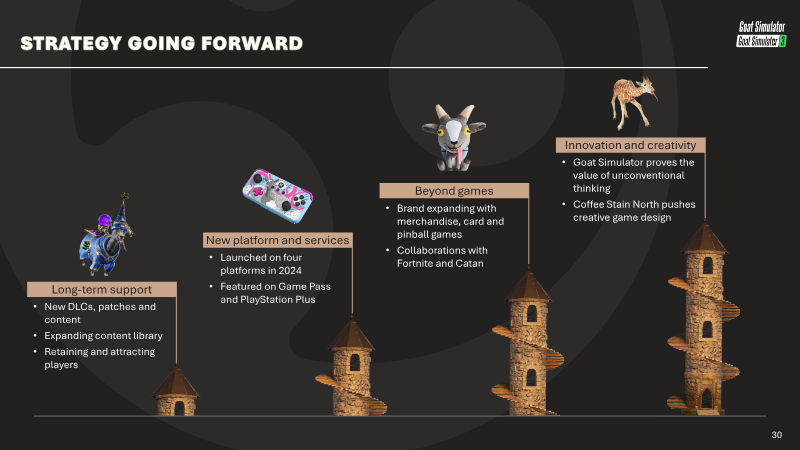

Coffee Stain Group AB
PresentationCapital Markets Event 2025: Coffee Stain Group
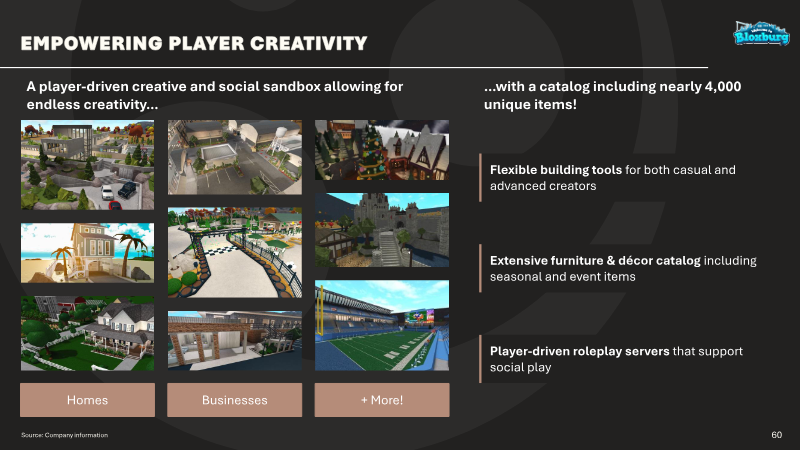
Capital Markets Event 2025 showcases the Coffee Stain Group’s strategy of building a portfolio around small, autonomous teams that prioritize gameplay quality and community engagement. Ninety percent of net sales derive from a handful of flagship titles—most notably Goat Simulator, Deep Rock Galactic and Satisfactory—which consistently achieve high review scores (above 96%) and generate lifetime sales up to SEK 2 bn. The company’s partnership model, publishing and investing in niche-focused games, sustains long-term value through continuous content updates and a symbiotic developer-player relationship. The global gaming market is projected to grow at 3% CAGR across all platforms, driven by rising consumer spend and the expansion of Steam, mobile, Game Pass and PlayStation Plus. Despite saturation and increased competition for player attention, Coffee Stain maintains a strong presence; its titles enjoy high review counts (over 500 k for Goat Simulator) and retain players through regular updates, platform expansions and community-driven development. Innovation, creative gameplay and long-term support are core to the firm’s approach. Strategic collaborations reinforce this model. The partnership with Tuxedo Labs leverages the proprietary Teardown physics engine, producing a highly engaged community (10 000+ mods, 20 major updates) and peak concurrent users of 60 k for Deep Rock Galactic seasons. The studio’s headcount grew from six to 47 FTEs over five years, illustrating the scalability of open development and a “make happy decisions” culture that drives both critical acclaim (e.g., 9.5/10 reviews) and commercial success. Coffee Stain’s Roblox title, Welcome to Bloxburg, exemplifies a successful free-to-play transition. With 791 k daily active users and SEK 1.35 bn in lifetime net sales, the monetization mix of currency purchases, optional unlocks and a premium subscription maintains a non-pay-to-win stance while rebuilding player trust. The company’s lean cost base and strong cash generation are amplified by launch-driven sales spikes from new content releases and strategic stakes such as its 30% share in Iron Gate’s Valheim publishing. Financially, the group reports a net-sales CAGR of 34% to SEK 1.2 bn and a cash EBIT margin of 44%. Cash reserves reach SEK 472 m in 2025, with no external debt, providing flexibility for capital allocation and potential M&A. The lean, autonomous team model underpins low overheads, high cash conversion (≈120%) and a focus on developing existing IPs while selectively pursuing new opportunities across platforms and partnerships.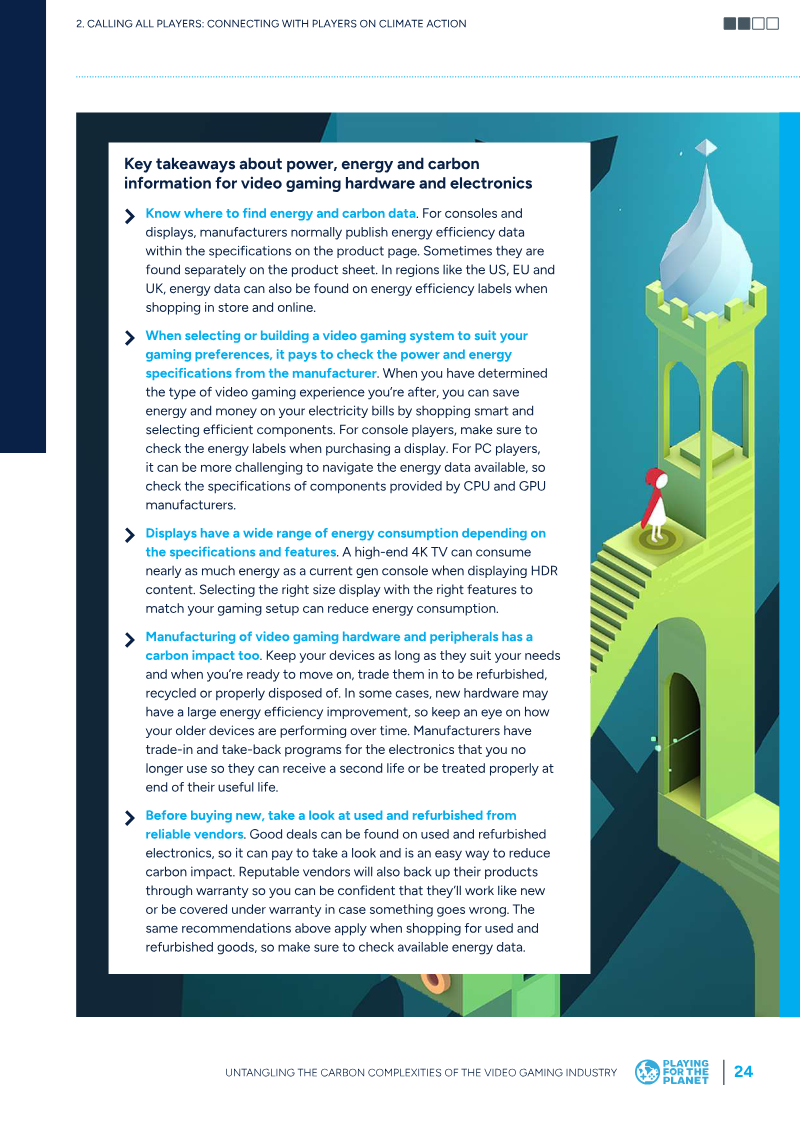

Playing for the Planet Alliance
ReportPlaying for the Planet: Untangling the Carbon Complexities of the Video Gaming Industry
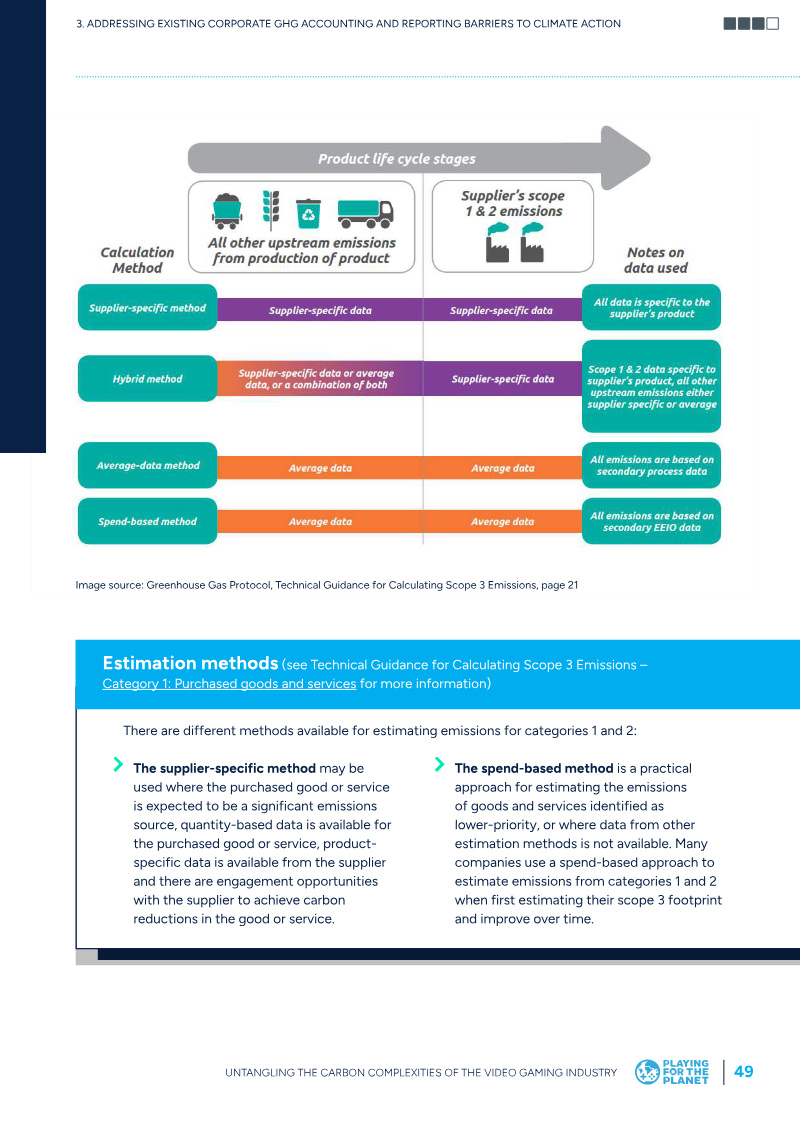
The analysis demonstrates that the video-gaming sector remains fragmented in its approach to carbon accounting, with only a minority of companies—12 out of 222 surveyed—committed to science-based targets. This shortfall stems largely from uncertainty around measuring Scope 3 emissions, particularly in categories such as purchased goods and product use. The report underscores a growing industry momentum: the Playing for the Planet Alliance now includes 42 members, and initiatives like the Green Games Guide and Ubisoft’s Climate School illustrate a shift toward embedding climate action within both operations and game content. Concrete progress is evident, for example, the Games Consoles Voluntary Agreement’s 54 TWh energy savings and the documented dominance of Scope 3 categories 1 (purchased goods) and 11 (use of sold products) in studios’ footprints. Carbon intensity across the supply chain varies markedly by hardware, display technology, and regional electricity mix. Current-generation consoles draw 150–200 W during gameplay, while PCs can reach 100–300 W; mobile devices consume only a few watts. A high-end 4K TV can match console power when running HDR, and the carbon intensity of 200 Wh ranges from ≈13 gCO₂e in France to ≈81 gCO₂e in the United States. These disparities highlight opportunities for reducing emissions through hardware efficiency, extended device lifetimes, and the adoption of renewable electricity or green tariffs. The report calls for consistent, industry-aligned reporting frameworks—particularly the GHG Protocol Scope 3 categories—and greater granularity by business unit or product. It recommends iterative, data-quality-driven methods for estimating Category 1 and 2 emissions, prioritising primary supplier data for high-spend items while applying spend-based factors elsewhere. For Category 7 (employee commuting) and Category 11 (use-phase emissions), detailed calculation examples illustrate the need to account for lifetime usage, regional grid intensity, and potential double-counting. Real-time accounting of use-phase emissions is identified as a critical research gap, with cloud and CDN providers’ inconsistent reporting underscoring the need for standardized data. Overall, the sector is moving toward greater transparency and actionable climate messaging, yet significant gaps remain in measurement, reporting consistency, and the integration of emerging technologies such as cloud gaming and AI. Addressing these challenges will be essential for credible net-zero pathways across the global video-gaming industry.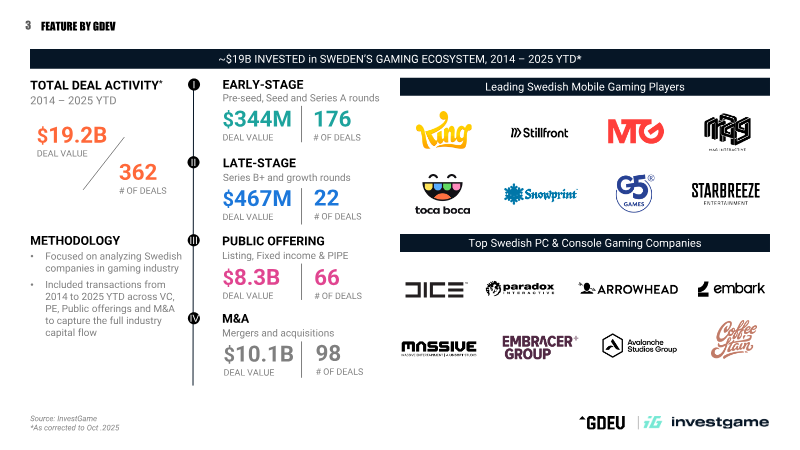
InvestGame
ReportThe Rise and Reset of Sweden's $19B Gaming Capital Machine
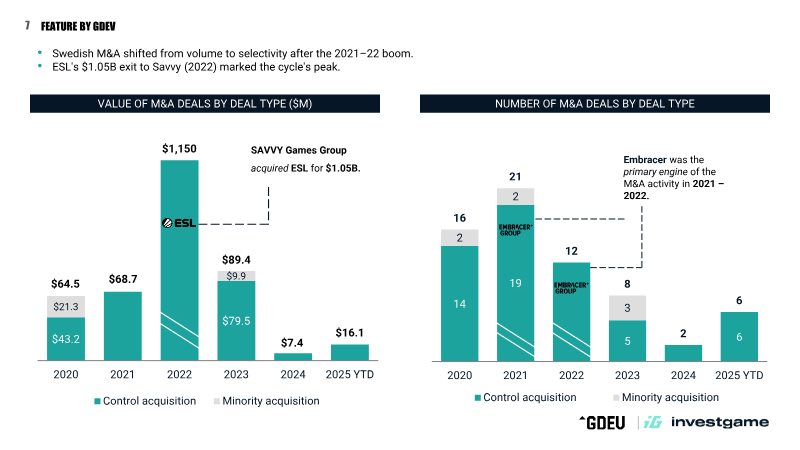
The analysis demonstrates that Sweden’s gaming sector has evolved into a $19 billion capital ecosystem, with 1,100 companies and 202 firms engaging in tracked transactions since 2014. Sweden contributes roughly 20% of Steam’s projected 2025 gross revenue, and its developers produced five of the platform’s global top-10 bestsellers in 2024–25. Capital flows have shifted from early-stage seed rounds to late-stage growth and acquisition deals, reflecting a maturation of the pipeline. Private investment rebounded in 2024 after a pullback; late-stage rounds now dominate, with Aonic’s $157 million growth round and Arrowhead’s $80 million investment illustrating investor preference for studios with proven commercial traction. Early-stage deal counts have normalized from 2021’s peak, indicating a steady but active pipeline. M&A activity peaked in 2021–22, with ESL’s $1.05 billion sale to Savvy marking the cycle’s apex; subsequent deals have become more selective. Three transactions—King ($5.9 billion), Mojang ($2.5 billion), and ESL ($1.05 billion)—account for 93% of total M&A value, underscoring the premium paid by global acquirers for Sweden’s IP and engineering talent. Public market activity has shifted from equity-fueled growth to defensive debt financing; Embracer’s $4.4 billion raised through fixed income and PIPE in 2020–22 exemplifies this trend. Capital concentration is high, with the top ten private rounds comprising over $495 million of an $811 million total. The data, sourced from InvestGame and market-cap records through December 2025, cover Sweden’s entire gaming industry—mobile, PC & console, VR/AR, esports, and platforms—from 2014 to the present. Methodology includes tracking VC rounds, public offerings, PIPEs, and M&A transactions across all segments. The findings illustrate a resilient ecosystem that has transitioned from early-stage bootstrapping to mature, high-value capital flows driven by proven studios and strategic consolidation.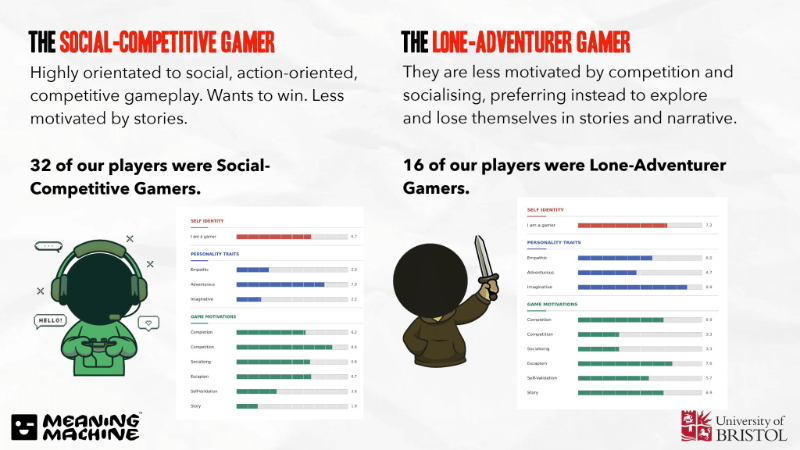

University of Bristol
WhitepaperWhat Good Are AI NPCs?: Lessons from a Large-scale Player Study
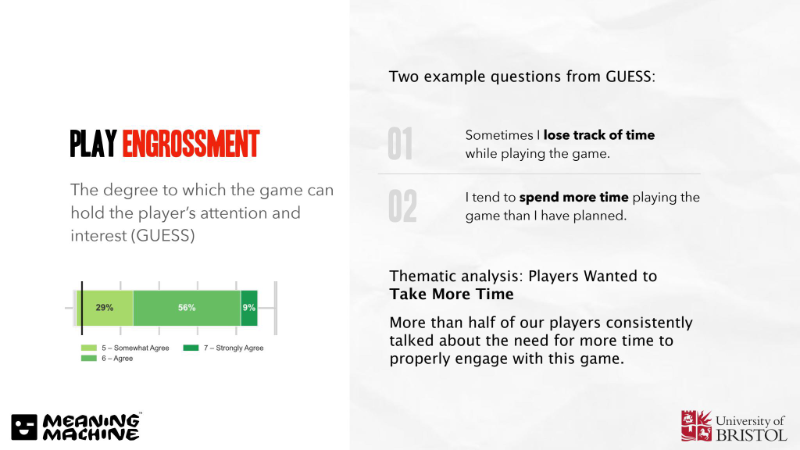
The study demonstrates that generative AI-driven non-player characters can deliver deeply engaging, emotionally resonant gameplay. In a 122-hour experiment with 68 participants, the “Dead Meat” demo achieved high immersion scores—97% UES reward and 94% focused attention—while keeping mental demand low (NASA-TLX scores of 64.7 for demand and 52.7 for performance). Qualitative interviews consistently cited the NPCs’ human-like dialogue and narrative depth as key contributors to player enjoyment. Quantitative data confirm widespread satisfaction: 96% of players rated overall enjoyment as high, and 90% praised the creative freedom afforded by the open-ended design. Subscale analysis of the GUESS instrument revealed that 60% achieved a top score for Creative Freedom, 65% for Personal Gratification, and 80% for Play Engrossment. Thematic coding identified freedom of expression, challenge-driven motivation, and immersive conversation as primary drivers of satisfaction, indicating that the game successfully balances agency with sufficient guidance. Player behavior analysis uncovered seven distinct strategic approaches—such as “Good Cop/Bad Cop” interrogation, “Rule Bender End Justifies the Means,” and “Smart Arse” manipulation—often combined within a single session. Participants responded equally to voiced and text-based NPCs, and the 20-minute session length encouraged replayability through role-playing different characters. Although the brief duration limited long-term insight, emergent strategies were viewed as a feature rather than a flaw. Future research will explore how authorial adjustments influence player responses across demographic groups, reinforcing the potential of AI NPCs to enrich narrative gameplay on a broad scale.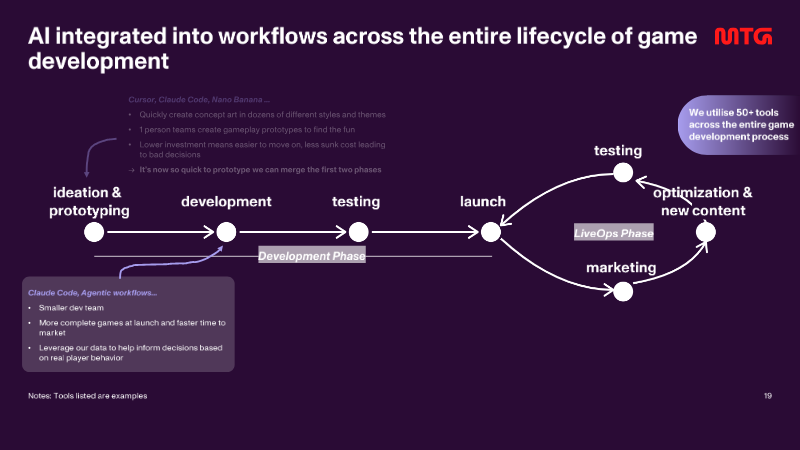

Modern Times Group
PresentationAI in MTG: Moving Beyond Theory
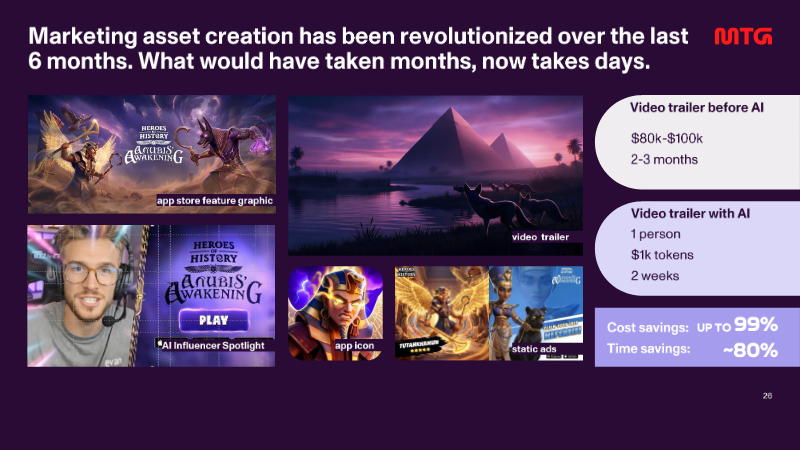
The document argues that artificial intelligence has become a strategic asset in mobile game development, transforming every phase of the lifecycle from ideation to live operations. It claims that AI enables teams to prototype, test, and launch content at a fraction of the time previously required, citing examples such as concept-art generation in days instead of months and single-person prototype teams that reduce sunk costs. The thesis emphasizes that the combination of trillions of player data points, world-class creative teams, evergreen intellectual property, and AI as a workflow enabler creates a competitive moat that is difficult to scale for rivals. Key findings include a 99% cost reduction in marketing asset creation, an 80% time saving on influencer spotlights, and a 75% reduction in analyst turnaround times when querying data through AI agents. The document reports that five new games launched in 2026 adopted an “AI-first” approach, allowing rapid iteration and simultaneous development of specialized content. It also highlights that AI agents can analyze A/B tests, suggest optimizations, and generate localized UGC-style assets to lower CPI and improve player engagement. The scope covers the global mobile gaming market, focusing on mid-core titles with large player bases. Methodology is implied through internal tooling: 50+ AI platforms (e.g., Claude, Cursor, ComfyUI) and BigQuery-based agents that process terabytes of data daily. The analysis suggests that AI integration not only accelerates production but also democratizes data insights, freeing analysts to tackle higher-level strategic questions.

CESA – Computer Entertainment Supplier's Association
ReportCESA Game Industry Report 2025: Launch Seminar Report
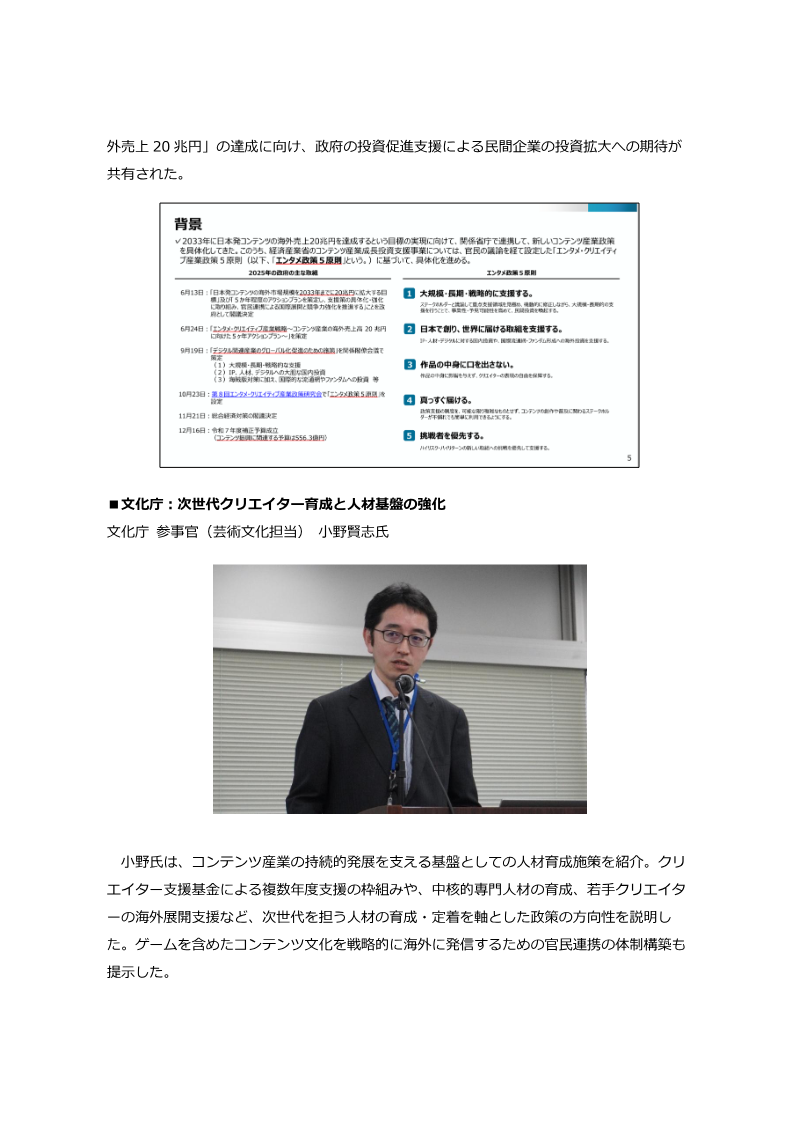
The CESA Game Industry Report 2025 Launch Seminar, held in Tokyo on February 20, 2026, served as a platform to analyze the evolving landscape of the Japanese gaming sector. The event introduced the updated 2025 industry report, which features expanded data sets and enhanced international market research to better support the global expansion of Japanese firms. The seminar aimed to address industry needs for technical knowledge sharing, talent development, and cross-sector networking among corporate and academic stakeholders. Key findings highlight a significant shift toward the integration of generative AI, with approximately half of domestic game companies now utilizing these tools within their development pipelines. While internal production workflows show high adoption rates, industry experts noted a more cautious approach regarding AI-generated content visible to end-users. Legal discussions emphasized the importance of navigating copyright frameworks, specifically distinguishing between AI learning and generation phases, while balancing innovation with intellectual property risks. Government representatives from the Ministry of Economy, Trade and Industry and the Agency for Cultural Affairs outlined strategic support for the content industry, targeting 20 trillion yen in overseas sales by 2033. Policy initiatives focus on multi-year funding, tax incentives, and robust talent development programs to ensure long-term competitiveness. Furthermore, legal experts underscored the increasing complexity of global regulatory environments, noting that Japanese companies must proactively manage diverse international requirements regarding data privacy, monetization, and rating systems. By synthesizing perspectives from government, legal, and development sectors, the seminar emphasized that strategic investment and regulatory compliance are essential for the sustainable growth of Japan’s gaming industry in a globalized market.
Quantic Foundry
Presentation