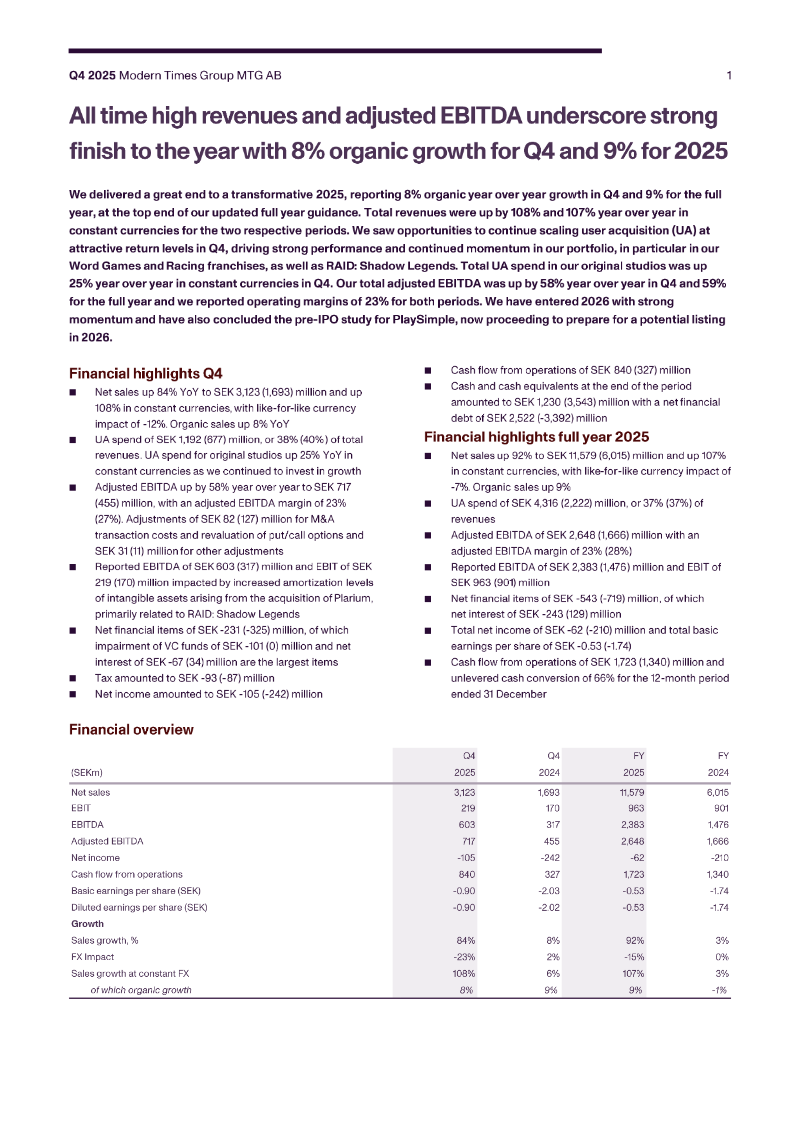
Market (Mobile)·Updated Apr 8, 2026 by Tenjin
Report · January 1, 2022
Published by Tenjin
The report presents a quarterly benchmark of hyper‑casual mobile games, focusing on cost‑per‑install (CPI), cost‑per‑lead (CPL), and retention metrics across Android and iOS platforms. In Q4 2022, median CPL rose modestly to $0.20 on both platforms, with Android up by $0.05 and iOS up by $0.17 from Q3, reflecting a tightening cost environment for user acquisition. Median CPI reached an all‑time high of $0.42, indicating higher spending per install during the period. Geographically, the analysis highlights top markets by ad spend. For Android, China, South Korea, and Australia remain leaders; France and the Netherlands appear as secondary markets. In iOS, the United States dominates CPI costs, followed by Japan and South Korea, with France and Germany showing notable increases. Mexico emerges as a new market experiencing CPI decline, while Brazil’s CPI rises to become the highest in its segment. Retention benchmarks reveal platform‑specific performance. Across all game tiers—top 2 %, top 25 %, and median—the day‑1 retention rates are higher on iOS than Android, with the greatest gap observed in top 2 % games (45 % vs. 38 %). Day‑7 retention follows a similar pattern, underscoring iOS’s advantage in sustaining early player engagement for hyper‑casual titles. Methodologically, the data derive from a sample of over 100 000 games tracked by GameAnalytics, covering Q4 2022 and comparing against Q3 benchmarks. The report’s scope spans global markets, with a focus on the most active regions for mobile advertising spend.
Median CPl on Android has increased by $0.05 Median CPl on iOS has increased by $0.17 Both platforms reached an all-time high in $0.20 median CPI in Q4 2022. $0.42
5 6 China 8 South Korea 10 Australia * France II * Netherlands 5 6 China 8 South Korea 10 Australia * France II * Netherlands
© Android - Median CPI for Top 10 Countries by Ad Spend in Q4 2022 When compared to the Q3 2022 report: No country has experienced @ South Korea and Canada Mexico is the only new country in a decrease in median CPI. experienced the highest the ranking, replacing France from increase in median CPI (0.06). the Q3 2022 rankings. $0.60 $0.58 0.40 R 0.45 $0.41 RRYR 0.33 0.30 0.20 0.24 0.00 R R 0.07 0.06 0.06 $0.03 R US JP CA KR # UK DE BR MX ID IN
5 6 China 8 South Korea 10 Australia * France II * Netherlands 5 6 China 8 South Korea 10 Australia * France II * Netherlands
© iOS - Median CPI for Top 10 Countries by Ad Spend in Q4 2022 When compared to the Q3 2022 report: USA has the highest median © France and Germany have Netherlands is the only new CPI decrease of 0.06. the highest median CPI country in the ranking, replacing increase of 0.08. Brazil from the Q3 2022 rankings. $0.80 0.60 0.65 $0.61 R 0.40 R O 0.54 0.49 0.46 0.43 0.39 0.35 0.33 0.20 2 RRO 2 R 2 R 0.21 R 2 R © O © RYOR 2 R Q $0.00 R R US JP KR CA AU -DE *UK NL FR CN
G GameAnalytics GameAnalytics is the #1 analytics tool for game developers, providing insights for more than 100k games, and 1/3 of the world's mobile players. GameAnalytics' goal is to empower game developers and publishers with priceless insights that help untap the true potential of their games. R
The report argues that non‑gaming mobile applications are experiencing accelerated growth driven by AI integration, short‑form content, and intensified user acquisition competition. Key findings show that Android dominates download volume—particularly in Utilities (79 % of installs) and Life Services (58 %)—while iOS generates a higher share of revenue, especially in Finance & Business (56 % of iOS revenue) and Life Services (57 %). In 2025, AI‑focused apps such as ChatGPT (+1,340 %) and Perplexity (+3,613 %) achieved the highest year‑over‑year download growth, and Short Drama titles like Kuku TV (+45 % k) and RapidTV (+498 %) recorded explosive revenue increases, with AI Social apps (e.g., Character AI +918 %) also driving significant monetization. User acquisition activity expanded across all major categories, with Life Services (+42 %) and Finance & Business (+43.5 %) leading the rise in app counts. Smart bidding adoption surged, with Target ROAS spend increasing by 50 % and Target CPE spending up 57 %, particularly in Utilities and Entertainment. Cost‑per‑install (CPI) analysis revealed that E‑Commerce on Android commands a 3× premium, while Finance & Business on iOS reaches 4.6×, underscoring high competition for transactional users. Monetization patterns shift toward in‑app advertising (IAA), dominating across Education, Utilities, and Entertainment. Video formats—rewarded and interstitial—outperform banner ads by 128–165× eCPM, with North America delivering the highest rewarded video eCPMs (up to 11.8× in Short Drama). The report covers global markets excluding Mainland China from January to December 2025, drawing on anonymized data from Mintegral and Insightrackr across 100+ key app categories.
The interim filing presents the fourth‑quarter 2025 financial results for a midcore‑casual gaming group, emphasizing a record‑setting revenue run and the successful execution of a transformation agenda that includes the integration of the Plarium acquisition and the rollout of a new district structure in early 2026. Revenue reached SEK 3,123 million, reflecting 108 % organic growth year‑on‑year and a 25 % increase on a constant‑currency basis, while adjusted EBITDA rose to SEK 717 million, delivering a 23 % margin that matches the full‑year figure. Unlevered free cash flow amounted to SEK 878 million, with a cash‑conversion rate of 66 % and a leverage ratio of five times EBITDA, underscoring robust liquidity and disciplined capital management. User‑acquisition spending accelerated, representing 38 % of quarterly revenue—up from 37 % in the prior quarter—and grew 76 % on a reported basis, driven by heightened investment in original studios, new casual titles, and the racing franchise. The direct‑to‑consumer channel expanded by 600 basis points to 32 % of total revenue, reflecting a strategic shift toward higher‑margin in‑app purchases. Across the fiscal year, the company posted a 9 % organic revenue increase, with word‑games, racing, and RAID franchises delivering the strongest quarter‑end performance. Operating cash flow for the quarter stood at SEK 840 million, while adjusted net income was SEK 1,390 million, translating to an adjusted EPS of SEK 11.33. The financial outcomes exceed guidance and position the firm to meet its medium‑term outlook, with a pre‑IPO study for PlaySimple concluded and the midcore transformation progressing as planned.
Modern Times Group delivered a record‑setting performance for the fourth quarter of 2025, underscoring the company’s momentum in the digital entertainment sector. Organic revenue expanded by 8 percent, which translates to a 108 percent increase when measured in constant‑currency terms, and net sales reached SEK 3.1 billion. These figures reflect the strength of the group’s core portfolio and its ability to generate growth despite a volatile macro‑economic environment. A pivotal element of the results was the integration of Plarium, which was completed on 12 February 2025 and consolidated from 31 January. The acquisition contributed SEK 5,384 million in sales for the quarter and produced SEK 495 million of income before tax, after accounting for SEK 786 million of purchase‑price amortisation. When the acquisition is modelled as if it had been in place from the start of the year, total sales for 2025 would have risen to SEK 12,137 million, with pre‑tax income of SEK 398 million, albeit offset by SEK 1,269 million of amortisation. The combined impact of robust organic growth and the strategic addition of Plarium positions Modern Times Group as a leading player in the global gaming market. The financial outcomes demonstrate that the company’s acquisition strategy is delivering immediate scale and profitability, while its underlying business continues to expand at a pace that exceeds prior expectations. This performance suggests a durable growth trajectory for the remainder of the fiscal year and beyond.
Rewarded Returns explores the evolution of reward-based user acquisition (UA) from its origins as a controversial incentivized traffic tactic to a sophisticated, data-driven pillar of modern mobile game marketing. The primary thesis is that technological advancements and deeper reward structures have effectively addressed legacy concerns regarding fraud and user quality, positioning rewarded UA as a high-performance alternative to traditional channels in an increasingly challenging privacy-centric landscape. The findings are based on a late 2024 survey of 502 mobile game developers in the United States and United Kingdom, primarily representing mid-sized companies with 50 to 100 employees. While 64% of respondents characterize the current UA environment as challenging due to privacy rules and high costs, 77% have already integrated reward-based campaigns into their strategies. Among these adopters, 82% report that rewarded campaigns outperform traditional UA, and 95% believe these strategies provide a distinct competitive advantage. Furthermore, 79% of developers observe stronger long-term retention from rewarded users compared to non-rewarded sources. The study identifies a significant shift in perception, noting that fraud concerns for rewarded UA (47%) are now nearly identical to those for traditional channels (46%). Despite these lingering concerns, 59% of current users plan to expand their rewarded UA budgets in 2025. Among non-adopters, 62% express concern about falling behind competitors, and 43% intend to adopt the strategy in the coming year. Looking ahead, the scope of the industry is expected to expand, with 90% of experienced developers predicting that reward-based mechanisms will move beyond mobile and web into console gaming. The conclusion emphasizes that as the industry moves toward 2025, real-world rewards—particularly cash and gift cards—are becoming a fundamental discovery and engagement mechanism rather than a mere experimental tactic.