ReportTenjin
Ad Monetization Insights for Mobile Game Developers 2022
1 Jan 20221 pages~1 min full read
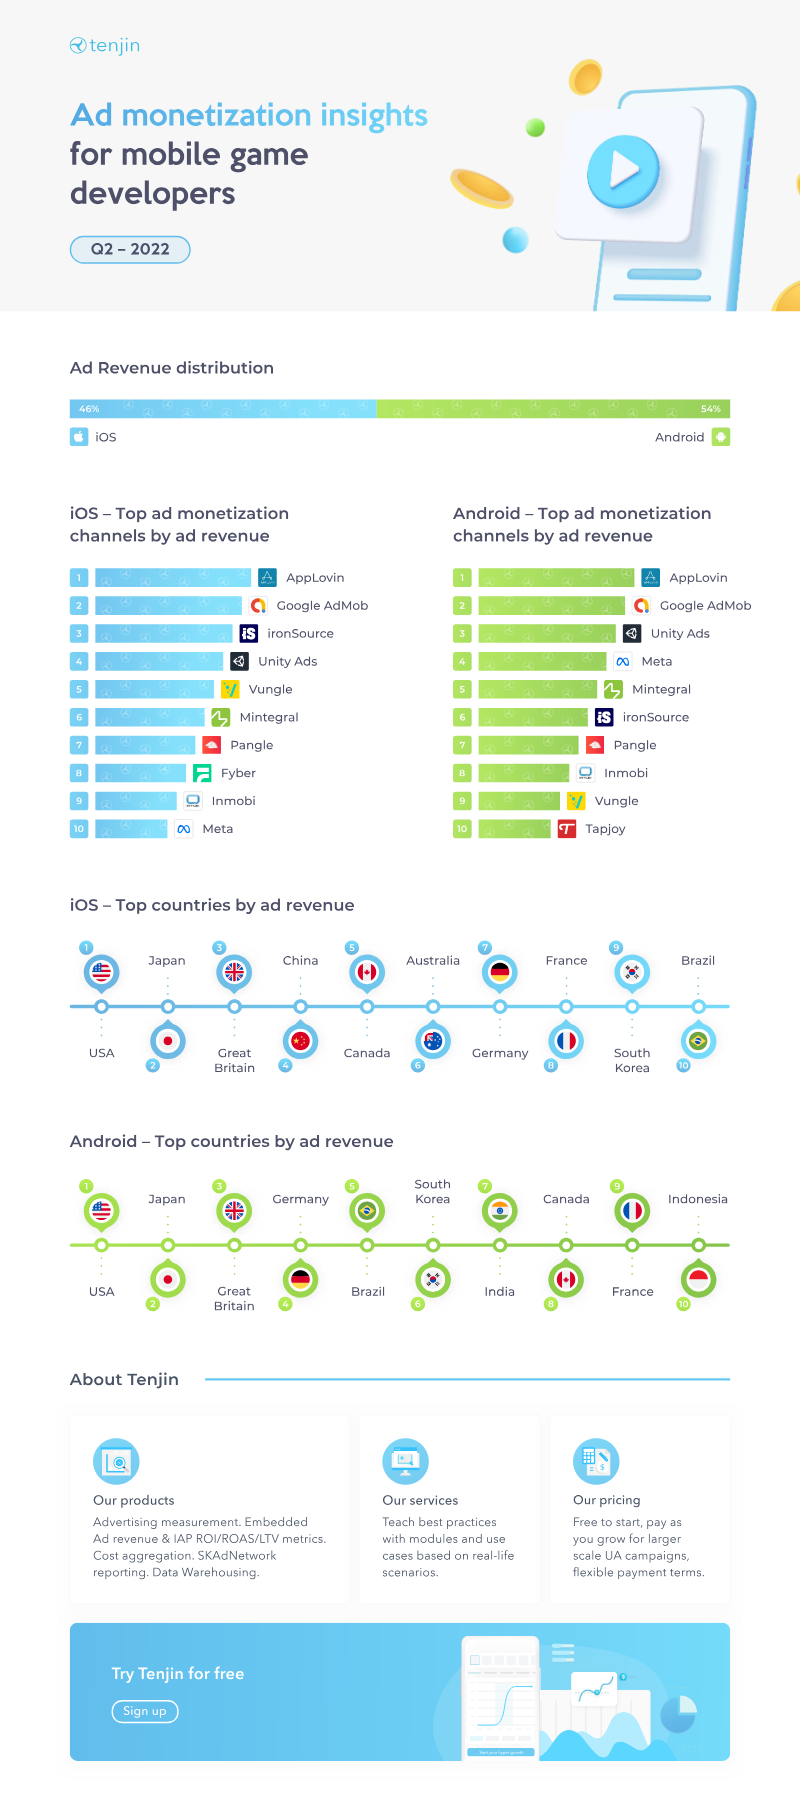
Advertising accounts for 54% of total revenue across the mobile game markets surveyed in 2022.
Effective monetization requires integrating ad revenue, in-app purchase data, and cost metrics to accurately calculate ROI, ROAS, and LTV.
Key regional markets for mobile game monetization include Germany, Japan, South Korea, Canada, and Indonesia.
Developers must utilize tools that support SKAdNetwork reporting for iOS environments and aggregate cost data across both organic and paid acquisition channels.
Tenjin offers a measurement platform for ad revenue and cost aggregation that operates on a free-to-start, pay-as-you-grow pricing model.
Localized user acquisition campaigns are essential for optimizing cost structures and improving return on ad spend in specific global territories.
The 2022 ad monetization briefing delivers a data‑driven overview of revenue‑generation strategies for mobile game developers, emphasizing measurement, optimization, and regional performance trends. Core insights reveal that ad‑based income accounts for a majority share of total monetization, with a highlighted 54 % figure indicating the proportion of revenue derived from advertising across the surveyed markets. The analysis spotlights key territories—Germany, Japan, South Korea, Canada, and Indonesia—illustrating how each region contributes to overall earnings and how localized user acquisition (UA) campaigns influence cost structures and return on ad spend.
A central theme is the importance of precise analytics to drive return on investment (ROI), return on ad spend (ROAS), and lifetime value (LTV) calculations. The briefing outlines a suite of measurement tools that aggregate ad revenue, in‑app purchase (IAP) data, and cost metrics, integrating SKAdNetwork reporting for iOS environments and offering flexible data‑warehousing solutions. These capabilities enable developers to assess campaign performance at scale, compare cost aggregation across organic and paid acquisition channels, and refine budgeting decisions based on real‑time insights.
Tenjin’s platform is positioned as a turnkey solution for developers seeking to embed advanced measurement modules without upfront cost, operating on a free‑to‑start, pay‑as‑you‑grow pricing model. The service package includes advertising measurement, cost aggregation, and data‑warehousing, designed to support both emerging studios and larger publishers in optimizing ad revenue streams. While specific methodological details such as sample size or data sources are not disclosed, the briefing draws on 2022 market data to inform best‑practice recommendations for maximizing monetization efficiency across the highlighted global regions.