Nature vs. Nurture: Unpacking Player Spending in F2P Games
24 Jun 202159 min video
Transcript
[Music] um so today we're here to talk about unpacking player spending in free-to-play games first i'm gonna tell you a little bit about me who am i that's a great question i'm vp of insights and analytics at congregate and i do some other stuff other than games and i've had a fair amount of experience in the industry and i have great help when building decks um so telling you a little bit about congregate first so congrate has been around for 13 years now we started as a web platform we're also a mobile publisher we have over 200 million mobile installs since 2013 over 10 million monthly active users over 60 games published and over 120k games on the web
and a lot of the data that i'm going to be using today is from those games so what's really interesting about being a publisher in a web platform is that we get access to a lot of data so we can do these analysis across many many games and get some understanding on general trends across all of these free-to-play games some games that we've published adventure capitalist animation throwdown i'm going to use both of them a fair amount today and a couple of other more recent games as well so what can you expect today i really hope i can deliver on that promise of analytics and insights and be able to share with you as much data as possible go into a little bit deeper analysis intermingle some examples in there hopefully it's a lot of data that is very useful and that gives you not a checklist of best practices but
more of a framework on how to think about monetization my goal is not to give you hey go implement this feature this feature and this feature that's up to you on how you do that my goal here is to give you ideas and inspiration and develop what works best for your game all right so to warm up a little bit uh and please don't be shy we're among a small gathering of friends um can you please raise your hand if you've ever played a free-to-play game cool leave them up leave them up leave them on all right uh who can you put your hand down if you've only played a free-to-play game for work cool awesome uh can you okay lower your hands don't get tired uh can you please raise your hand if you've ever spent on a free to play game all right
plenty plenty of hands but not as many and you can put them down uh can you raise them again if you've only spent for fun not for work so wave your hands and even though it was a fair amount of hands up there you can see that was a small group of people or a smaller group of people and it's this is even a audience and people of the industry that know how things happen how the sausage is made why you should spend and it's still a small percentage of people so that is basically why we're here to talk about spending and free to play games so over the years the free-to-play industry has really matured how we think about monetization we've learned things over the years we've diversified our revenue sources
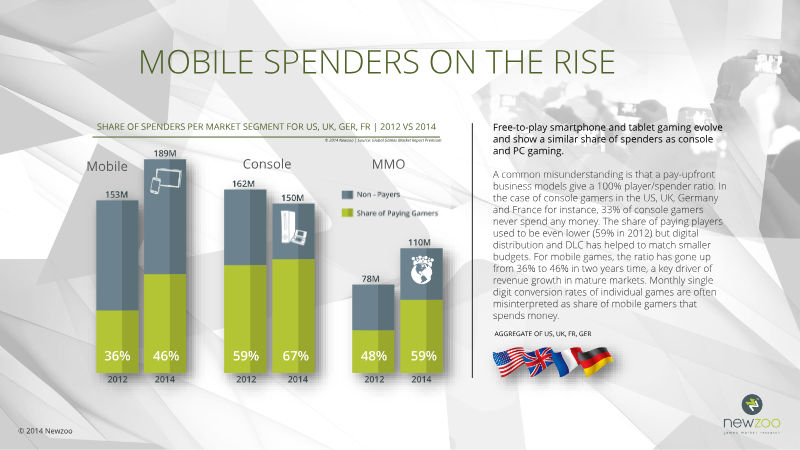
but at the end of the day you know even looking at our own revenue sources for congregate in-app purchases are still a big chunk we've been able to diversify this but it's still extremely important and throughout all these years one of the things that i was i was googling for preparing for this talk i was like okay let's see what the conventional wisdom is on the internet because obviously that's a source of truth and most blog posts and uh you know deconstructs from 2012 to today they all kind of have two big pieces in there most players will never spend in your game and most revenue will come from a small very small percentage of players but now we know iep is important but where do these learnings come from
we should not take these at face value we should continue to validate whether this is true and we should be able to understand it further we have more data now so first i'm going to start by validating some of these kind of conventional wisdom pieces of wisdom and then i'll dive into understanding what's happening with spending patterns and free to play spending so a little bit of a philosophical question um can anyone that walks into your game can become a spender and it is a question that's hard to answer but we can at least look at some data to better understand um you know what what the patterns and trends tell us if we look at percent buyers we split this across genres of games that we've published at congregate and we looked at how many players have ever spent
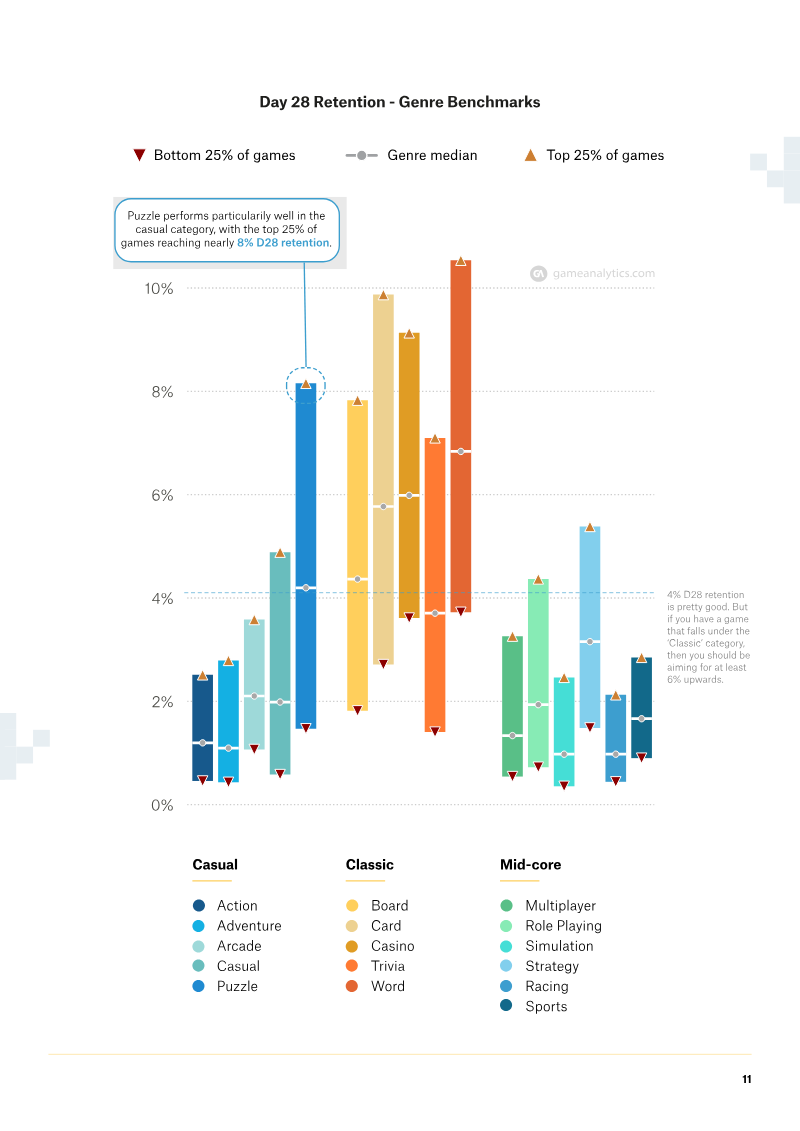
and looking at it by genres we have a few games that are casual and hyper casual idol incremental games makeover games so you can see that the ranges are different but it's still a very narrow band in fact most games see kind of a max of five percent of players will ever spend so it kind of does does validate that idea of a very few percentage of players will ever spend on your game but i wanted to validate this a little bit further so i'll look back to congregate.com as i said we have a lot of games up there so i took the same time frame 2014 to today or yesterday and i took the top 500 games and it's a little bit of a busy chart but at the bottom it's the rank by revenue and on the y-axis is the percentage of
payers and what we can see here is that most games fall on the one to three percent buyer rate so it kind of it validates what we're seeing on on mobile games and across many many more games a bigger pool of games and uh you know it's we see there a little bit a few games going up five percent six percent but it's still this narrow band i will caveat a little bit uh this looking back kind of 2010 2011 uh 2012 congregate that get a lot of asian mmos uploaded and very popular on the platform and those games i exclude them intentionally because they have very different mechanics and they do see very different metrics and at that point we are seeing kind of go beyond those ranges but it is not representative of like
the majority of recent games that we've seen so this took us to the next question are some players more likely to spend than others so is there something there that some players have this inclination to or like a higher likelihood to spend so what we did here is um you know looking at our games in the portfolio see have they gone from one game to another have they spent in both games all right so taking the total spenders have ever spent on a single congregate game on mobile we saw 40 percent play two or more games and from there 17 percent of those spend on at least two games and while this doesn't give us a
concrete answer what it does start hinting at is that these players are not your random player if we were thinking about that five percent that you know you're any player on the street or likelihood of them spending uh only five of them will ever spend in this case it's much higher so it is starting to tell us something about you know there's certain players that are more willing or come in with a different expectation on whether they will spend on a game or not all right so to summarize a little bit what we've seen up to this point our conventional wisdom holds i would say some players are more likely to spend than others and this is what gives us that narrow band of spenders or percent buyers and i have a little note there that says please don't call them whales this is a call out to
a talk from congregate ceo emily greer she gave many years ago and i really really like it because calling them whales kind of takes this human piece out of the person we're just like hunting for whales and they're much more valuable to us and than that they're real people that are passionate about the games that we're building and we should treat them with that respect all right so other than that little side note uh the reason we want to talk about spend on monetization is because at the end of the day free to play lives and breeds out of being able to monetize so successful games you know you want to live operate your game for many many many years and the way to grow your game is grow your ltv grow your arpu that is you know you want to maximize your player's lifetime value
or some people call it average revenue per user and yes but how or how can i measure my progress or how can i focus my efforts if lifetime value i can only measure it at the end of the lifetime how can i focus into knowing that i'm changing and moving the right metrics and putting the right content into the game that's going to give me that result so it all starts with the kpi letter soup and some of us are very used to just throwing acronyms out there and in fact what i've encountered is that some companies use them in different ways so i wanted to kind of just go through them quickly so that you know what i'm talking about so we start with arpu average revenue per user and i'm going to use that
to also kind of reference lifetime value we have our poopoo average revenue per paying user so this is all only your payers we have your percent buyers some people call them percent buyers percent payers percent spenders are dow average revenue per daily active user so this is once you start looking at daily metrics arpt average revenue per transaction so how big are those transactions conversion rate some people call it first-time spenders some people get confused with conversion rate and percent buyers percent repeat spenders so once they spend once do they spend again number of transactions retention lifetime sessions m-a-u-d-a-u but the first acronym i used
was kpi and we forget that the first part there kpi is key performance indicator so how can i be measuring my key performance indicators if i'm looking at 20 metrics so the rest of today i'm going to spend digging into this to hopefully unearth what we can actually think of as our key performance indicators for monetization and it starts with understanding that not all kpis or metrics are created equal some will give us more insight than others some will give us more actionable insights than others and some are more relevant and more aligned with your goals and for uh today that goal and what we're talking about is increasing your arpu or your ltd
so what we can do to understand this is determine which kpi matters the most so how can we do that back to our goal we want strong arpu what we can do is figure out which kpis have a strong relationship with arpu so in that case if we move that kpi we will hopefully be moving our arpu and at the end of the day we can focus on these to get the most out of the time that we're spending on our road mapping live operations content generation new feature releases and how can we do this so it is time for some correlation analysis um so
what does this mean that you can learn all the math but you can also go and use excel or r or python and actually do this very easily and quickly and we can model the relationship between two variables in our case two kpis and the question that we're trying to answer is can one kpi influence the other and we calculate our r square what does what does it mean why does it matter what r square tells us and i'm going to use um i'm going to show you the r squares of all the correlations that i did is if we are close to zero there's no relationship between the two things that we're comparing if it's one you're like predicting the future almost but there's there's a perfect correlation i've never seen that all right so which kpis have a strong relationship with rboom
and i'll keep coming back to this and similar to how i showed the percent uh buyers by genre i will be showing all of these kpis and their ranges and one thing to keep in mind is that it doesn't mean the game within that genre because you might be like looking at this and be like oh i have an idle game and it's not that number it's higher or it's lower games can fall outside of these ranges what i try to do is narrow it to the most frequent behavior so before we jump into our first correlation i want to uh kind of go a little bit about uh through how to read a bunch of the charts that we're about to look at so in every chart uh the dots uh signify one game and the color is the genre reason i did this is because for some
correlations we're gonna go a little bit deeper and split it by genre because in some cases that starts to have an impact on the x-axis we're going to have what we call the independent variable which is basically the thing that we're trying to see if it impacts the other thing and sorry translations okay and on the y-axis we have our dependent variable one quick technical note for the math nerds in this case monetization variables tend to be curves which means that a linear regression wouldn't have worked for all of this analysis so the numbers that you see on the axis that's why i love them super small because they don't mean anything i actually transform the numbers to take the logarithm values and be able
to do a safe linear regression that actually means something all right with that out of the way time for some correlation analysis first we looked at sessions and it all starts there right we need players playing the games and i used sessions as a proxy for engagement the reason i did this is because it's universal to all games and you know if you do you could do retention or days retained some other types of of engagement but different games will measure it a little bit different and it will impact that so i chose this you can choose another uh metric to do this so on the correlation what we saw as a correlation or r square of 0.46 and asking our correlation meter
it said that is pretty good and the reason it's pretty good is it's really hard especially in kind of more behavioral analytics to get to higher numbers like some other fields will want to aim for much higher before they call it good but for behavioral analytics you know getting to this 0.46 range is already a pretty good correlation and you know if you think about it this makes sense the longer someone is in the game the more they will probably spend all right so that's that's good we want to keep players but we're going to be talking mostly about monetization next uh i looked at average minimum price point that players uh spend on so what this means is on average for a game what's
what's the lowest amount that players spend and what this means is it's either we're offering very low price points if the number is very low or the lowest price points are the most popular ones here's our pretty graph and asking a looking at the r square is 0.31 which it's not great and the reason i wanted to look at this is because i often hear people say you know you just need to get a player to spend even if it's at a low price just get them to spend 99 cents and then you're good this actually tells you that that's not the case let's go to the flip side max price points same approach with max points reason i wanted to look at this is some teams are
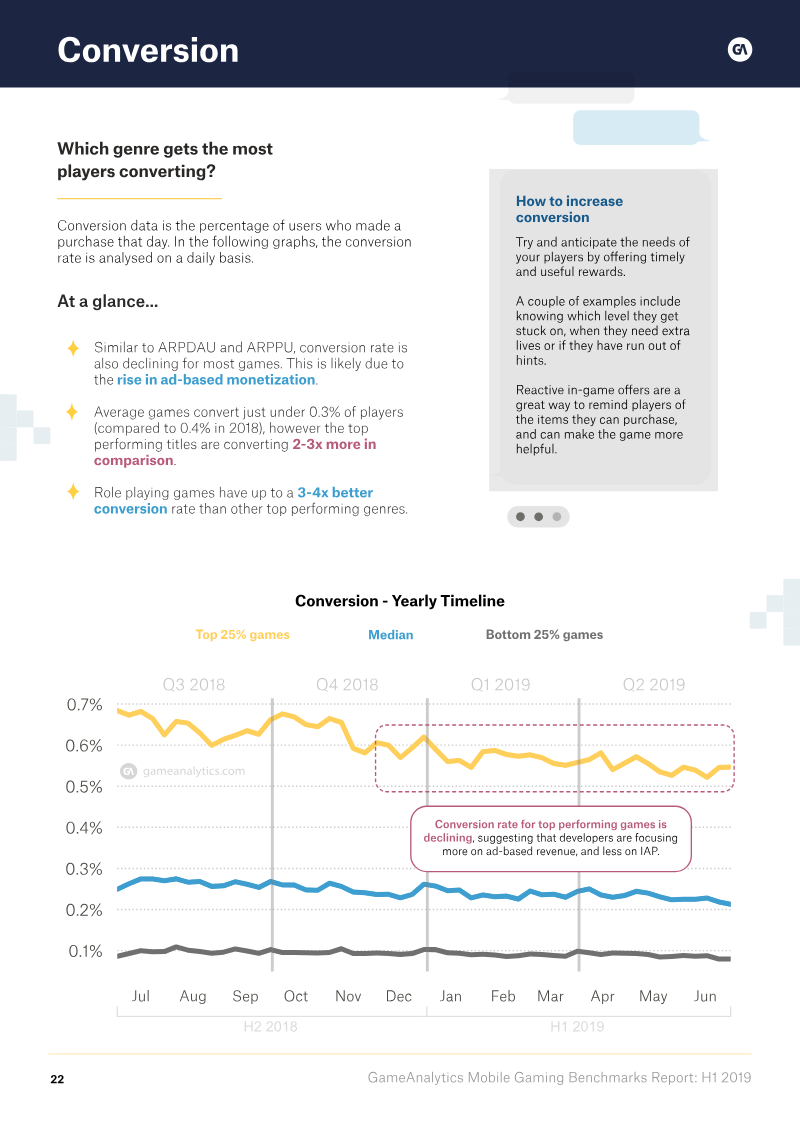
scared of prices and the reality is don't be scared of high prices don't be scared of offering items and content at very high prices if you have the right offering players will want to buy it so looking at our r square 0.6 that is that is really strong so low prices not great high prices great now let's look at the average so for this i took average revenue per transaction that's what the acronym means and this is the the average transaction size basically and looking at our r square 0.5 that is really good so what this is telling us is that the higher transaction size on average
the higher the rpu will see to recap what we have so far sessions matter this is where it all starts make a fun game we're going to talk a lot about monetization and and revenue but what really matters is to start with a fun game and price point matters they really matter so we're going to take a little break from correlations and dig into pricing all right i wanted to start with a little concept of this is your game your game is kind of like a monopoly it's its own economy you are the only person offering those goods
so if you are animation throwdown you are the only one selling gems and jiggity watts and golden turrets and all sorts of other funky things and you need to look at your game to determine how to price your game so how should you decide your game's pricing it all starts with elasticity of goods what does that mean well there's two types of goods imagine your gems animation throwdowns gems if we were to decrease the price of our gems and our revenue decreases that means that we might have gotten more purchases by lowering our price but the revenue
decreased so the gems are what we call elastic basically demand moves with price now if the revenue decreases sorry that was revenue increasing so revenue increases more purchases jams are elastic revenue decreases purchases go up slightly people are excited about this but not enough to make up for you dropping your price what that means is that gems are inelastic and you can think about that with is it moving with the price elastically or not so which one is uh gems or or virtual goods and the reason this is important is because it helps us understand how fluid you can be with your pricing
for this i am taking uh an example or case study from one of our games that venture capitalists by a studio up in canada called hyper hippo and this is from about a little bit less than a year ago so about a year ago the team had a first-time buyer special prized at 7.99 and they they were wondering what happens if we lower the price we'll get more people to buy it what happened let's look at the first purchase rate because this is a first-time buyer bundle and what happened is that demand just went up like crazy so way more people were buying this even legacy players that had never converted you know people had been playing for a year or longer had never converted
saw this special and went for it but did this actually help revenue for this case we can look at our arp dow and i average revenue per daily active user and i will caveat that games are messy ecosystems and try to control this information as much as possible to look at just you know one piece of of one segment in the game right when the price was lowered our armed out declined drastically which means that our revenue declined so back to our original question are virtual goods elastic or inelastic well purchases went up check it did not compensate
for the price drop check revenue decline check unfortunately so this starts hinting at virtual goods are mostly inelastic and i know that you're all very worried that revenue declined so good news the team identified this quickly they reacted right away oh what's good with the capitalist world another question i often hear around pricing is okay cool elasticity and elasticity i don't understand that econ but uh what if a lower price point will help me get players to spend again so maybe it's not all about that single purchase it's about what comes after that i get them to spend once they spend again so for that i looked at repeat purchase rates so
starting with the overall portfolio looking at the second purchase rate and what we see across all our games so we we had seen um an uh sorry i'll show split by genres but just the average across our whole portfolio fifty percent i'll use that as her baseline and then we'll compare it against uh buckets what these buckets are is the price point of the first purchase so someone spent uh their first purchase was between a dollar and four dollars they'll fund fall under that bucket and we'll see if they have a lower second purchase rate for lower prices they don't uh it's slightly lower so for that lower price point
uh we don't see better chances to get a second purchase when we get to the five to ten 10 price range it's about the same as the overall portfolio and higher price price points much higher repeat spent this means that lower price points do not increase repeat spend we found that our sweet spot and that's why you see that most of our games fall under that is between 5 and 25 but it really depends on the game so what i would recommend is that you find your sweet spot the sweet spot for your game it might be a little bit higher it might be a little bit lower next there's there's another piece to
purchasing and the first purchase that players see which is that they set expectations so looking at how high or low is the second purchase compared to the first one what we see is that most players that first bucket 48 of them their second purchase will be at a lower price point than their first purchase 32 will be right at the same price point and only 28 of them will spend at a higher price point so if you price too low your initial offers you don't give yourself or your players wiggle room to go down on that price point
back to ad cap because they they kind of did this so looking at lifetime transactions based on their first purchase and i have the players who spent their first purchase was that 799 special that new 299 special and then everyone else that first purchase was somewhere else and what we see is that for those who spend their first purchase was the the lower price point they they have higher number of transactions throughout their lifetime cool but the revenue per transaction is lower and that results in the overall rpoo for those players or the average revenue per paying user so how much they're going to spend in their lifetime was much lower as you can see so these two things combined tell us that price angering is a real thing
what does this mean anchoring is that it's it's a cognitive bias that we humans even though even if we're like no i'm not going to do that it's there we use the first piece of information to make future decisions and remember your game is your monopoly so it means that a player only has your game to make comparisons so the first prize or the first offer that you present to that player will really set the expectations and perceptions and impact the decisions that they will make for future prices what this all means is don't set too low of a bar it's not going to help with repeat spending and it's not going to uh help with if they do repeat spend with
what what are they going to choose to buy on that second purchase cool tammy so should i just increase all the prices in my game no it is it is a careful balance and the price that you put in front of a player has to be justified by the value that you're offering so to summarize our little pricing detour correlations with arpu low price points or minimum transaction size doesn't matter having higher matters average transaction size matters games are mostly inelastic and watch out for price angry now back to our correlations our original question was uh relationships with arpu and next up we're going to look at percent
buyers how many players will ever spend on the game these are the ranges that we had already talked about and asking our correlation meter all these mugs that's very strong uh and that's that's fairly intuitive right the more players i have spending that's better but it's also good to see it in the data and just back to this idea that what i started with is that only a narrow band of buyers will ever spend that is true but it is still important to make sure that you're getting those players and i have one more correlation for you with arpu which is average revenue per paying user or arpu my favorite one because it's fun to say and you can see that in in this case the
ranges are pretty different as you go from genre to genre all right so let's look at this 0.69 that is that is really strong but the ranges were different for for different genres so i went down and and separated this by genre and see how it impacts the the correlation between your our poopoo and your harpoon mid-quarter games that is very very high what does that mean high investment per pair really matters for these mid-core games and it is fairly intuitive right it's games where players come with the expectation that they're going to go very very deep both in game play and spending idle games it's actually still really strong and i
wanted to have this because there's this misconception that you know more casual games it doesn't matter as much it does having strong you know encouraging this strong investment per payer is really important and for casual games not as high still decent but it also makes sense you have a wider audience and it relies on kind of different monetization mechanics so to summarize our poopoo or investment per payer also matters and it varies by genre so we already saw so we already saw that percent buyers and our people are really really important so i decided to go in and say you know ask the question which kpis have strong correlation to these two kpis that really matter and starting with sessions
sessions and percent buyers very strong it makes sense again the more time a player spends in the game the likelier they are to invest in the game next up repeat spending and arpu and in this case is it what it means is that enabling steady investment from players who want to spend will give you a long a high investment from those payers so you want to get them to that second purchase you want to get them to that third purchase that fourth purchase you want to really get them going through that funnel and splitting that by genre a lot of people forget to track this the second purchase rate and it's very very important you already captured the people that were willing to spend
but you want to make sure that they're satisfied with their purchase now how can you measure that a very good way to measure that is do they spend again so keep a percent repeat spending in mind when you're monitoring your kpis a quick example i'm going to go super quick through this because i think i'm running out of time i wanted to use animation throwdown as an example here because we see that they really have best in class repeat span and this is by a studio up in chicago called synapse games a little bit of history about synapse is they've have three ccgs or card collecting games in the market already and they've iterated taking what's working from those games to the next one and improving what isn't in 2013 they released a sci-fi
one called tyron unleashed the next iteration in 2015 was trying to reach a broader audience kind of a fantasy theme spellstone and in 2016 we released animation throwdown with with all five ips and a lot of very fun ride in getting that ready to launch so looking at their second purchase rate so i'm just highlighting this is the the purchase funnel but i'm just highlighting the second purchase tire and unleash had incredible repeat purchase rates so from all the players that spent 75 percent of them spend at least another time that is huge and it kind of makes sense it was a very niche uh hardcore game so next iteration spellstone we saw a little bit of a drop but still very very strong 67 percent for
spellstone with a more approachable theme but still very strong uh monetization metrics an animation throwdown 62 percent it's still really strong more than half of the players who spend ones will spend two times and we were able to reach a bigger audience even though the metrics took a small hit so it was kind of this balance between reach and strong monetization why and what do they do to be able to kind of repeat this over the course of the years and multiple iterations of the same type of game is their live service strategy so it has a very well defined and this is for animation throwdown i just took a month for example or six weeks very strong and well-defined cadence of events and just quick uh info on the structure of a card on
animation throwdown their skills we don't care about those attack we don't care about those and trades you can see that there's no numbers there the other two are self-explanatory they're going to do things against your opponent but trades are they useless and they're not but they're only useful for a limited time and this rotates so part of that liveops cadence has become for all these games to grant a specific bonus or penalty or something special happens to a trait for a limited amount of time and what that does is that it creates this puzzle solving mentality for players they want to find the right combination that will give them the most powerful deck during this time and you can't read that on the left but that's a reddit post that as soon as a new bonus was announced the drunk one
people start posting like just help me out what's the best combination what are the best combos that i can put together how should i optimize my deck so at the end of the day that they can have the strongest deck so part of this is timing also the offers that are presented to the player and this is something that the team has iterated on very much and finding the right cadence of what types of exclusive cards should be offered to match that active trait in this case original design that animation throwdown had was this box idea which has a bunch of boxes you spend you pull a card and you can keep spending and basically if you you can go through the whole box it literally is as if you're pulling things out of a box and some there's
more kind of weak cards than super strong cards but the idea is that you know if you pull everything in this case nine i don't know how many cards they had but if you pull everything out of the box you get all the very very strong cards and what we see is that there's a very even engagement with these boxes so the most committed players will regularly spend in these to get those cards from these boxes and it creates a very steady gem sync so you see kind of these ups and downs that comes with the release of a new box but on average you can see that throughout week over week over week it is a very very steady sink of gems which means that ultimately is people will need more gems and spend more in the game
now if we look at just high spender players it is much higher it is actually 2x so that tells us that your big spenders are going even deeper in fact 70 to 80 percent of the gems spent on these boxes come from those spenders just to summarize real quick and i apologize that i didn't get a chance to go a little bit slower on this but it's really important to have a regular uh and deep content updates and what you'll see is that it will give you what we call strong depth of spend which means that players will want to go and do that second third fourth purchase but only if it is a good purchase so remember that it's not just giving them things has to
make a difference on their game and the way that we can measure the success of this is by looking at repeat purchase rates and at the end of the day spending players will want to spend if it's worth it again all right so back to correlations uh this is the last one uh which kpis have a strong relationship with uh percent virus and arpu in this case our poopoo and i looked at lifetime lifetime time transactions and the idea here is that you know it's not only about big purchases or getting them to that second purchase but it's also about those multiple purchases so many many more after the second one hopefully you win by doing that and the correlation is super strong 0.72 that's one of the highest that we've seen so you want to increase the number of transactions that players
uh are doing throughout their lifetime and i'm going to go back real quick to animation throwdown for an example on this so recently the team actually iterated on the design of their boxes so the boxes that we just looked at they've been running those in all of their games and in december they tested a new type of box which it's called tier boxes so tiers guarantee cards you buy more you go up tiers you're at a higher tier the price goes up so it's kind of like a step you're going up that ladder but the higher that tier the better the value kind of reduces a little bit of the randomness and just as an example here
in this case you can buy for 200 gems after you buy that tier you are going to go up and it's going to be something like 500 and it's just going to keep going up and the best card is always there in front of you so that you really really really want it all right so looking at back to that percent dau buying boxes what happened well on green we have our regular boxes that we had looked at in orange we have tier boxes during the testing period and even as we added into our regular cadence it increased tremendously so what this started saying is you know there's similar system but it's more approachable you're getting a breath of players more players are engaging with the boxes
but is that good is that actually going to help you know bring in more revenue so if we look at gems spent per engaged player we saw lower gem spend is that is that bad um well it's a balance right we had talked about this so when we talk when we look at overall gem spent you can see that in orange the tear boxes have much higher gem span generate more a bigger sink of gems so the lower starting price point gives a much higher engagement and players and we found the right balance between approachable and scaling that system so what we saw with that is this breath
kind of what i was talking about once the box is you can see that when it was tested percent first time buyer went up and then once it was added into the regular cadence it also went up and didn't didn't i say we shouldn't focus on this too much still something that we want to optimize right but what we also saw was increase in average transactions so we also created more depth more players are spending but they're also going through more transactions so it's a little bit of a win-win right uh so quick summary there uh iterate and test different approaches i think that's very important and we talk about you know found really good monetization strategy and you'd go all in and you want to kind of take a step
back and iterate and test different approaches you can find the right balance between getting more players to spend so finding that breadth and getting them to spend multiple times so getting that depth and in reality you can you can increase both without under pricing your game because once again spending players will want to spend if it's worth it all right so to summarize a little bit what we talked about today some players are more likely to spend this is still true this is the nature of free-to-play games and that percent buyer rate is a narrow band but when optimizing manipulation go deeper think beyond percent buyers and don't call them whales
and what are your kpis so go back to that went through a bunch of correlations and we want to think about what's what's key so key are percent buyers it still matters this tells you that you know a player who is willing to spend comes into your game they're enjoying it and they see the value there and they give you a chance our percent repeat spenders a number of transactions tells you that after that first purchase they saw the value it's kind of their stamp of approval they were satisfied with their purchase and they're willing to spend again on your game and go deeper and really really go deep into your game and take it up as a hobby and many times all right so if you don't remember anything else in
all the numbers that i talked about in all the kpis and the alphabet soup remember that it all starts with a fun engaging game don't underprice your game and spending players will want to spend provide the content that lets them do that go deeper and feel good about it thank you and i think we have five minutes for questions hello thank you very much for an awesome lecture i just um had one probably one question when you show the graph of dependence between the price of first purchase and the percentage of players who are repeating to make second purchase after that
isn't it just kind of a bit biased because when you make first purchase really cheap it kind of accumulates very large user base within it including all those low spenders like those who are super rarely spent so it's kind of like biased by cohort and it's like i don't know and like those who willing to spend hundred dollars on the first purchase they like uh of course they will more likely spend more because they're just this small golden cohort of wales it is and so sorry the question was uh if when you when you look at the uh second purchase rate isn't it the buckets are a little bit biased and uh the answer is it is but part of that is because it doesn't it's not gonna help you to get those kind of what you were saying the low pla like low spending players that are only gonna spend one dollar you're undervaluing your game because you're not gonna repeat spend again so part of it is you know in many ways
don't even providing those offers okay thanks hi thank you so did you run anything any a b tests on that as well or was it just looking at the same game and conversion points we've also ran a b test this is the most recent example that we had and it was kind of a relearning in many ways uh we've ran multiple tests and we've always encountered that same result thank you very much for being so open and sharing all the data is amazing thank you thank you you mentioned there were key performance indicators and you gave us a whole bunch of alphabet soup i had a question for you around dao and arp dao because you mentioned it at the beginning but then it never showed up in any of the other analyses is this something that's more of a red herring is this something that we shouldn't be chasing when we're measuring performance or is that just sort of your dependent variable at this point
so arp dow i have strong feelings about arp down the question was that i i showed the alphabet soup and then i had uh arp down and down in there and then almost never talked about it again and so arpdau is a i have strong feelings about it because it's a really bad metric because you're looking at your revenue and your users on a daily basis and what happens is that it just it's aggregating everyone right but in your game you have players that have been playing for one day that just installed and players who have been playing for a hundred days or hopefully two years and their behavior is going to be very different so by aggregating all of them you are effectively not getting a lot of insight it's much more vanity metric when it really becomes useful is when you start segmenting it
by those kind of milestones or player ages so if you're looking at your armed owl for your new players versus your mid-life players versus your elder players thank uh you talk i just want to ask you about uh price elasticity so you just you kind of summarize that in general virtual goods are inelastic um in previous data i've seen on games uh it was highly dependent on the price so we kind of used a rule of thumb where like below five bucks prices were inelastic because people didn't care whether they spent one dollar or five but above that you did start to see some you know elasticity in the prices do you have you found anything like that or is the you know rule of thumb kind of changed i think it's part of it is also and sorry is the price elasticity is it uh kind of a rule of thumb across everything or you're mentioning that you know if you go higher in prices it starts becoming a little bit more elastic and i think it
that's why i had like kind of them mostly because it's not entirely inelastic so it also depends on the game and it also depends i think on who you're presenting those offers to so yes i think it's they're mostly inelastic kind of as a as a broad umbrella but you will encounter situations where you need to be a little bit more careful about that thanks a lot hi there thank you for the talk it was very good um so much like you're talking about r squared sort of being lower because games is a messy business from one math nerd to a num to another sort of how do you deal with sort of like the variables not being ideal like p factor and things like that so i just sort of wonder your general philosophy for sort of measuring math and things like that a lot of it is i we use ranges um so math from the question was from one master to another uh games are our best
messy environments and how do we deal with you know the the r scores not being perfect and other types of variables um and a lot of it we we have the luxury of having a portfolio of games so that also helps us in having uh ranges so it's kind of like a little bit of a cheat in in that way because we can look at these behaviors and these analysis across multiple games and kind of determine when a range is good versus a range is bad thank you all right thank you everyone
Auto-generated captions from YouTube — names and numbers may be misheard.
Key insights
Distilling the key insights…
Ask AI about this video
Cite this video
Citation
Generating citation…









Comments