Updated Jun 10, 2026 by XD
Financial
Published by XD
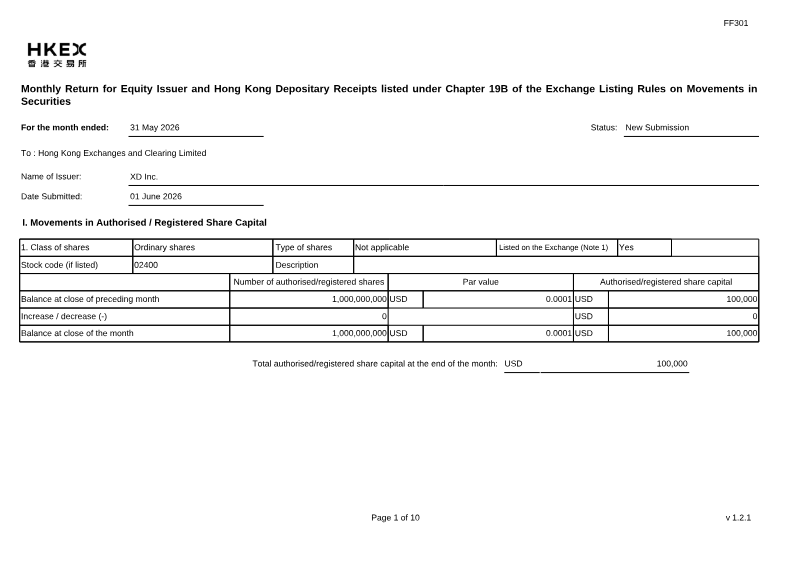
The submission reports the equity movements of XD Inc. for May 2026, detailing authorised capital, issued shares, treasury holdings, and public float compliance. Authorised share capital remained unchanged at 1 billion ordinary shares with a nominal value of HKD 0.0001, equating to USD 100,000 in authorised capital. Issued shares decreased from 492,433,164 to 489,302,364, a net reduction of 3,130,800 shares, all of which were ordinary shares. Treasury share balances stayed at zero throughout the month. Share‑option activity under a plan adopted in June 2021 contributed 5,200 new ordinary shares to the issued pool, raising HKD 172,858. Concurrently, share repurchases and cancellations reduced the issued count by 3,136,000 shares; 285,000 of these were repurchased but not yet cancelled as of May 31, and 3,136,000 shares were repurchased and cancelled on May 19. No other convertible or alternative share‑issuance mechanisms were employed. Public float sufficiency was confirmed, with the company meeting the 25 % minimum threshold based on total issued shares excluding treasury holdings. The issuer affirmed that all board authorisations, regulatory compliances, and financial settlements related to the movements were satisfied. No new listing conditions or legal filings were outstanding beyond routine corporate obligations. Overall, XD Inc.’s May 2026 equity activity involved a modest net dilution from option exercise offset by significant share repurchases, maintaining compliance with Hong Kong Exchange listing rules and preserving adequate public float.
HKEXC M Monthly Return for Equity Issuer and Hong Kong Depositary Receipts listed under Chapter 19B of the Exchange Listing Rules on Movements in Securities For the month ended: 31 May 2026 Status: New Submission To : Hong Kong Exchanges and Clearing Limited Name of Issuer: XD Inc. Date Submitted: 01 June 2026 I. Movements in Authorised / Registered Share Capital 1. Class of shares Ordinary shares Type of shares Not applicable Listed on the Exchange (Note 1) Yes Stock code (if listed) 02400 Description Number of authorised/registered shares Par value Authorised/registered share capital Balance at close of preceding month 1,000,000,000 USD 0.0001 USD 100,000 Increase / decrease (-) 0 USD 0 Balance at close of the month 1,000,000,000 USD 0.0001 USD 100,000 Total authorised/registered share capital at the end of the month: USD 100,000 Page 1 of 10 v 1.2.1
II. Movements in Issued Shares and/or Treasury Shares and Public Float Sufficiency Confirmation 1. Class of shares Ordinary shares Type of shares Not applicable Listed on the Exchange (Note 1) Yes Stock code (if listed) 02400 Description Number of issued shares Number of treasury shares Total number of issued shares (excluding treasury shares) Balance at close of preceding month 492,433,164 0 492,433,164 Increase / decrease (-) -3,130,800 Balance at close of the month 489,302,364 0 489,302,364 Public float sufficiency confirmation (Note 4) Pursuant to Main Board Rule 13.32D(1) or 19A.28D(1) / GEM Rule 17.37D(1) or 25.21D(1), we hereby confirm that, in relation to the class of shares as set out above, as at the close of the month: ✔ the applicable public float requirement (see below) has been complied with the applicable public float requirement (see below) has not been complied with The applicable minimum public float requirement for the class of shares as set out above pursuant to Main Board Rule 13.32B or 19A.28B / GEM Rule 17.37B or 25.21B (as the case may be) is: Applicable public float threshold Initial Prescribed Threshold - 25% of the total number of issued shares in the class to which the listed shares belong (excluding treasury shares) Additional information Page 2 of 10 v 1.2.1
III. Details of Movements in Issued Shares and/or Treasury Shares (A). Share Options (under Share Option Schemes of the Issuer) 1. Class of shares Ordinary shares Type of shares Not applicable Listed on the Exchange (Note 1) Yes Stock code (if listed) 02400 Description Number of shares which The total number of Number of share Number of treasury may be issued or shares which may be options outstanding at Number of share Number of new shares shares transferred out of transferred out of issued or transferred out Particulars of share option scheme close of preceding Movement during the month options outstanding at issued during the month treasury during the treasury pursuant of treasury upon month close of the month pursuant thereto (A1) month pursuant thereto thereto as at close of exercise of all share (A2) the month options to be granted under the scheme at close of the month 1). Share Option Plan adopted on 25 13,985,442 Exercised - new shares involved -5,200 13,980,242 5,200 13,980,242 28,966,564 June 2021 General Meeting approval date (if applicable) 25 June 2021 Increase in issued shares (excluding treasury shares): 5,200 Ordinary shares (AA1) Decrease in treasury shares: Ordinary shares (AA2) Total funds raised during the month from exercise of options: HKD 172,858 Page 3 of 10 v 1.2.1
(C). Convertibles (i.e. Convertible into Shares of the Issuer) Not applicable Page 5 of 10 v 1.2.1
(D). Any other Agreements or Arrangements to Issue Shares of the Issuer, including Options (other than Share Option Schemes) Not applicable Page 6 of 10 v 1.2.1
(E). Other Movements in Issued Shares and/or Treasury Shares 1. Class of shares Ordinary shares Type of shares Not applicable Listed on the Exchange (Note 1) Yes Stock code (if listed) 02400 Description At price (if applicable) Date of event General Meeting Increase/ decrease (-) in issued Increase/ decrease (-) in Number of shares redeemed or Events (Note 2) approval date shares (excluding treasury treasury shares during the repurchased for cancellation but (if applicable) shares) during the month month pursuant thereto (E2) not yet cancelled as at close of pursuant thereto (E1) the month (Note 3) Currency Amount 1). Repurchase of shares (shares repurchased for cancellation HKD 29 May 2025 -285,000 but not yet cancelled) 2). Repurchase of shares (shares repurchased and cancelled) HKD 19 May 2026 29 May 2025 -3,136,000 Increase/ decrease (-) in issued shares (excluding treasury shares): -3,136,000 Ordinary shares (EE1) Increase/ decrease (-) in treasury shares: Ordinary shares (EE2) Remarks: A total of 285,000 ordinary shares repurchased during May 2026 were cancelled on May 19, 2026. As at May 31, 2026, the Company did not have any shares repurchased for cancellation but not yet cancelled. Total increase/ decrease (-) in issued shares (excluding treasury shares) during the month (i.e. Total of AA1 to EE1): -3,130,800 Ordinary shares Total increase/ decrease (-) in treasury shares during the month (i.e. Total of AA2 to EE2): Ordinary shares Page 7 of 10 v 1.2.1
Tencent demonstrated robust financial health and operational expansion during the first half of 2005, characterized by a strategic pivot toward Internet value-added services. Total revenues reached RMB 634.1 million, representing a 20.1% year-over-year increase, while net profit for the period climbed to RMB 283.9 million. This profitability was bolstered by a significant one-time deferred tax credit of RMB 88.6 million and a 92.8% quarter-over-quarter profit surge in the second quarter. These gains effectively offset a decline in mobile and telecommunications value-added services, which faced headwinds from regulatory shifts and billing adjustments. The company’s growth was underpinned by massive user engagement, with registered instant messaging accounts reaching 438.4 million and peak simultaneous online users hitting 16.2 million. To support this scale, the organization doubled its workforce to 1,648 employees, leading to a corresponding doubling of remuneration costs to RMB 134 million. Increased investments in research and development and new product launches remained central to the company’s strategy, even as operating expenses rose. The financial reporting for this period marked a transition to International Financial Reporting Standards, specifically adopting IFRS 2 to account for share-based compensation via the Black-Scholes model. Geographically focused on the Chinese market, the company navigated a changing macroeconomic landscape, including the decoupling of the RMB from the USD in July 2005, which introduced new foreign exchange risks. Corporate governance remained stable, with MIH QQ (BVI) Limited maintaining its position as the largest shareholder. Although the company deviated from standard governance practices by unifying the Chairman and CEO roles, the board maintained that this structure was essential for maintaining agility and operational stability within the rapidly evolving information technology sector.
IGG Inc. is a global developer and operator of online games, specializing in the free-to-play model where revenue is primarily generated through the sale of virtual items. Headquartered in Singapore with significant research and development operations in the People’s Republic of China, the company maintains a diverse portfolio of browser, client-based, and mobile titles. The primary purpose of the prospectus is to facilitate the company’s listing on the Growth Enterprise Market (GEM) of the Stock Exchange of Hong Kong, with an offering of 327,434,000 shares expected to raise between HK$588.4 million and HK$711.9 million. These proceeds are earmarked for marketing, strategic acquisitions, and the expansion of development teams to support the company’s transition toward mobile gaming. The company has demonstrated strong financial growth, with revenue increasing by 42.9% in the first five months of 2013 compared to the same period in 2012. While historical financial statements reflected net losses due to the fair value accounting of redeemable convertible preferred shares, these instruments were converted to equity by May 2013, resulting in a significantly improved balance sheet and a shift to a net current asset position. Despite this growth, the company faces substantial operational risks, including a high concentration of revenue within a small number of titles, reliance on third-party platforms like Facebook and mobile app stores, and the inherent volatility of the global gaming market. To navigate PRC foreign investment restrictions, the company employs a series of structured contracts to maintain control over its domestic operating subsidiary, Fuzhou Tianmeng. While legal counsel has confirmed the enforceability of these arrangements, they remain a point of regulatory uncertainty. Furthermore, the company must manage complex tax compliance issues across multiple jurisdictions, including potential changes to its preferential tax status in Singapore and China. Following the listing, controlling shareholders will retain over 30% of the issued share capital, and the company will continue to operate under a governance framework designed to mitigate conflicts of interest and ensure ongoing regulatory compliance.
Tencent Holdings Limited demonstrated robust financial expansion during the first half of 2008, characterized by an 84.8% year-over-year revenue increase to RMB 3.03 billion. This growth was underpinned by a significant rise in active user accounts, which reached 341.9 million by mid-year. Profit for the period climbed to RMB 1.19 billion, reflecting a strong 40.8% profit margin. The company’s performance was primarily driven by the scaling of internet value-added services, particularly online gaming and community platforms, alongside sustained growth in mobile telecommunications and online advertising. Operational scaling necessitated increased investment in human capital and infrastructure, leading to higher employee benefit costs and research and development expenditures. The workforce expanded to 5,168 employees, with total remuneration costs reaching RMB 593.6 million. Despite these rising operational expenses and the transition to a unified 25% PRC enterprise income tax rate, the company maintained a solid balance sheet with total assets of RMB 8.20 billion and a stable gearing ratio of 24%. Strategic initiatives during this period included the acquisition of mobile value-added service providers and equity interests in various international and domestic gaming entities, further diversifying the company's portfolio. The company navigated a complex macroeconomic environment, including the appreciation of the RMB against the USD and HKD, which resulted in exchange losses, and potential headwinds from a slowing Chinese economy. Governance remained stable, with MIH China (BVI) Limited serving as the largest shareholder at 35.08%. Through a combination of share repurchases and a share award scheme, the company continued to manage its capital structure and incentivize staff, ensuring alignment with long-term growth objectives while adhering to International Accounting Standard 34.
Tencent Holdings Limited delivered a robust fiscal year in 2010, reporting consolidated revenue of RMB 19.65 billion—an increase of nearly 58% over 2009—and net profit attributable to equity holders of RMB 8.05 billion, up 56% year‑on‑year. Growth was driven primarily by the online gaming segment, which generated RMB 15.48 billion in revenue (up 62%) and by a rapidly expanding user base, with instant‑messaging accounts reaching 647.6 million and Qzone users at 492 million. Mobile services, value‑added telecom offerings, and advertising also contributed to the revenue mix, while operating margins improved to 50% of earnings. Liquidity and capital structure remained strong. Total financial resources rose to RMB 22.1 billion, with cash and equivalents at RMB 10.4 billion and net financial resources of RMB 17.8 billion after short‑term borrowings. Capital expenditures doubled to RMB 2.01 billion, reflecting investment in infrastructure and new platforms. Share‑based compensation was significant; the company granted 4.85 million award shares in 2010, with no director awards, and maintained a share‑option pool of roughly 43 million shares. Governance structures were reinforced through independent remuneration, audit, and investment committees, and the board maintained a majority of non‑executive directors. Financial risk exposure was dominated by foreign‑exchange and interest‑rate sensitivities, with a 5 % currency swing estimated to affect profit by RMB 83 million. The gearing ratio increased from 30% to 39%, driven largely by bank borrowings, while fair‑value assets—primarily equity securities—remained level 2 instruments. Overall, Tencent’s 2010 performance underscored its ability to scale user engagement and diversify revenue streams while maintaining solid liquidity, disciplined capital allocation, and robust governance practices.