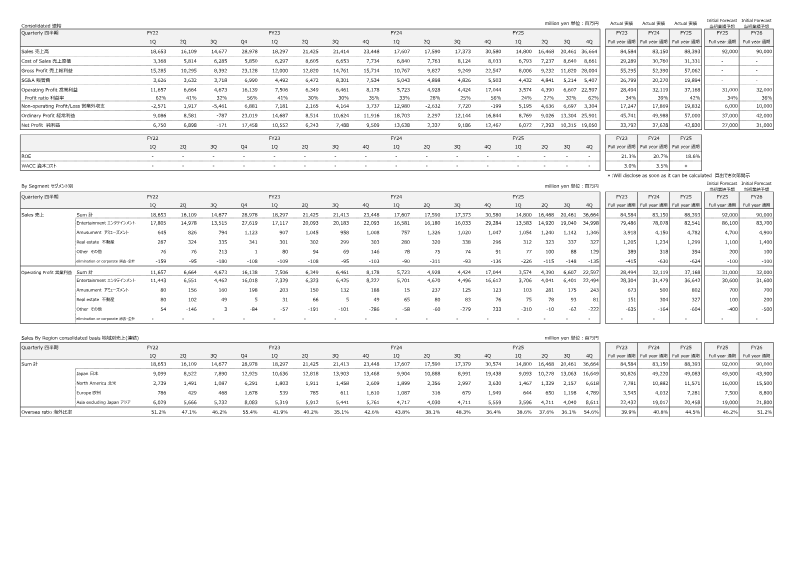
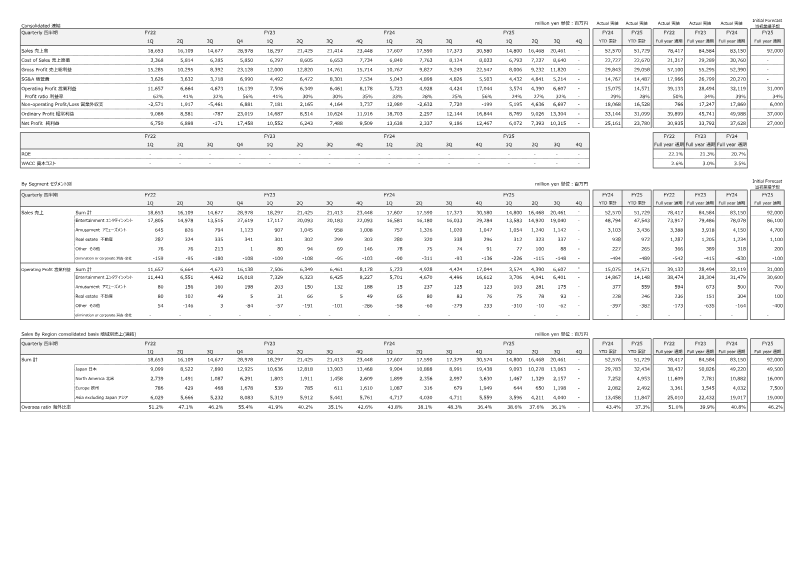
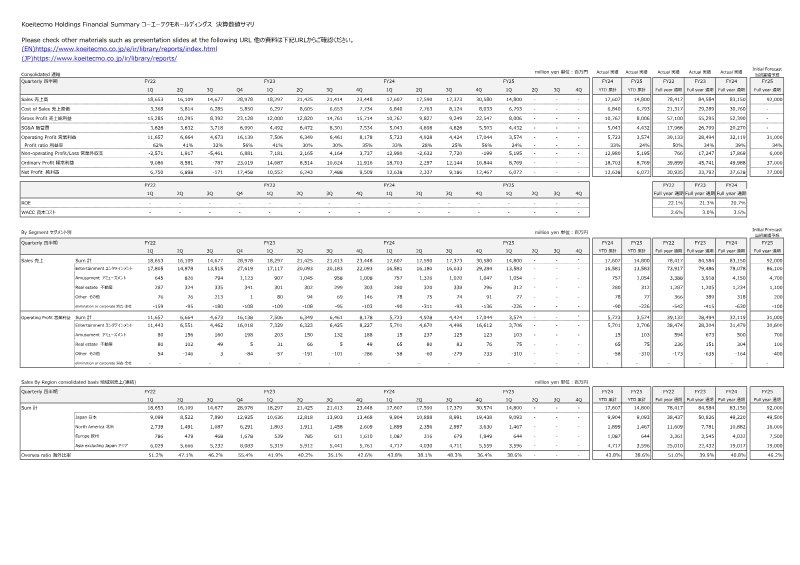
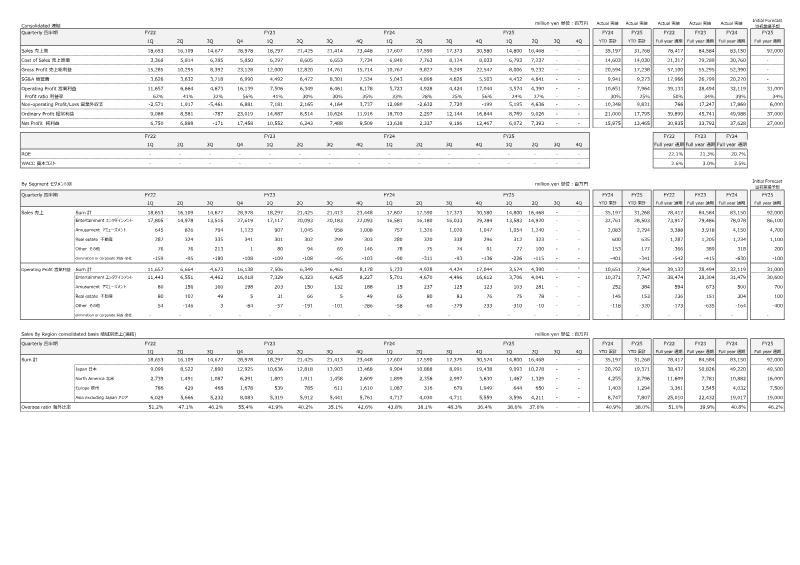
The FY2025 Annual Data Appendix presents a comprehensive financial and operational overview for the company’s entertainment, amusement, real‑estate, and other segments across FY22–FY26. Revenue trends show a decline in FY22 (¥18,653m) to a rebound in FY25 (¥36,664m), driven largely by the entertainment segment, which accounts for roughly 90 % of total sales. Gross profit margins fluctuate from 32 % in FY22 to a peak of 56 % in FY25, reflecting cost‑control efforts and higher digital sales. Operating profit follows a similar pattern, rising from ¥4,424m in FY22 to ¥32,119m in FY25, with a profit ratio stabilizing around 30–35 % after an initial dip. Net profit improves markedly, reaching ¥42,830m in FY25 from a loss of ¥171m in FY24. Return on equity climbs to 21.3 % by FY25, while the weighted average cost of capital is projected at 3.0–3.5 %.
Geographically, Japan remains the largest market (≈50 % of sales), but overseas revenue grows from 47 % in FY22 to 55 % by FY25, driven by North America and Europe. Digital sales dominate the entertainment portfolio, with a digital ratio exceeding 80 % in FY25 and a consistent increase in online/mobile units. Headcount expands modestly from 2,413 employees at FY22 Q1 to 2,835 by FY25 year‑end. Capital expenditures focus on real‑estate and equipment, totaling ¥24,555m in FY25, while depreciation costs rise to ¥1,999m. The appendix also lists major titles and upcoming releases across console/PC and online/mobile platforms, highlighting strategic IPs such as “Nobunaga’s Ambition,” “Dynasty Warriors,” and “Dead or Alive.” Overall, the data indicate a recovering profitability trajectory supported by digital expansion and strategic title releases.
Koei Tecmo · 2025
Koei Tecmo · 2025
Koei Tecmo · 2025
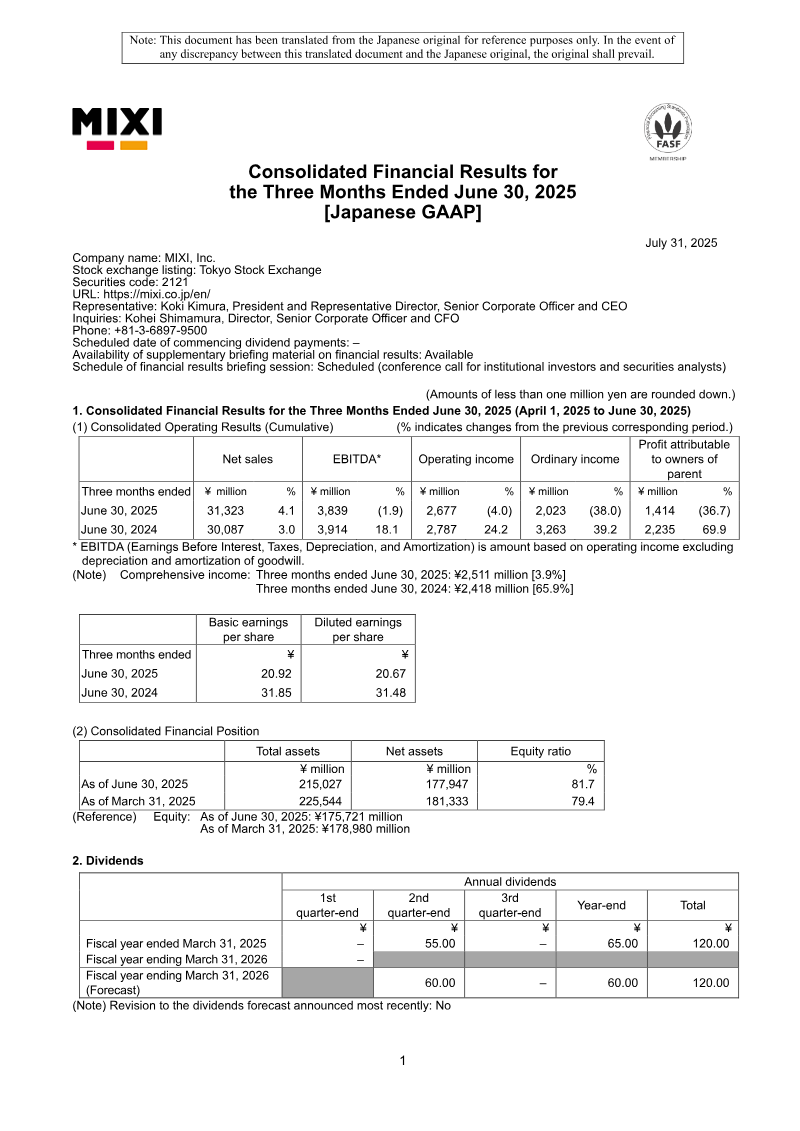
MIXI, Inc. · 2025
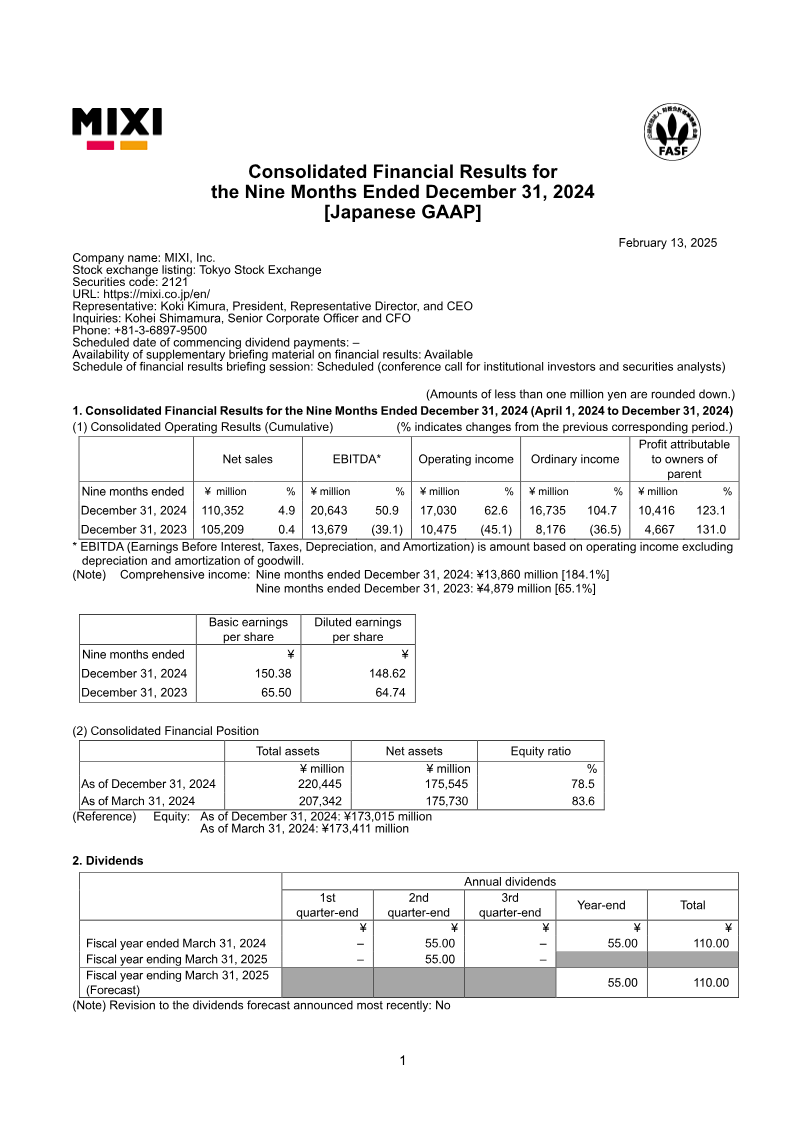
MIXI, Inc. · 2025
Koei Tecmo · 2025
Koei Tecmo · 2025
Koei Tecmo · 2025

Koei Tecmo · 2025

Koei Tecmo · 2025
Koei Tecmo · 2024

Koei Tecmo · 2024
Capcom · 2026

Capcom Co. · 2026

Capcom · 2026

Sony Group Corporation · 2026

FRANCE BED HOLDINGS CO. · 2026
Marvelous · 2026

Square Enix · 2026
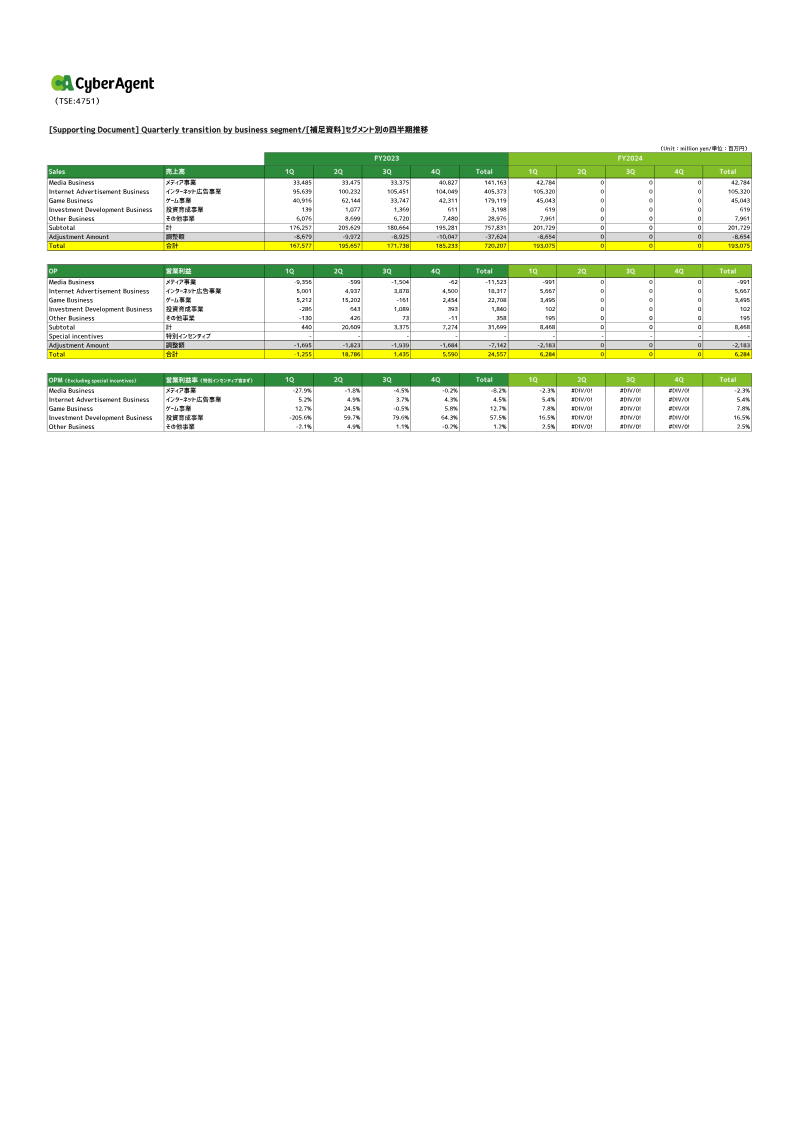
CyberAgent · 2026
Square Enix · 2026
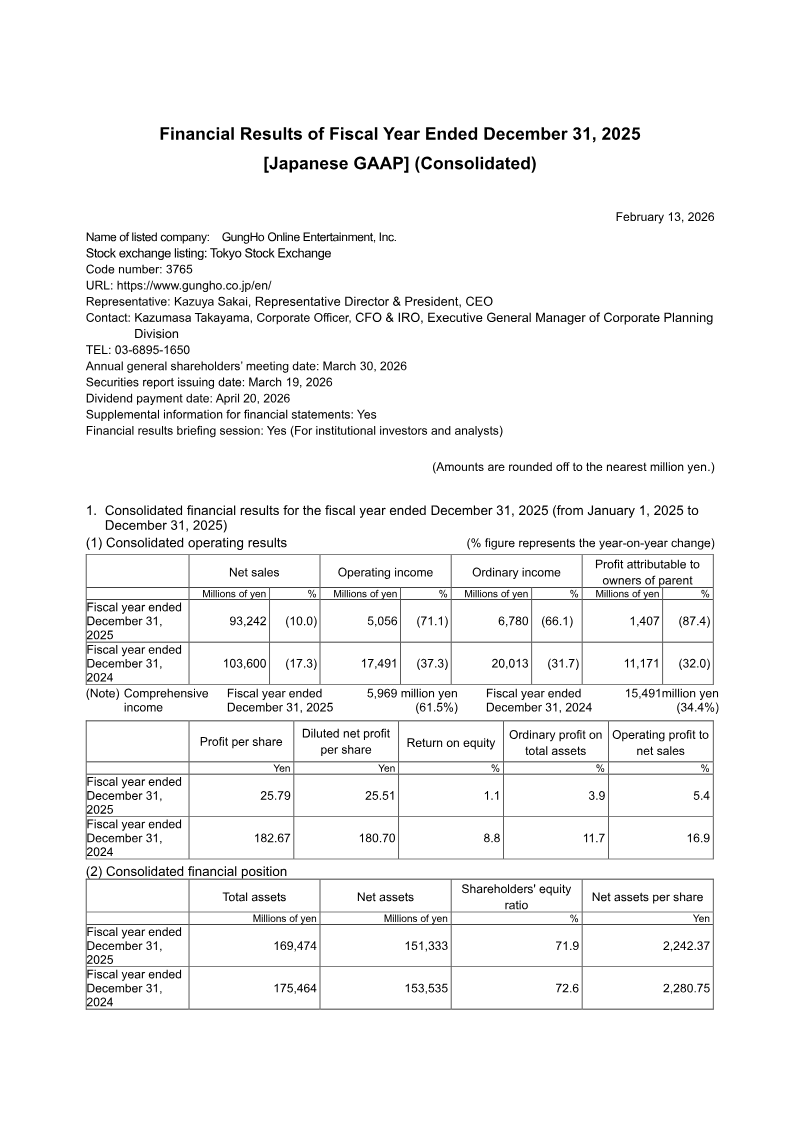
GungHo Online Entertainment · 2026
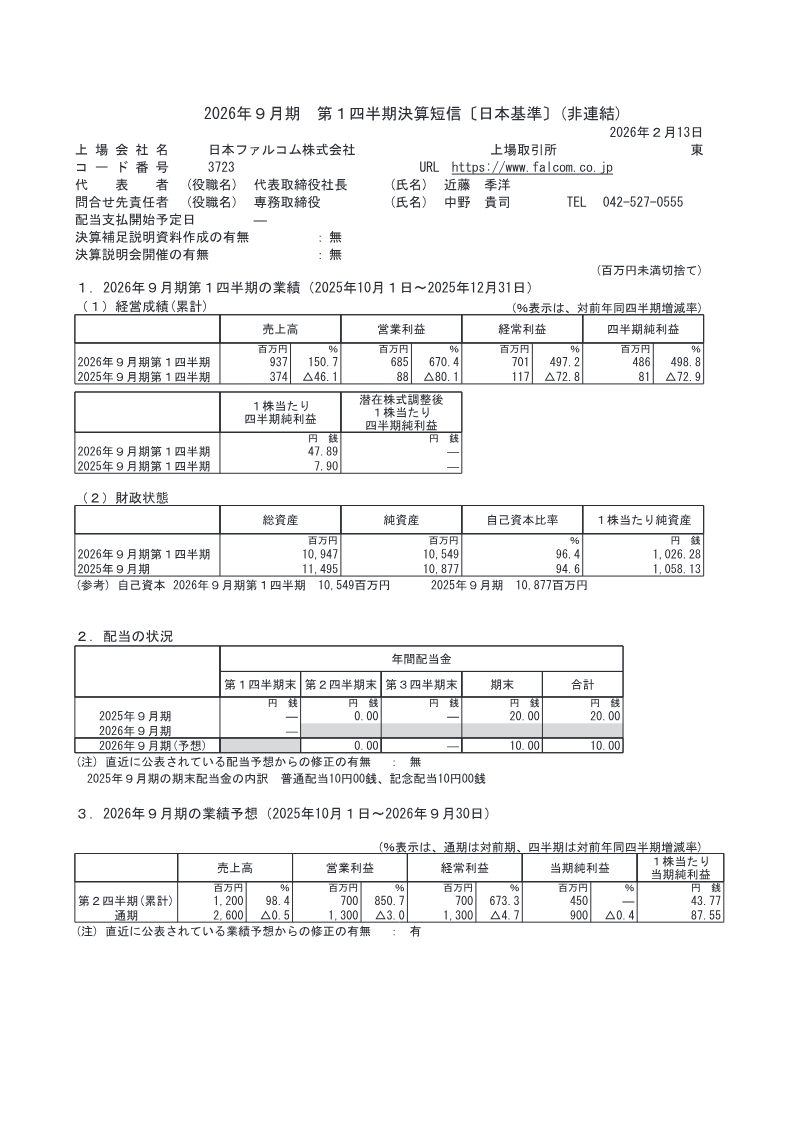
Nihon Falcom Corporation · 2026
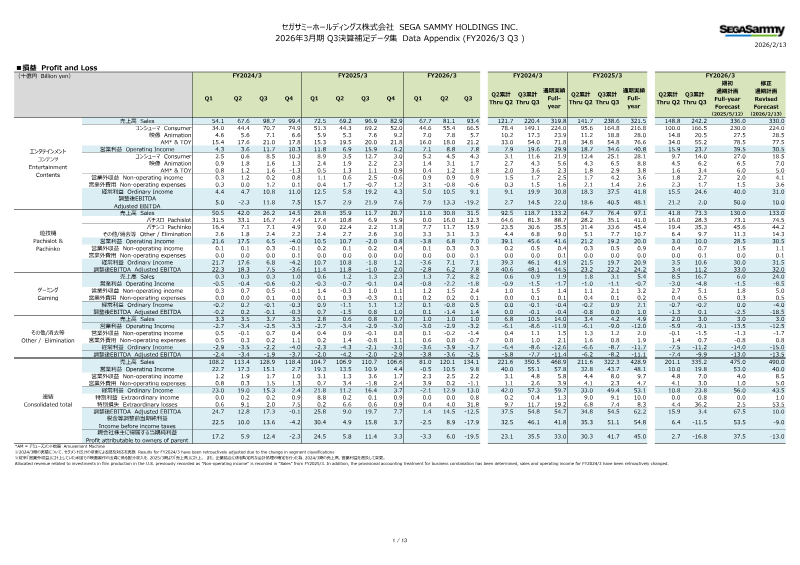
Sega Sammy Holdings · 2026