
FinancialCapcom
FY26/3 Earnings Summary and Mid- to Long-Term Growth Strategies: Capcom
12 May 202641 pages~29 min full read
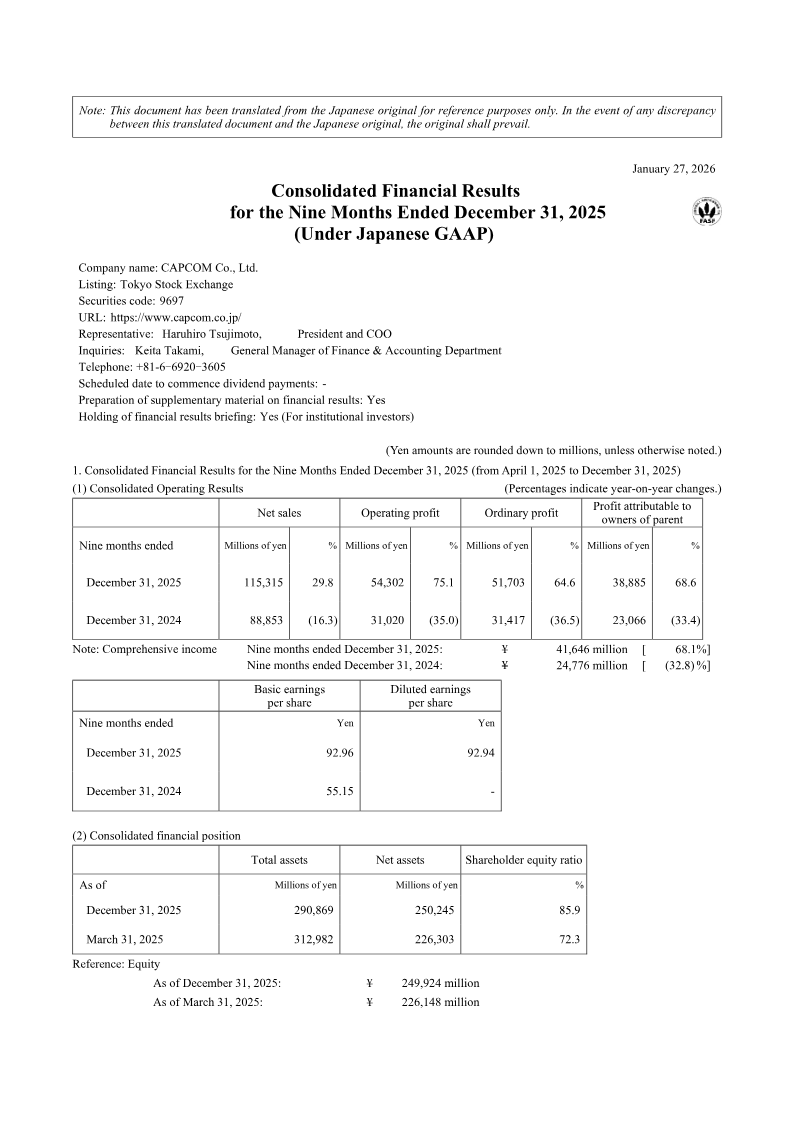
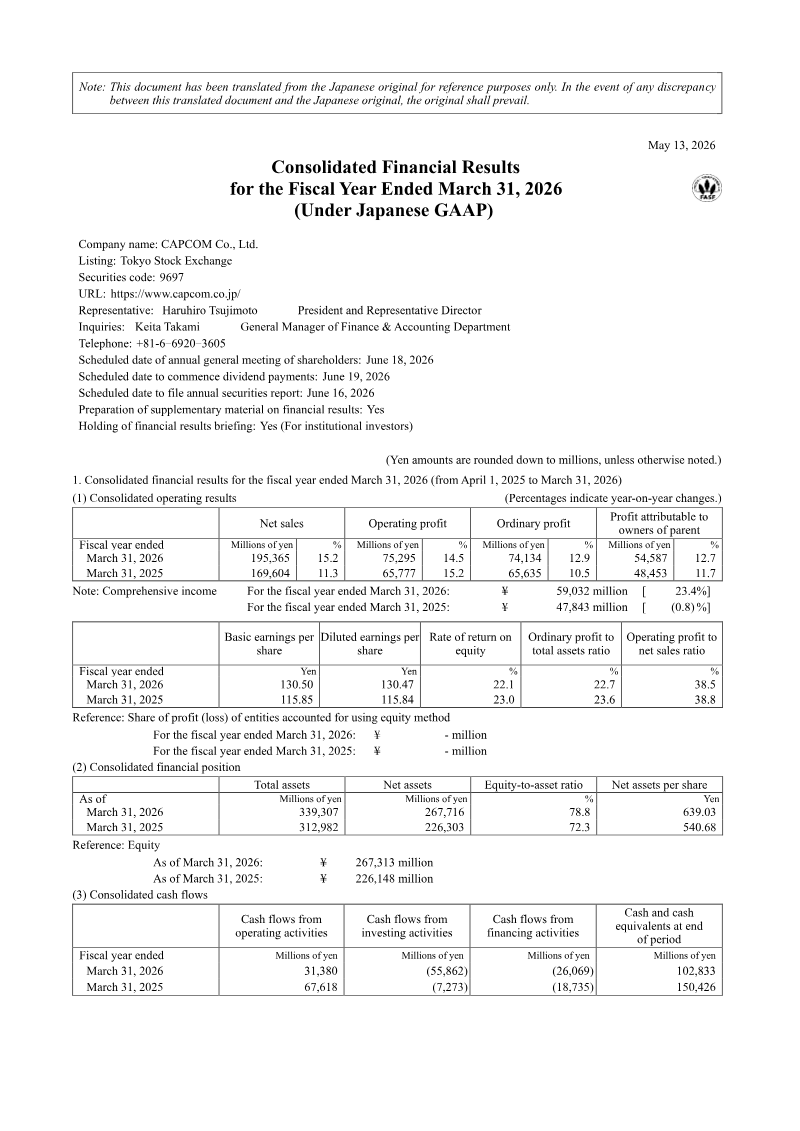
Capcom achieved a historic peak in FY26/3, reporting net sales of ¥1.95 billion and operating profit of ¥752 million—both up 15% year‑over‑year. The surge was driven by strong new‑title releases and catalog sales, particularly through digital channels, and marked the company’s highest cumulative unit sales at 5.9 million. Retail expansion reached 61 stores, including the first overseas Capcom Store in Taipei, underscoring a growing global footprint.
Looking ahead to FY27/3, Capcom targets more than 10% operating‑profit growth and ¥2.1 billion in sales, underpinned by a steady pipeline of new IP launches such as Pragma and an expanded catalog strategy. The company plans to release one new machine per quarter, aiming for 53 000 units across four titles—including Biohazard RE:3 and Resident Evil 7—while projecting net sales of ¥209 million and operating profit of ¥104 million. A key focus is deepening IP monetisation through e‑sports, media tie‑ins, and mobile extensions, with an expected 18% year‑over‑year increase in pachislo volume and intensified expansion into emerging markets.
The FY26/3 earnings report also highlights significant workforce growth, with an annual addition of over 100 developers and the integration of AI tools to enhance efficiency. Financially, net sales rose 14% YoY to ¥1,259 bn and operating profit increased 18% to ¥508 bn, while maintaining a strong cash position that balances shareholder returns, employee compensation, and reinvestment. Diversity metrics improved, with female core‑role representation at 15.7% and paternity leave utilization at 79.7%, reflecting a broader talent strategy aimed at sustaining long‑term innovation and market leadership.
Capcom · 2026
Capcom · 2026
Capcom · 2026
Capcom · 2025
Capcom · 2023

Capcom
Capcom

Capcom
Sega Sammy Holdings · 2025
Nintendo · 2025
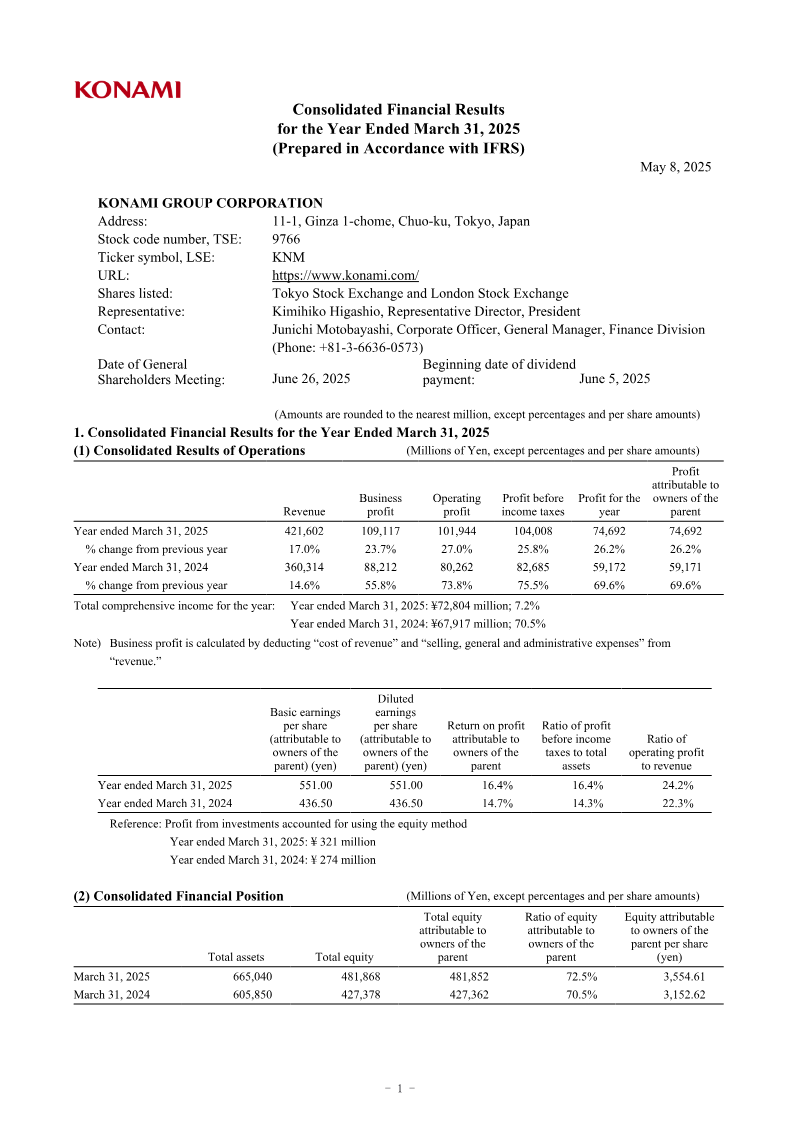
Konami · 2025

Nintendo · 2024

Bandai Namco · 2021
Bandai Namco · 2019
Bandai Namco · 2018

Bandai Namco · 2017
Bandai Namco · 2014

Bandai Namco · 2012
Bandai Namco · 2011

Bandai Namco · 2010