FinancialMIXI, Inc.
Consolidated Financial Results for the Nine Months Ended December 31, 2024
1 Feb 202512 pages~18 min full read
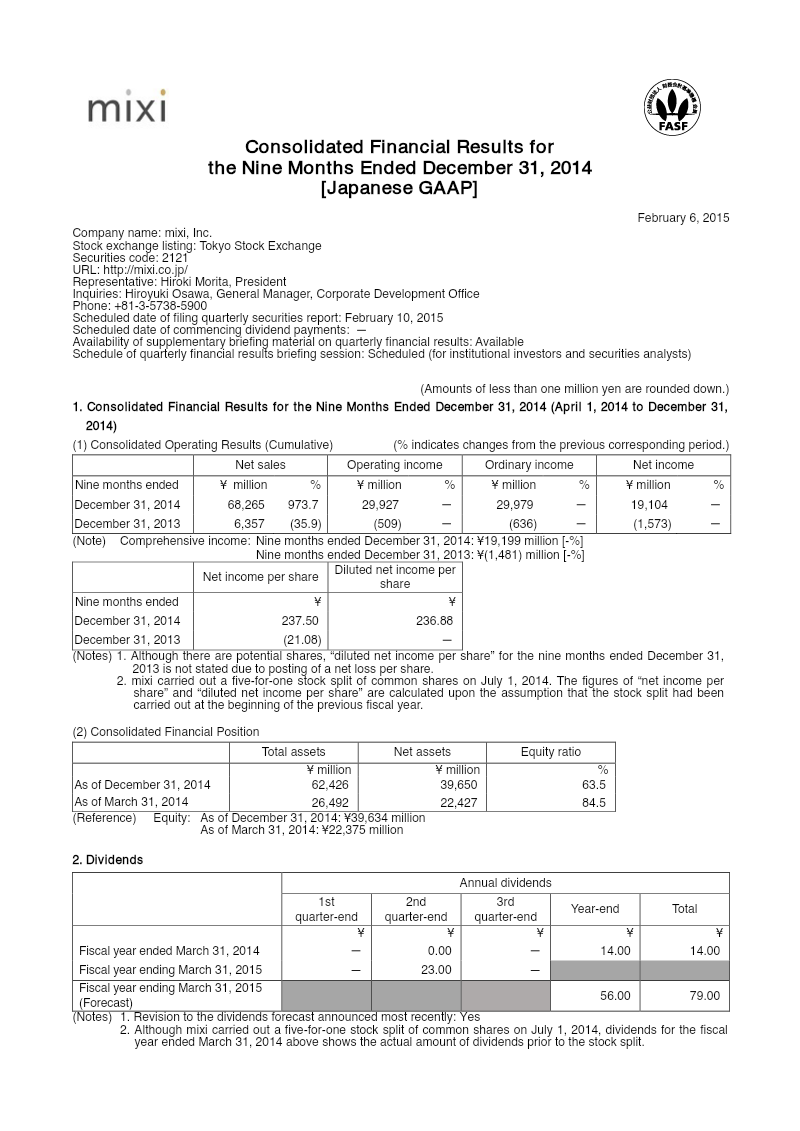
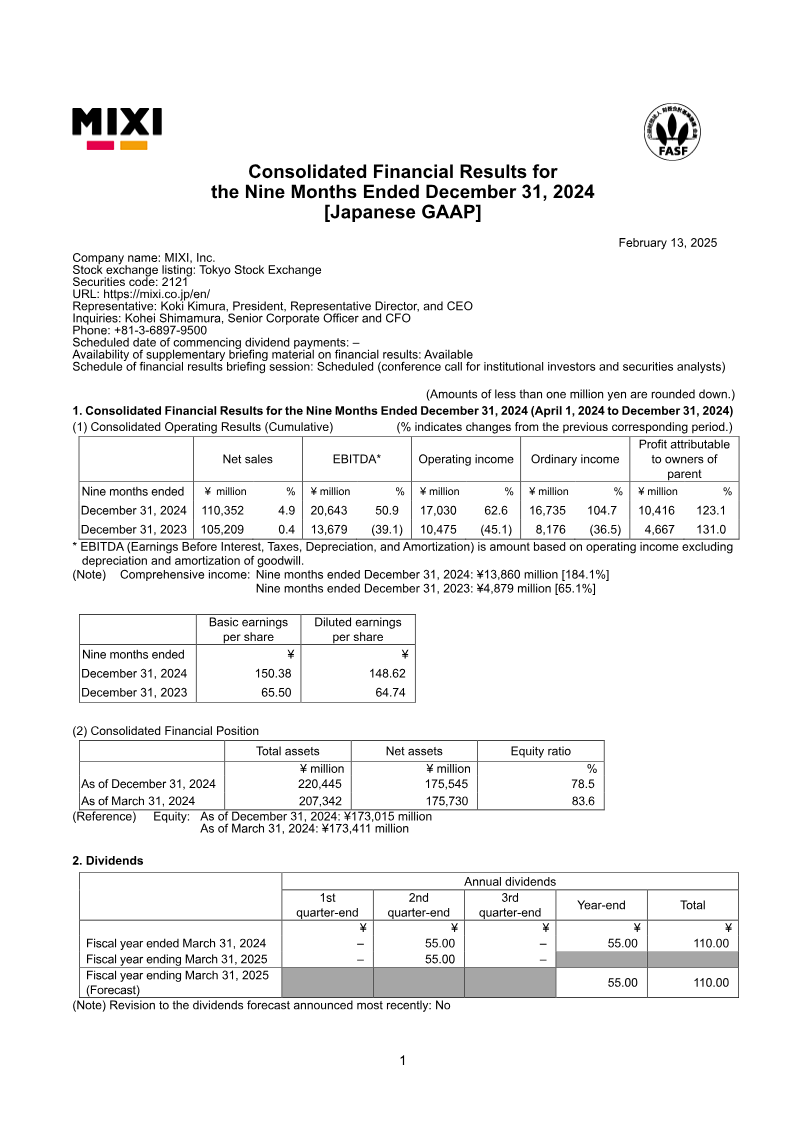
MIXI, Inc. reported a 62.6% surge in operating income to ¥17,030 million and a 123.1% increase in profit attributable to owners of the parent to ¥10,416 million for the nine months ended December 31, 2024.
See it on page 1The company revised its full-year profit forecast upward to ¥17,500 million, representing a 147.1% increase over the previous fiscal year, while maintaining a steady dividend of ¥110 per share.
See it on page 1The Digital Entertainment Business remains the core revenue driver, generating ¥65,455 million in sales and ¥28,479 million in segment profit, primarily supported by the mobile game Monster Strike.
See it on page 12The Sports Business achieved a financial turnaround, moving from a loss in the prior period to a segment profit of ¥1,113 million on ¥28,394 million in sales.
See it on page 11An internal investigation into unauthorized transactions at subsidiary Chariloto Co., Ltd. involving ¥1,026 million resulted in a net loss of ¥552 million for the parent company.
See it on page 9The Investment Business experienced significant growth, with revenue rising to ¥5,052 million from ¥1,117 million in the same period last year.
See it on page 11The company maintains a stable financial position with an equity ratio of 78.5% and total assets of ¥220,445 million as of December 31, 2024.
See it on page 4MIXI, Inc. reported strong financial growth for the first nine months of the fiscal year ending March 31, 2025, characterized by significant increases in profitability despite moderate revenue growth. Net sales reached ¥110,352 million, a 4.9% increase over the previous year, while operating income surged 62.6% to ¥17,030 million. Profit attributable to owners of the parent rose by 123.1% to ¥10,416 million. This performance was driven by a substantial reduction in selling, general, and administrative expenses and improved margins across several business segments.
The Digital Entertainment Business remains the primary revenue driver, largely supported by the mobile game Monster Strike, contributing ¥65,455 million in sales and ¥28,479 million in segment profit. The Sports Business showed a notable turnaround, moving from a loss in the previous period to a profit of ¥1,113 million on sales of ¥28,394 million. The Investment Business also saw a dramatic increase in revenue, rising from ¥1,117 million to ¥5,052 million, while the Lifestyle Business maintained steady growth.
Geographically focused on the Japanese market, the results cover the period from April 1, 2024, to December 31, 2024. The financial position remains stable with an equity ratio of 78.5% and total assets of ¥220,445 million. However, the period was impacted by an internal investigation into improper transactions at the subsidiary Chariloto Co., Ltd., involving ¥1,026 million in unauthorized dealings. This resulted in a net loss of ¥552 million attributable to the parent company after tax adjustments.
Based on these nine-month results, the full-year forecast has been revised upward. The company now expects annual net sales of ¥153,000 million and a profit attributable to owners of the parent of ¥17,500 million, representing a 147.1% increase over the prior fiscal year. Dividends are projected to remain steady at ¥110 per share for the full year.