Updated Jun 10, 2026 by Capcom
Financial
Published by Capcom
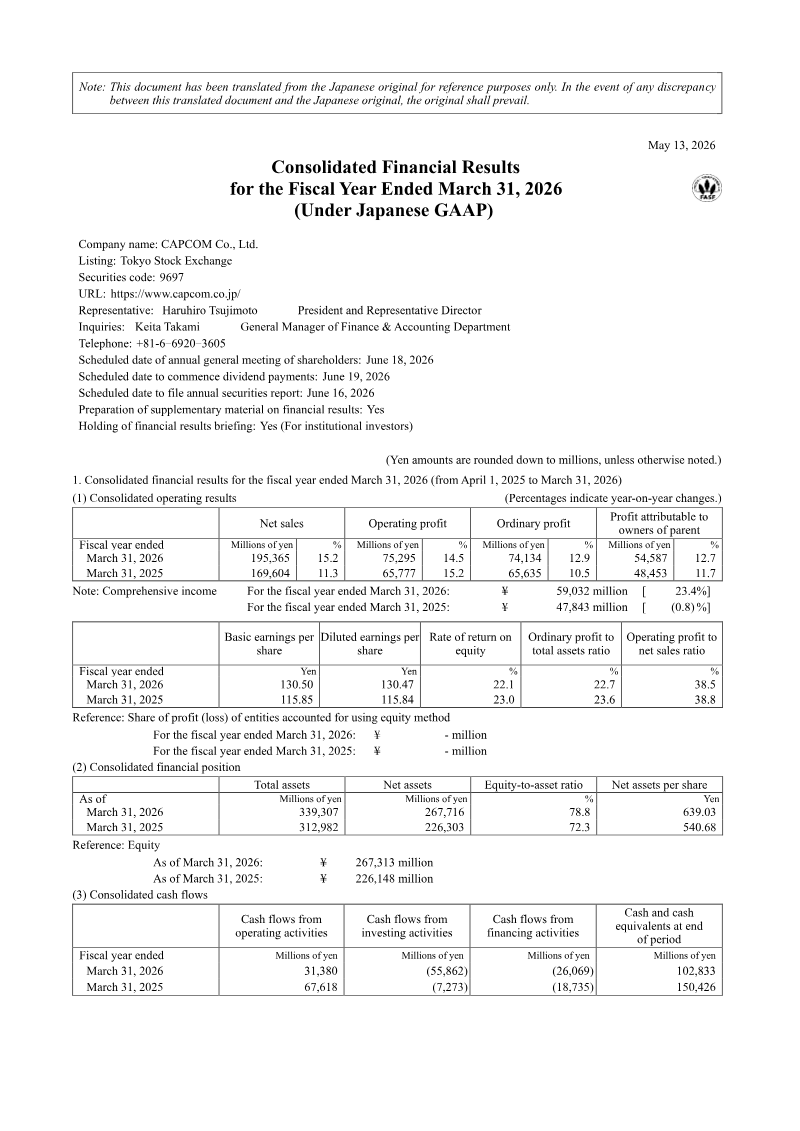
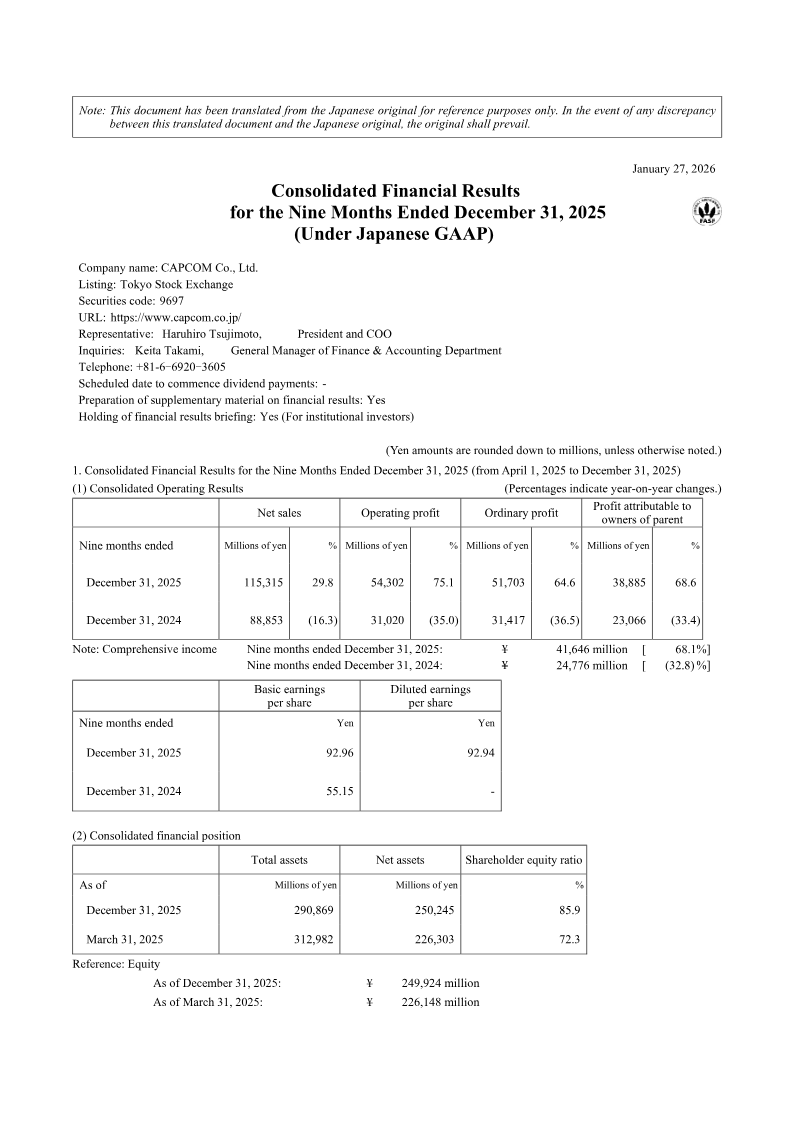
Capcom reported a robust fiscal year ending March 31, 2026, with net sales rising 15.2 % to ¥195,365 million and operating profit increasing 14.5 % to ¥75,295 million—its thirteenth straight year of profit growth. Total assets reached ¥339,307 million, giving an equity‑to‑asset ratio of 78.8 %. Operating cash flow stood at ¥31,380 million, while investing activities generated a net outflow of ¥55,862 million. The company distributed ¥17,048 million in dividends (34.5 % of sales) and projected 2027 net sales of ¥210,000 million with operating profit of ¥83,000 million. Core Digital Contents and Other Businesses segments drove the performance. Digital Contents sales grew 13.9 % to ¥17,780 million and operating profit surged 49.7 % to ¥10,033 million, supported by long‑term hall operations, global esports events, and media initiatives such as Street Fighter 6 tournaments. Other Businesses sales climbed 25.2 % to ¥7,650 million and operating profit rose 46.7 % to ¥3,645 million, reflecting expanded media and ancillary revenue streams. Operational metrics improved across the board. Net assets increased 8 % to ¥339 billion, largely from retained earnings and investment securities. The workforce grew to 3,976 employees with a 13 % rise in average annual salary. Paternity leave utilization reached 79.7 %, and the gender wage gap narrowed to 81.3 %. Equity rose from ¥217,768 million to ¥254,524 million, driven by a net profit of ¥54.6 billion and modest treasury‑share purchases. Cash flow dynamics shifted, with operating cash flow falling from ¥67.6 billion to ¥31.4 billion due to higher working‑capital requirements and larger dividend and debt repayment outflows. Other comprehensive income increased to ¥226,303 million, largely from foreign‑currency remeasurements and share‑award adjustments. Overall, Capcom’s 2026 results demonstrate sustained profitability, expanding digital and media operations, and a strengthening balance sheet amid growing global fan engagement.
Note: This document has been translated between this translated document from the Japanese original for reference purposes only. In the event of any discrepancy and the Japanese original, the original shall prevail. May 13, 2026 Consolidated Financial Results for the Fiscal Year Ended March 31, 2026 FASF (Under Japanese GAAP) Company name: CAPCOM Co., Ltd. Listing: Tokyo Stock Exchange Securities code: 9697 URL: https://www.capcom.co.jp/ Representative: Haruhiro Tsujimoto President and Representative Director Inquiries: Keita Takami General Manager of Finance & Accounting Department Telephone: +81-6-6920-3605 Scheduled date of annual general meeting of shareholders: June 18, 2026 Scheduled date to commence dividend payments: June 19, 2026 Scheduled date to file annual securities report: June 16, 2026 Preparation of supplementary material on financial results: Yes Holding of financial results briefing: Yes (For institutional investors) (Yen amounts are rounded down to millions, unless otherwise noted.) 1. Consolidated financial results for the fiscal year ended March 31, 2026 (from April 1, 2025 to March 31, 2026) (1) Consolidated operating results (Percentages indicate year-on-year changes.) Net sales Operating profit Ordinary profit Profit attributable to owners of parent Fiscal year ended Millions of yen % Millions of yen % Millions of yen % Millions of yen % March 31, 2026 195,365 15.2 75,295 14.5 74,134 12.9 54,587 12.7 March 31, 2025 169,604 11.3 65,777 15.2 65,635 10.5 48,453 11.7 Note: Comprehensive income For the fiscal year ended March 31, 2026: ¥ 59,032 million [ 23.4%] For the fiscal year ended March 31, 2025: ¥ 47,843 million [ (0.8) %]
yen % March 31, 2026 195,365 15.2 75,295 14.5 74,134 12.9 54,587 12.7 March 31, 2025 169,604 11.3 65,777 15.2 65,635 10.5 48,453 11.7 Note: Comprehensive income For the fiscal year ended March 31, 2026: ¥ 59,032 million [ 23.4%] For the fiscal year ended March 31, 2025: ¥ 47,843 million [ (0.8) %] Basic earnings per Diluted earnings per Rate of return on Ordinary profit to Operating profit to share share equity total assets ratio net sales ratio Fiscal year ended Yen Yen % % % March 31, 2026 130.50 130.47 22.1 22.7 38.5 March 31, 2025 115.85 115.84 23.0 23.6 38.8 Reference: Share of profit (loss) of entities accounted for using equity method For the fiscal year ended March 31, 2026: ¥ - million For the fiscal year ended March 31, 2025: ¥ - million (2) Consolidated financial position Total assets Net assets Equity-to-asset ratio Net assets per share As of Millions of yen Millions of yen % Yen March 31, 2026 339,307 267,716 78.8 639.03 March 31, 2025 312,982 226,303 72.3 540.68 Reference: Equity As of March 31, 2026: ¥ 267,313 million As of March 31, 2025: ¥ 226,148 million (3) Consolidated cash flows Cash flows from Cash flows from Cash flows from Cash and cash operating activities investing activities financing activities equivalents at end of period Fiscal year ended Millions of yen Millions of yen Millions of yen Millions of yen March 31, 2026 31,380 (55,862) (26,069) 102,833 March 31, 2025 67,618 (7,273) (18,735) 150,426
2. Dividends Annual dividends Dividend paid Payout ratio Dividend on 1st 2nd 3rd Year-end Total (Consolidated) equity quarter-end quarter-end quarter-end (Consolidated) Yen Yen Yen Yen Yen Millions of yen % % Fiscal year ended - 18.00 - 22.00 40.00 17,048 34.5 7.9 March 31, 2025 Fiscal year ended - 20.00 - 25.00 45.00 19,179 34.5 7.6 March 31, 2026 Fiscal year ending March 31, 2027 - 23.00 - 23.00 46.00 33.2 (Forecast) Note: 1. As for the Year-end dividend for the fiscal year ended March 31, 2026, please refer to the “Capcom Announces Revision of Full-Year Consolidated Earnings Forecast, Variances Between its Non-Consolidated Estimated Earnings and the Previous Fiscal Year’s Actual Results, and a Dividend Forecast Revision (Upward)” announced on April 27, 2026. 2. The amount of “Dividend paid” includes dividends from the Company’s shares held by the Master Trust Bank of Japan, Ltd. (Stock Grant ESOP Trust Account 76744) (318 million yen for the year ended March 31, 2025 and 356 million yen for the year ended March 31, 2026, respectively) 3. Consolidated financial result forecasts for the fiscal year ending March 31, 2027 (from April 1, 2026 to March 31, 2027) (Percentages indicate year-on-year changes.) Net sales Operating profit Ordinary profit Profit attributable to Basic earnings per owners of parent share Millions of Millions of Millions of Millions of yen % yen % yen % yen % Yen Full year 210,000 7.5 83,000 10.2 83,000 12.0 58,000 6.3 138.65 Note: The Company discloses a full year business forecast, as it manages its business performance on an annual basis.
asic earnings per owners of parent share Millions of Millions of Millions of Millions of yen % yen % yen % yen % Yen Full year 210,000 7.5 83,000 10.2 83,000 12.0 58,000 6.3 138.65 Note: The Company discloses a full year business forecast, as it manages its business performance on an annual basis. * Notes (1) Significant changes in the scope of consolidation during the period: None Newly included: - ( Company name - ) Excluded: - ( Company name - ) (2) Changes in accounting policies, changes in accounting estimates, and restatement (i) Changes in accounting policies due to revisions to accounting standards and other regulations: None (ii) Changes in accounting policies due to other reasons: None (iii) Changes in accounting estimates: None (iv) Restatement: None (3) Number of issued shares (common shares) (i) Total number of issued shares at the end of the period (including treasury shares) As of March 31, 2026 533,011,246 shares As of March 31, 2025 533,011,246 shares (ii) Number of treasury shares at the end of the period As of March 31, 2026 114,702,403 shares As of March 31, 2025 114,743,194 shares
otal number of issued shares at the end of the period (including treasury shares) As of March 31, 2026 533,011,246 shares As of March 31, 2025 533,011,246 shares (ii) Number of treasury shares at the end of the period As of March 31, 2026 114,702,403 shares As of March 31, 2025 114,743,194 shares (iii) Average number of shares outstanding during the period Fiscal Year ended March 31, 2026 418,289,636 shares Fiscal Year ended March 31, 2025 418,254,366 shares Note: The number of treasury shares at the end of the period and the number of treasury shares deducted when calculating the average number of shares outstanding during the period under review include the Company's shares held by the Stock Grant ESOP trust.
[Reference] Overview of non-consolidated financial results Non-consolidated financial results for the fiscal year ended March 31, 2026 (from April 1, 2025 to March 31, 2026) (1) Non-consolidated operating results (Percentages indicate year-on-year changes.) Net sales Operating profit Ordinary profit Net profit Fiscal year ended Millions of yen % Millions of yen % Millions of yen % Millions of yen % March 31, 2026 184,078 14.2 70,835 11.8 68,462 11.1 51,087 12.1 March 31, 2025 161,208 11.9 63,371 16.8 61,640 11.6 45,565 11.8 Basic earnings per share Diluted earnings per share Fiscal year ended Yen Yen March 31, 2026 122.13 122.10 March 31, 2025 108.94 108.93 (2) Non-consolidated financial position Total assets Net assets Equity-to-asset ratio Net assets per share As of Millions of yen Millions of yen % Yen March 31, 2026 334,717 230,200 68.7 549.38 March 31, 2025 311,480 196,711 63.1 469.93 Reference: Equity As of March 31, 2026: ¥ 229,812 million As of March 31, 2025: ¥ 196,555 million * Financial results reports are exempt from audit conducted by certified public accountants or an audit firm.
Thunderful Group’s interim report for the first quarter of 2024 details a period of significant financial decline and aggressive corporate restructuring. Net revenue fell 27.7 percent to 391.7 MSEK, while the group recorded an operating loss (EBIT) of 184.4 MSEK, a sharp reversal from the 19.2 MSEK profit reported in the same period the previous year. This downturn was driven by a 35.5 percent revenue drop in the Games segment and a 25.7 percent decrease in Distribution, largely due to weaker market demand for Nintendo Switch products and the underperformance of the internal title SteamWorld Build. To address these challenges, the group initiated a restructuring program aimed at annual cost savings of 90–110 MSEK. This process involved a 72.4 MSEK write-down of capitalized development costs following the cancellation or divestment of twelve game projects. Strategic shifts include the divestment of the German publishing subsidiary Headup GmbH and the sale of Nordic Game Supply’s assets to reduce net debt. Despite these pressures, the group successfully extended its Nintendo distribution agreement for the Nordics and Baltics through March 2026 and reported 13.9 percent growth in its Amo Toys division. The report covers the group’s global operations with a focus on European and Nordic markets for the period of January to March 2024. Financial data indicates a strained liquidity position, with cash and credit facilities dropping to 130.9 MSEK from 329.3 MSEK year-over-year. Management secured a bank waiver conditional on asset divestments and maintains that current funds are sufficient for continued operations. The overarching strategy moving forward emphasizes a simplified games portfolio, more rigorous project validation, and a balanced risk profile across internal and external development.
The FY2025 third‑quarter financial highlights for Koei Tecmo Holdings detail a modest decline in core operating metrics while comprehensive income rises sharply. Net sales for the nine months ended December 31, 2025 fell 1.6% to ¥51,729 million from ¥52,570 million in the prior year. Operating profit slipped 3.3% to ¥14,571 million, and ordinary profit decreased 6.2% to ¥31,099 million. Despite these contractions, comprehensive income surged 52.0% year‑on‑year to ¥56,359 million, driven by significant gains in non‑operating items such as interest income and foreign exchange gains. Basic earnings per share declined slightly to ¥73.84 from ¥79.67, reflecting a higher weighted‑average share count due to treasury share disposals and secondary offerings. Total assets expanded from ¥209,828 million at March 31, 2025 to ¥311,492 million by December 31, 2025, largely through increases in investment securities and property, plant, and equipment. Net assets rose to ¥258,716 million, with the equity‑to‑asset ratio improving to 82.8% from 89.9%. Treasury shares reduced dramatically, lowering the average number of outstanding shares to 322 million from 315 million. Dividend policy remains unchanged, with a forecast of ¥43.00 per share for the fiscal year ending March 31, 2026, and no revisions to cash dividend forecasts. The report covers Japan‑based operations for FY 2025, presenting consolidated quarterly financial statements without significant changes in consolidation scope or accounting policies.
For the Fiscal Year Ending March 2021 Highlights on FY2020 KT Full-Year Results (Million Yen) FY19 Results FY20 Results Vs Previous Year Amount Component Amount Component ...
Financial highlights for the third quarter of fiscal year 2013 show a robust performance, with net sales rising 15.2 % to ¥34,639 million from the prior year’s ¥22,206 million. Gross profit increased 27.2 % to ¥13,939 million, while operating income surged 43.5 % to ¥6,208 million, and net income climbed 90.8 % to ¥5,656 million. These gains outpaced the company’s own forecasts of 6.8 % growth in net sales and 12.8 % in operating income, indicating stronger-than‑expected execution. Segment analysis reveals that Game Software remains the largest contributor, generating ¥23,718 million in sales and ¥6,229 million in operating income. Online & Mobile sales grew 21.2 % to ¥5,480 million and operating income rose 49.3 % to ¥549 million, reflecting a shift toward digital platforms. Media & Rights and Pachislot & Pachinko also posted double‑digit sales growth, while Amusement Facilities experienced a 7.7 % decline in sales and a 49.0 % drop in operating income, suggesting contraction in that area. On the balance sheet, total assets increased modestly to ¥95,679 million, driven primarily by a rise in investment securities from ¥45,339 million to ¥56,257 million. Current assets fell 34 % due to lower cash balances and receivables, but current liabilities dropped 42 % to ¥7,097 million, improving liquidity. Shareholders’ equity grew to ¥84,575 million, supported by retained earnings and a reduction in treasury stock. Overall, the company’s financial position strengthened through higher profitability, improved cash flow management, and a solid asset base.