
FinancialCapcom
FY26/3 Earnings Summary and Mid- to Long-Term Growth Strategies
41 pages~29 min full read
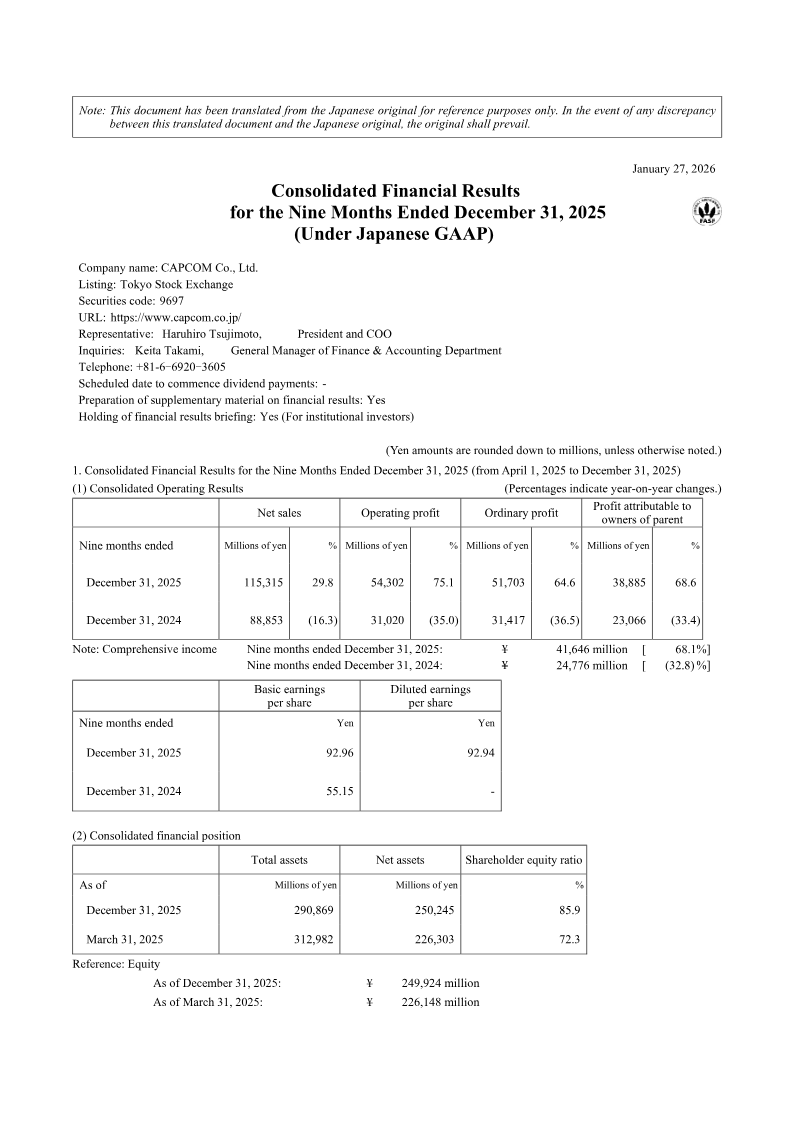
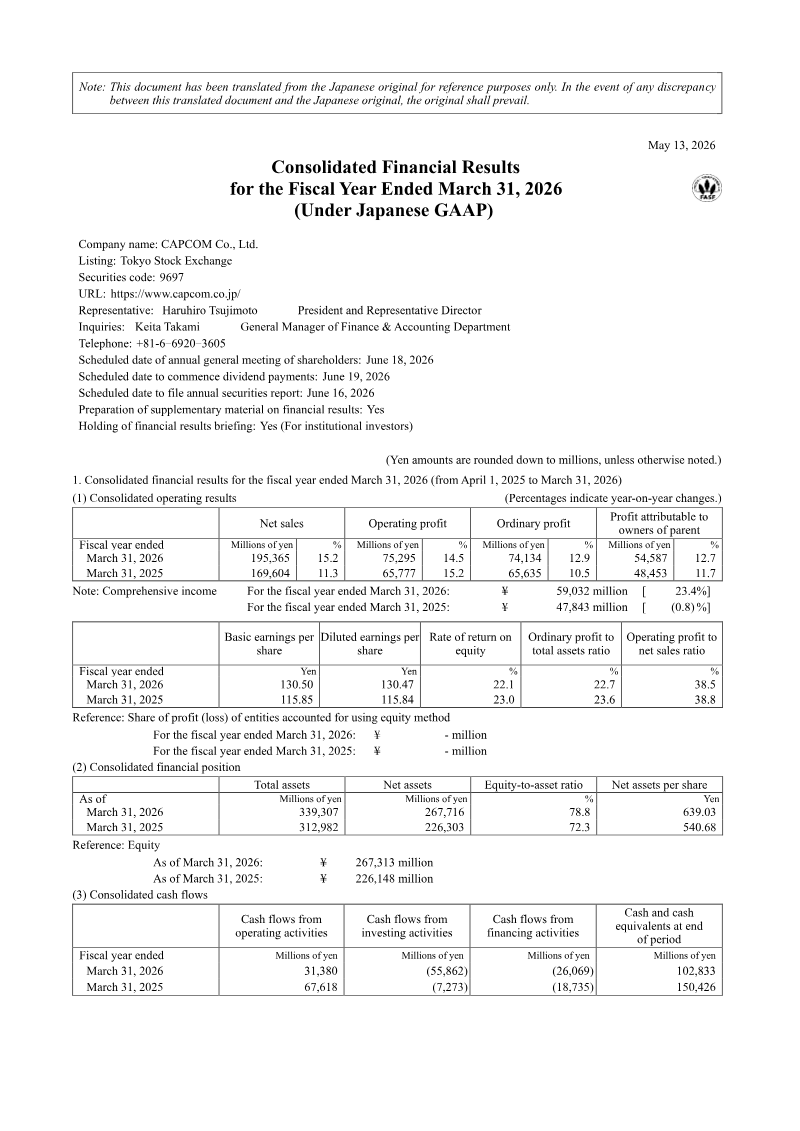
Capcom’s FY26/3 earnings marked the company’s strongest performance to date, with net sales reaching ¥1.95 bn and operating profit up 15 % year‑over‑year to ¥752 m. The growth stemmed from a “flywheel” effect: new IP releases, catalog sales, and digital distribution channels all contributed to a record 5.907 million cumulative units sold, up 13.9 % in volume. The company’s strategy for FY27/3 is to sustain this momentum, targeting a 10 %+ operating‑profit increase and expanding its retail footprint to 70 stores. Sales are projected at ¥2.09 bn, driven by quarterly releases of new IP titles and a focus on high‑margin franchises such as Resident Evil, Monster Hunter, and Street Fighter. A key pillar of the plan is a multi‑channel IP exploitation model that includes character licensing, media tie‑ins, eSports, and mobile extensions, with particular emphasis on emerging markets to push long‑term unit volumes toward 100 million.
Operationally, Capcom has broadened its development workforce from 2,842 in FY23 to an anticipated 3,180 by FY27, leveraging cross‑generational teams and a proprietary engine to enhance productivity. AI tools have reduced routine task time, freeing developers for creative work. Workforce diversity has improved, with female core‑role representation at 15.7 % and paternity leave uptake at 79.7 %. Capital allocation remains balanced, returning 30 % of cash to shareholders while investing heavily in R&D. The company’s projected operating margin for FY27/3 is 49.8 %, with a shift toward higher digital and online revenue streams, underscoring its commitment to sustainable growth across global markets.
Capcom · 2026

Capcom · 2026
Capcom · 2026
Capcom · 2026
Capcom · 2025
Capcom · 2023
Capcom

Capcom
Nintendo · 2024

Koei Tecmo

Koei Tecmo

Ubisoft · 2026
Aream & Co · 2026
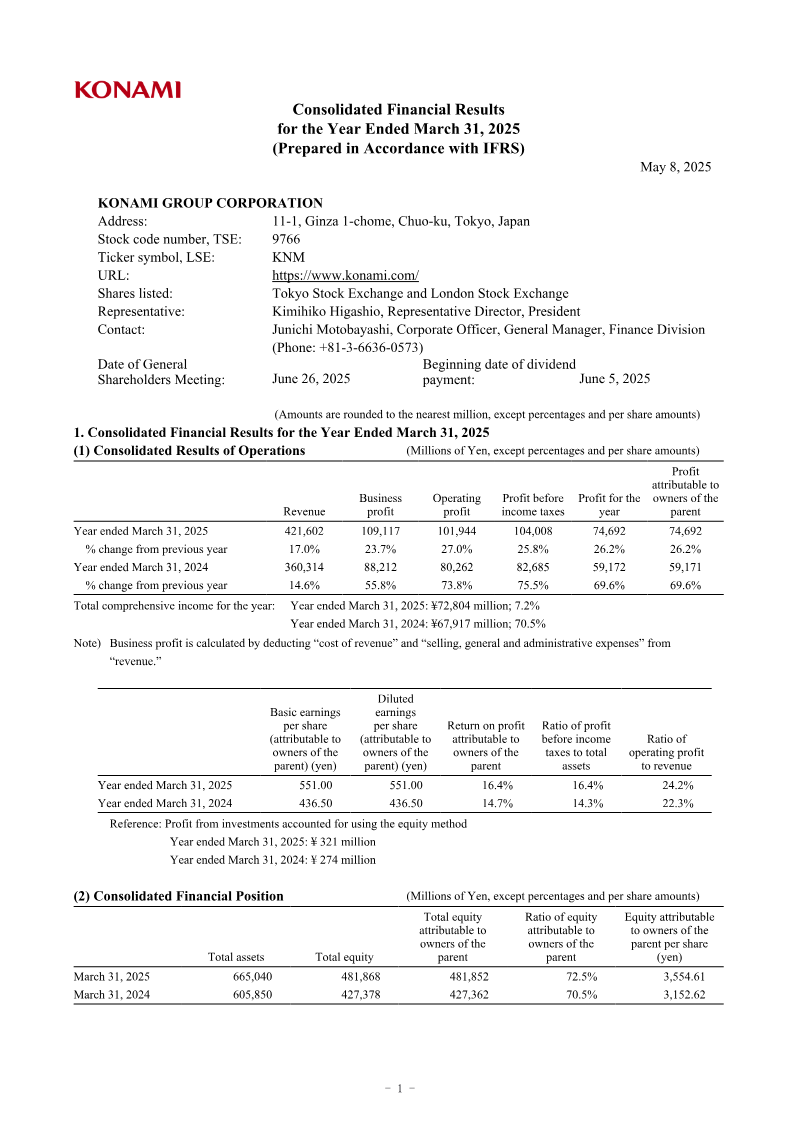
Konami · 2025
Konvoy · 2024
DDM · 2024

Bandai Namco · 2021

Bandai Namco · 2017
Bandai Namco · 2014

Bandai Namco · 2012