FinancialNippon Ichi Software
Financial Results for the Fiscal Year Ended March 31, 2026: Japan
15 pages~8 min full read
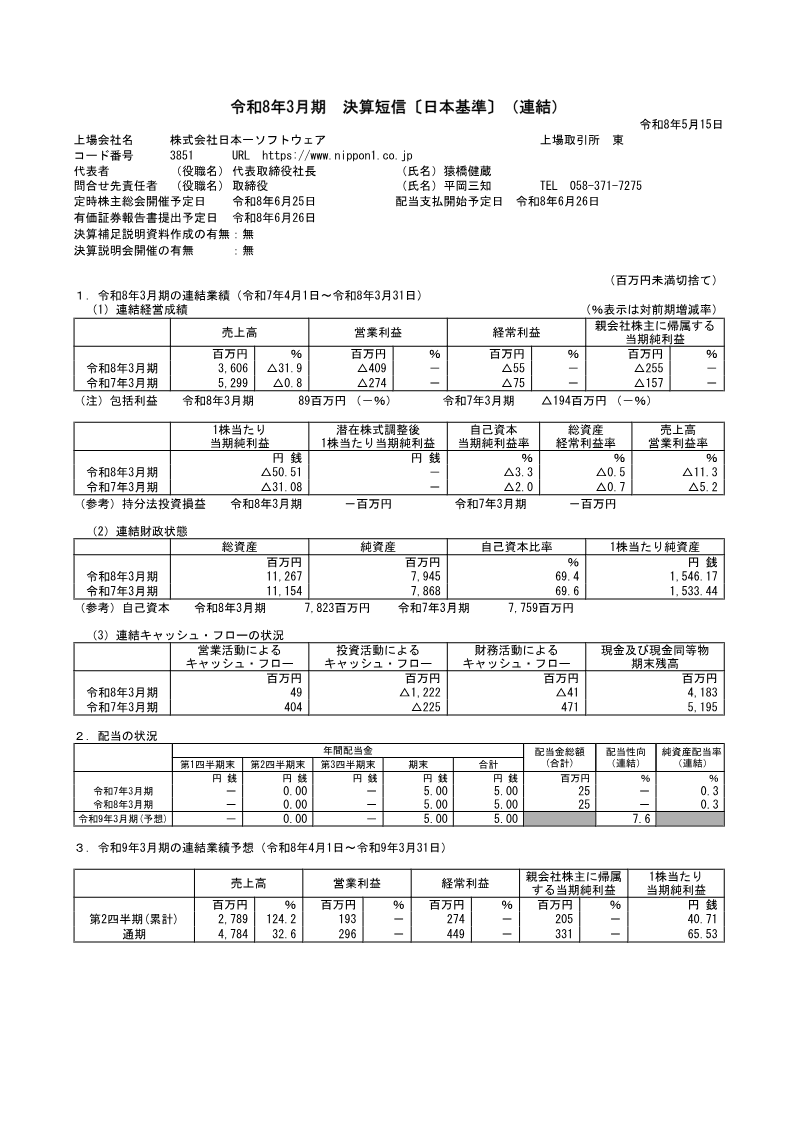
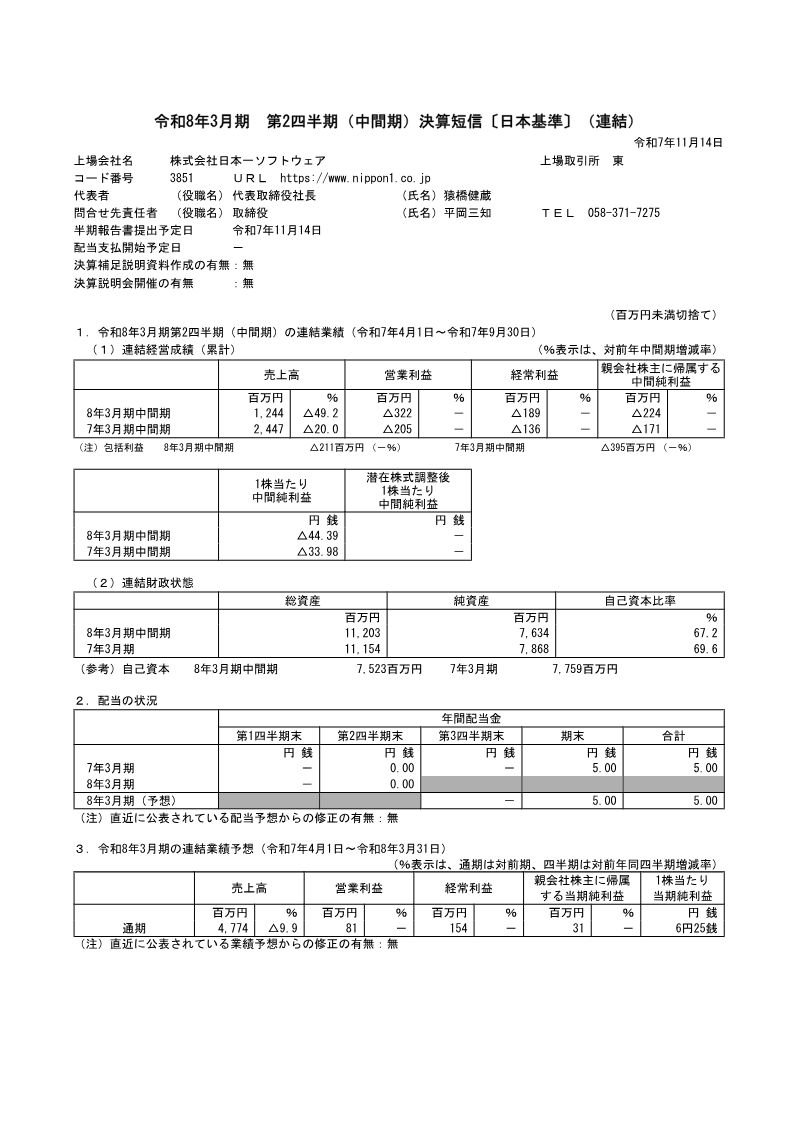
The fiscal year ending March 31, 2026 (Reiwa 8) reported a consolidated revenue decline of 31.9 % to ¥3,606 million, driven by a sharp contraction in the entertainment segment. Operating loss widened to ¥409 million from ¥274 million, and ordinary loss rose to ¥55 million. Net loss attributable to parent shareholders reached ¥256 million, a 63 % increase from the prior year. The company’s equity base remained robust at ¥7,945 million with a 69.4 % equity ratio; total assets grew modestly to ¥11,267 million.
Cash‑flow analysis shows operating cash inflows fell dramatically to ¥50 million, reflecting the loss and a significant decline in accounts receivable. Investment activities produced a net outflow of ¥1,223 million, largely due to deposits and asset purchases. Financing cash use was modest at ¥42 million, driven by dividend payments of ¥25 million and debt repayments.
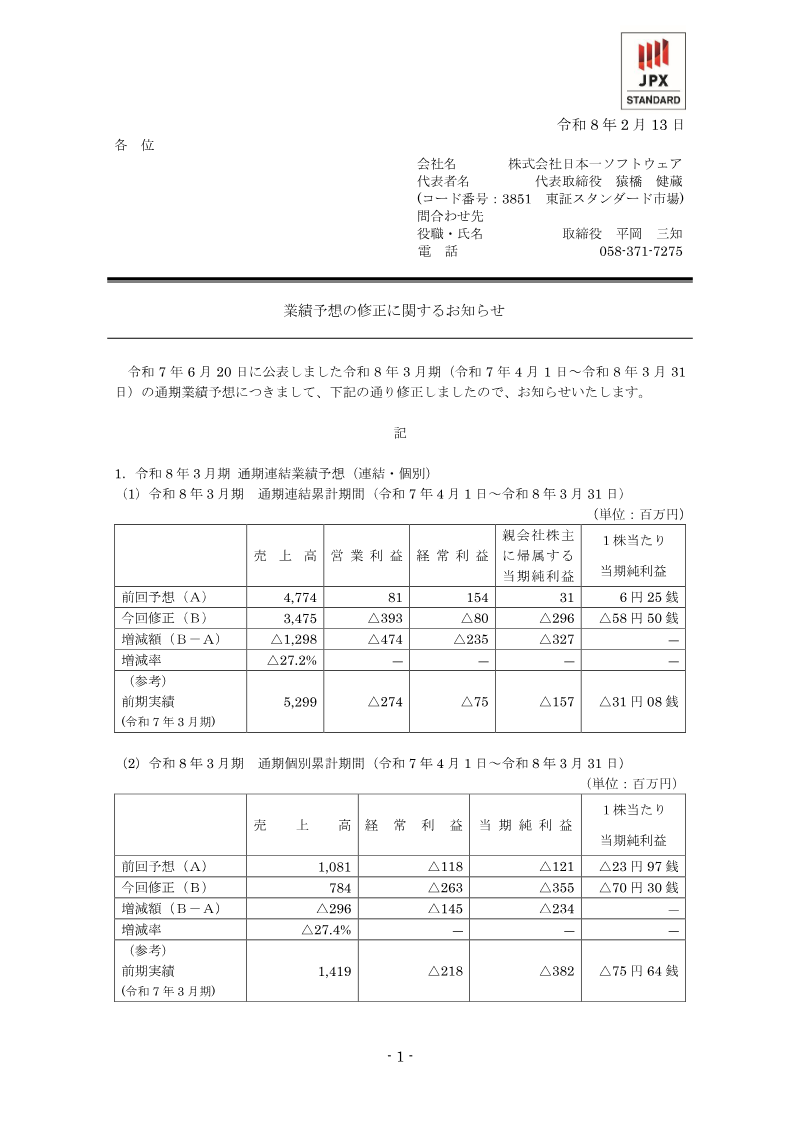
Dividend policy stayed unchanged: a 5 % payout ratio on retained earnings, with total dividends of ¥25 million. The board projected a 32.6 % revenue increase to ¥4,784 million for the following year, with operating profit turning positive at ¥296 million and net profit of ¥332 million. Forecasts rely on continued expansion in digital distribution, overseas localization, and student‑housing operations.
Geographically, the company operates primarily in Japan with international sales through PlayStation Network, Nintendo e‑Shop, Steam, and NIS America. The reporting period covers the Japanese market only; no foreign subsidiaries are listed. Methodologically, figures derive from audited consolidated financial statements under Japanese GAAP, with no changes in accounting policy or significant adjustments noted.
Nippon Ichi Software · 2026
Nippon Ichi Software · 2026

Nippon Ichi Software · 2026

Nippon Ichi Software · 2025
Nippon Ichi Software · 2025
Nippon Ichi Software · 2025
Nippon Ichi Software · 2025
Nippon Ichi Software · 2025
Nippon Ichi Software · 2024
Nippon Ichi Software · 2024

Nippon Ichi Software

Nippon Ichi Software
GREE

Capcom · 2026

Capcom · 2026
Square Enix · 2025
Sega Sammy Holdings · 2025
Nintendo · 2025
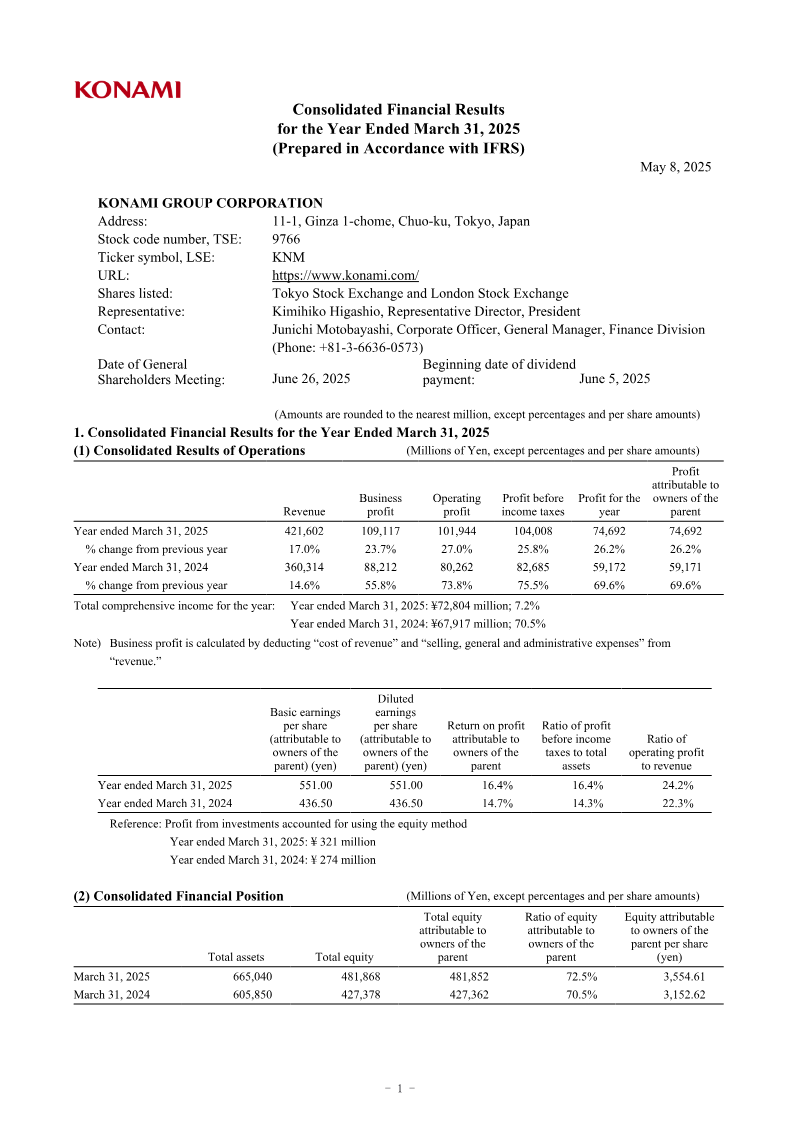
Konami · 2025

Nintendo · 2024

Bandai Namco · 2021
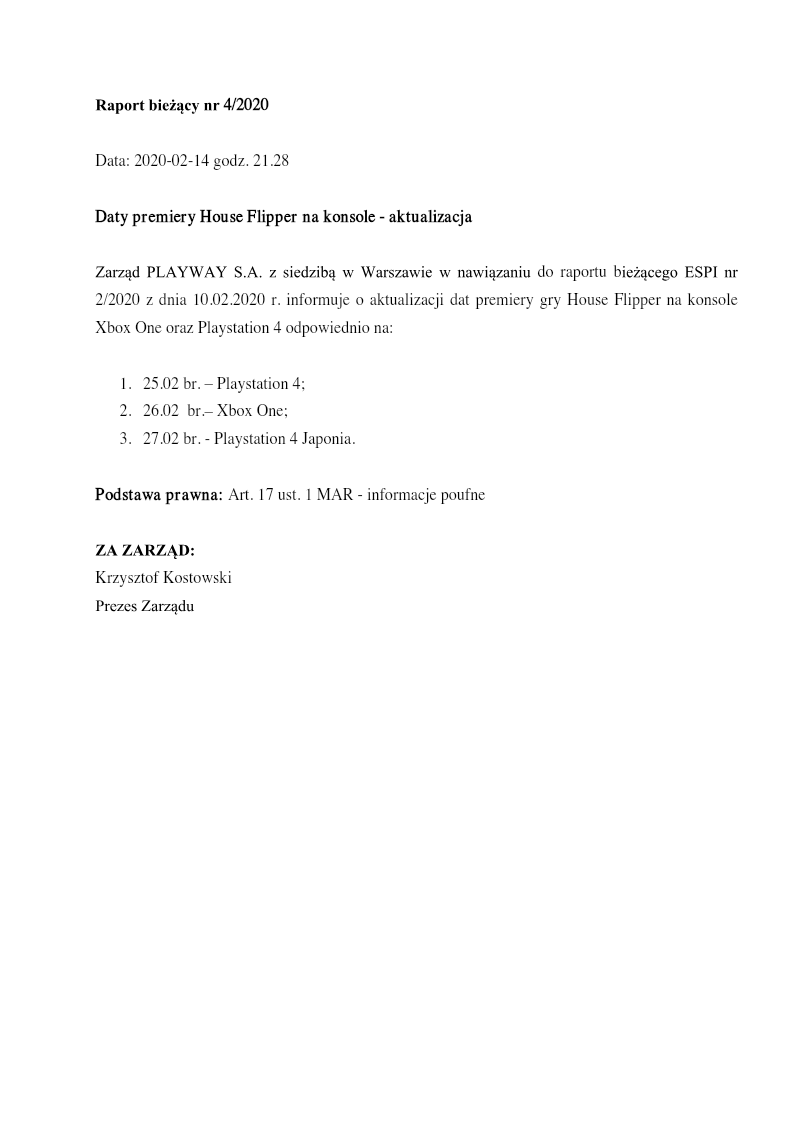
PlayWay · 2020
Bandai Namco · 2019
Bandai Namco · 2018