FinancialNippon Ichi Software
Financial Results for the Second Quarter: Japan (FY 2026/03)
12 pages~4 min full read
Key insights
6 takeaways · ~2 min read- 01
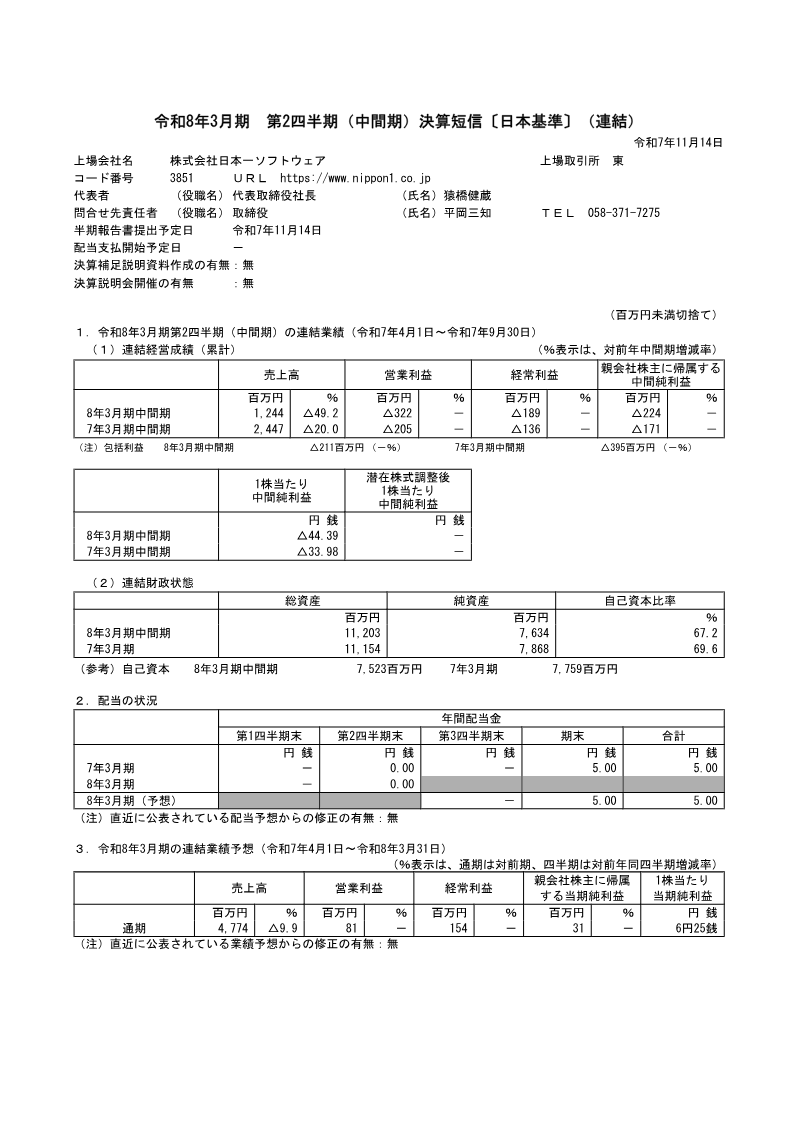
Consolidated sales for Q2 FY2026/03 plummeted 49.2% to ¥1,244 million, resulting in a widened operating loss of ¥322 million compared to ¥206 million in the prior year.
See it on page 8 - 02
The core entertainment business, encompassing game development and digital distribution, saw a 50.6% revenue decline to ¥1,184 million and an operating loss of ¥96 million.
See it on page 4 - 03
Cash balances dropped by ¥1,544 million to ¥3,652 million, driven by a negative operating cash flow of ¥306 million and significant investing outflows of ¥1.48 billion.
See it on page 5 - 04
Full-year revenue is projected to fall 9.9% to ¥4,774 million, with management anticipating that operating and ordinary losses will continue to widen.
See it on page 8 - 05
The company's financial position weakened as equity declined to ¥7,635 million and the equity ratio dropped from 69.6% to 67.2%.
See it on page 7 - 06
The student-dormitory and services segment grew sales by 25.1% to ¥60 million, though the division remained unprofitable with an operating loss of ¥8 million.
See it on page 4