Updated Apr 30, 2026 by Tencent
Financial
Published by Tencent
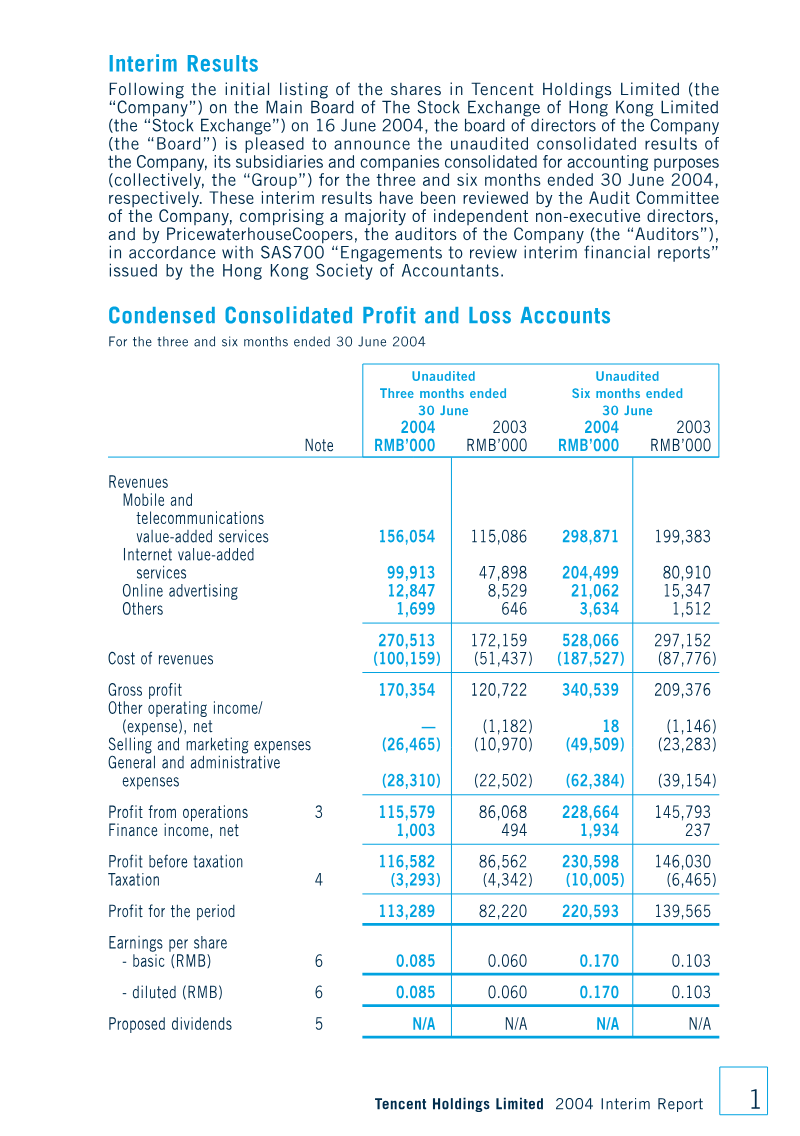
Tencent Holdings Limited demonstrated robust financial performance during the first half of 2010, characterized by a 65.3% year-over-year revenue increase to RMB 8.895 billion. This growth was underpinned by strong expansion across its core business segments, including Internet value-added services, mobile and telecommunications services, and online advertising. The latter segment experienced a notable surge, bolstered by high-profile global events such as the World Cup and the World Expo. Profit attributable to equity holders rose significantly to RMB 3.699 billion, reflecting the company’s ability to scale its IM and Qzone platforms while maintaining a solid asset base of RMB 24.6 billion. The company’s strategic trajectory during this period focused on aggressive market expansion and talent retention. Research and development expenditures climbed to RMB 758 million, signaling a commitment to technological innovation, while the workforce expanded to 8,687 employees. To align employee interests with long-term growth, Tencent utilized comprehensive share option and award schemes, governed by strict mandate limits and valuation models. Furthermore, the company pursued international growth through strategic investments, most notably acquiring a stake in Digital Sky Technologies, while simultaneously managing financial risks through foreign exchange forward contracts and the consolidation of equity in subsidiaries like Shenzhen Domain. Looking toward the future, the company remains positioned to navigate an increasingly competitive and regulated landscape by prioritizing mobile internet development and enhancing its online gaming portfolio. Despite rising operating costs and marketing investments, the firm maintains a stable financial structure and a clear governance framework, with MIH China (BVI) Limited continuing as the primary shareholder. These results confirm a period of rapid scaling and operational maturity for the organization as it solidified its dominance within the Chinese internet sector throughout the first half of 2010.
Tencent Holdings Limited EXPO ALXX Incorporated in the Cayman Islands with limited liability 2IO o0.com SHANGHAI CHINA B 2010- Exclusive Online Senior Sponsor of Exp0 2010 Shanghal China (Stock Code 1: 700) 2010.QQ.com 2010 INTERIM REPORT
Interim Report The board of directors (the “Board”) of Tencent Holdings Limited (the “Company”) is pleased to announce the unaudited consolidated results of the Company and its subsidiaries (collectively, the “Group”) for the three and six months ended 30 June 2010. These interim results have been reviewed by PricewaterhouseCoopers, the auditor of the Company (the “Auditor”), in accordance with International Standard on Review Engagements 2410 “Review of interim financial information performed by the independent auditor of the entity” issued by the International Auditing and Assurance Standards Board, and by the audit committee of the Company (the “Audit Committee”), comprising a majority of the independent non-executive directors of the Company. Consolidated Statement of Financial Position Tencent As at 30 June 2010 Unaudited Audited Holdings 30 June 31 December 2010 2009 Note RMB’000 RMB’000 ASSETS Limited Non-current assets Fixed assets 5 2,822,058 2,517,202 Construction in progress 5 179,678 105,771 Investment properties 5 67,613 68,025 Land use rights 5 232,248 35,296 1 Intangible assets 5 265,961 268,713 Investment in associates 6 799,982 477,622 Interim Deferred income tax assets 21 272,708 301,016 Held-to-maturity investments 7 – 341,410 Available-for-sale financial assets 8 2,284,894 153,462 Report Prepayments, deposits and other assets 10 423,749 80,306
96 1 Intangible assets 5 265,961 268,713 Investment in associates 6 799,982 477,622 Interim Deferred income tax assets 21 272,708 301,016 Held-to-maturity investments 7 – 341,410 Available-for-sale financial assets 8 2,284,894 153,462 Report Prepayments, deposits and other assets 10 423,749 80,306 Current assets 7,348,891 4,348,823 2010 Accounts receivable 9 1,710,749 1,229,436 Prepayments, deposits and other assets 10 401,819 373,642 Derivative financial instruments 11 17,578 – Term deposits with initial term of over three months 12 7,422,082 5,310,168 Restricted cash 19(a) 1,214,493 200,000 Cash and cash equivalents 13 6,486,312 6,043,696 17,253,033 13,156,942 Total assets 24,601,924 17,505,765
Consolidated Statement of Financial Position (Continued) As at 30 June 2010 Unaudited Audited 30 June 31 December 2010 2009 Note RMB’000 RMB’000 EQUITY Equity attributable to the Company’s equity holders Share capital 14 198 197 Share premium 14 1,352,114 1,244,425 Tencent Shares held for share award scheme 14 (236,114) (123,767) Share-based compensation reserve 14 924,309 703,563 Other reserves 90,238 (166,364) Retained earnings 13,449,624 10,520,453 Holdings Non-controlling interests 15,580,369 12,178,507 60,174 120,146 Total equity 15,640,543 12,298,653 Limited LIABILITIESliabilities Non-current Deferred income tax liabilities 21 481,517 369,983 Long-term payables 18 – 274,050 2 481,517 644,033 Interim Current liabilities 16 1,028,726 696,511 Accounts payable Other payables and accruals 17 1,994,316 1,626,051 Report Short-term bank borrowings 19 2,755,116 202,322 Current income tax liabilities 358,733 85,216 Other tax liabilities 173,308 216,978 2010 Deferred revenue 20 2,169,665 1,736,001 8,479,864 4,563,079 Total liabilities 8,961,381 5,207,112 Total equity and liabilities 24,601,924 17,505,765 Net current assets 8,773,169 8,593,863 Total assets less current liabilities 16,122,060 12,942,686 On behalf of the board of directors of the Company Ma Huateng Zhang Zhidong Director Director The accompanying notes on pages 6 to 54 form an integral part of this interim financial information.
Consolidated Statement of Comprehensive Income For the three and six months ended 30 June 2010 Unaudited Unaudited Three months ended Six months ended 30 June 30 June 2010 2009 2010 2009 Note RMB’000 RMB’000 RMB’000 RMB’000 Revenues Internet value-added services 3,581,976 2,156,468 6,969,353 4,061,031 Mobile and telecommunications value-added services 674,120 470,003 1,292,358 909,548 Online advertising 397,520 243,044 601,854 389,607 Tencent Others 15,564 8,908 31,675 22,602 4,669,180 2,878,423 8,895,240 5,382,788 Cost of revenues 24 (1,482,939) (934,613) (2,811,294) (1,720,527) Holdings Gross profit 3,186,241 1,943,810 6,083,946 3,662,261 Interest income 22 54,005 27,520 111,196 61,569 Limited Other gains/(losses), net 23 27,415 (2,192) (7,860) (37,012) Selling and marketing expenses 24 (230,340) (114,587) (415,757) (212,692) General and administrative expenses 24 (665,961) (455,629) (1,251,727) (910,647) Operating profit 2,371,360 1,398,922 4,519,798 2,563,479 Finance costs 25 (2,976) (653) (4,534) (405) 3 Share of profit of associates 11,334 3,452 24,247 8,824 Interim Profit before income tax 2,379,718 1,401,721 4,539,511 2,571,898 Income tax expense 26 (448,525) (199,973) (805,900) (316,540) Profit/Total comprehensive Report income for the period 1,931,193 1,201,748 3,733,611 2,255,358 Attributable to: 2010 Equity holders of the Company 1,916,502 1,192,410 3,699,696 2,227,850 Non-controlling interests 14,691 9,338 33,915 27,508 1,931,193 1,201,748 3,733,611 2,255,358 Earnings per share for profit attributable to equity holders of the Company during the period (expressed in RMB per share) - basic 27 1.054 0.662 2.039 1.239
mpany 1,916,502 1,192,410 3,699,696 2,227,850 Non-controlling interests 14,691 9,338 33,915 27,508 1,931,193 1,201,748 3,733,611 2,255,358 Earnings per share for profit attributable to equity holders of the Company during the period (expressed in RMB per share) - basic 27 1.054 0.662 2.039 1.239 - diluted 27 1.031 0.647 1.990 1.213 The accompanying notes on pages 6 to 54 form an integral part of this interim financial information.
Record high profits were achieved! FY2017 Strengthening digital marketing FY2018 YoY Change Amount Ratio Amount Ratio Amount Rate of change Sales 38,926 100.0% 38,968 100.0% 42 0.1% Operating 30.1% 0 Developing new markets in Asia Profit 11,711 12,092 31.0% 381 3.3% Ordinary 18,293 47.0% 11,711 47.0% Profit 18,307 ...
Incorporated in the Cayman Islands with limited liability smart communication inspires 2024 P Interim Report 33 Financial Performance Highlights Financial Performance Highlights 88 Management Discussion and Analysis 22 Report on Review of Interim Financial Information 23 Condensed Consolidated Income Statement 23 Condensed Consolidated Income Statement 24 Condensed Consolidated Statement of Comprehensive Income 24 Condensed Consoli...
7 MANAGEMENT DISCUSSION AND ANALYSIS 85 CORPORATE GOVERNANCE REPORT 85 CORPORATE GOVERNANCE REPORT 119 INDEPENDENT AUDITOR'S REPORT 119 INDEPENDENT AUDITOR’S REPORT 128 CONSOLIDATED INCOME STATEMENT 128 CONSOLIDATED INCOME STATEMENT 129 CONSOLIDATED STATEMENT OF COMPREHENSIVE INCOME 130 CONSOLIDATED STATEMENT OF FINANCIAL POSITION 133 CONSOLIDATED STATEMENT OF CHANGES IN EQUITY 137 CONSOLIDATED STATEMENT OF CASH FLOWS 139 NOTES TO THE CONSOLIDATED FINANCIAL STATEMENTS 1...
Incorporated in the Cayman Islands with limited liability 3 Financial Performance Highlights 3 Financial Performance Highlights 9 Management Discussion and Analysis 9 Management Discussion and Analysis 23 Report on Review of Interim Financial Information Report on Review of Interim Financial Information 24 Consolidated Income Statement 25 Consolidated Statement of Comprehensive Income 26 Consolidated Statement of Financial Position 29 Consolidated Statement o...