Report29 pages
Gaming Industry Report: Q4 2022
The analysis presents a comprehensive overview of the global gaming market in 2022 and its projected trajectory to 2027, emphasizing a modest expansion of the sector’s revenue base and a shifting investment landscape. The market reached $184.4 billion in 2022, a 2.3 % year‑over‑year increase, and is forecast to climb to $283 billion by 2027, reflecting an annual growth rate of roughly 9 %. Mobile platforms remain the dominant distribution channel, accounting for $116 billion of consumer spend in 2021, or 64 % of total gaming revenue, while console and emerging XR segments experience divergent pressures.
Venture capital activity illustrates a pronounced contraction after a 2021 peak, with total funding falling from $8.8 billion to $5.3 billion in 2022 and growth‑stage deals declining despite a stable number of transactions. Funding for web3 gaming collapsed by 83 % in Latin America and saw a global downturn, driven by concerns over token utility, game quality, and high-profile fraud incidents. Concurrently, regulatory scrutiny intensified, particularly around data‑privacy measures such as Apple’s IDFA and Google’s AAID, which have raised user‑acquisition costs and forced developers to prioritize content depth over advertising efficiency.
Corporate liquidity underscores a robust M&A environment: gaming firms collectively hold $47.7 billion in cash, while major tech companies with gaming divisions command $157 billion. Nevertheless, gaming‑focused ETFs underperformed, with ESPO and GAMR posting year‑to‑date declines of 35 % and 37 % respectively. The report draws on a blend of public market data, venture‑capital databases, and industry surveys from sources such as CB Insights, Newzoo, and major console manufacturers, covering all major regions and spanning the period from 2019 through Q4 2022.
- The global gaming market reached $184.4 billion in 2022, a 2.3% year-over-year increase, with projections estimating growth to $283 billion by 2027.
- Mobile gaming remains the primary revenue driver, accounting for 64% of total industry spend, or $116 billion in 2021.
- Venture capital funding for the gaming sector contracted significantly in 2022, falling from $8.8 billion to $5.3 billion, with web3 gaming experiencing a global downturn and an 83% funding collapse in Latin America.
- Regulatory changes to data privacy, specifically Apple’s IDFA and Google’s AAID, have increased user-acquisition costs and shifted developer focus toward content depth over advertising efficiency.
- Despite a robust M&A environment supported by $47.7 billion in cash held by gaming firms and $157 billion by major tech companies, gaming-focused ETFs like ESPO and GAMR declined by 35% and 37% respectively in 2022.
+2
KonvoyOct 2022
Report54 pages
2022 Blockchain Gaming Report: New Frontiers And The Path Forward
The blockchain gaming industry underwent a significant market correction in late 2022, signaling a transition from speculative "Play-to-Earn" (P2E) models toward more sustainable, gameplay-focused ecosystems. While unique active wallets stabilized at approximately one million, NFT transaction volumes fell 30% to $500 million, and major project market capitalizations plummeted by over 90%. Despite a 19% year-over-year decline in total deal value to $875 million in the third quarter, the sector saw a 2.6x increase in the number of funding deals. This shift indicates a move away from infrastructure-heavy "picks and shovels" investments toward seed-stage funding for game studios and user-friendly wallet solutions.
The collapse of unsustainable economic designs has catalyzed a pivot toward "Free-to-Own" (F2O) and "Play-and-Own" (P&O) models. These frameworks prioritize fun-first gameplay and lower entry barriers by offering free initial digital assets, moving away from the yield-focused mechanics that previously dominated the space. This evolution is supported by a significant talent migration from traditional AAA and mobile gaming companies, which is professionalizing development and introducing more sophisticated tokenomics. Furthermore, the industry is expanding its reach through casual genres and the integration of established intellectual properties from major Asian studios like Square Enix and SEGA.
Mass adoption efforts are increasingly focused on distribution and technical scalability. Notable milestones include the launch of blockchain titles on mainstream platforms like the Epic Games Store and the clarification of NFT guidelines within the Apple App Store. However, the industry faces ongoing challenges, including a crisis in the gaming guild model and intensifying regulatory scrutiny. As the SEC investigates major entities regarding the classification of digital assets as securities, developers are balancing innovation in on-chain mechanics and AI-driven content with the need for compliance in an increasingly complex global legal landscape.
- The blockchain gaming sector shifted from speculative 'Play-to-Earn' models toward 'Free-to-Own' and 'Play-and-Own' frameworks that prioritize gameplay over yield-focused mechanics.
- Market valuations for major projects dropped by over 90% in 2022, while NFT transaction volumes fell 30% to $500 million despite unique active wallets stabilizing at approximately one million.
- Investment activity transitioned toward seed-stage game studios and user-friendly wallets, resulting in a 2.6x increase in the number of funding deals even as total deal value declined 19% year-over-year to $875 million in Q3.
- The industry is professionalizing through a significant talent migration from traditional AAA and mobile gaming companies, alongside the integration of established IP from major Asian studios like Square Enix and SEGA.
- Blockchain titles are gaining mainstream distribution through the Epic Games Store and clarified NFT guidelines on the Apple App Store.
+2
CMC ResearchOct 2022
Report14 pages
Female Gamers in Asia: Version for Women in Games Asia Panel
Female gamers represent a primary engine of growth within the Asian interactive entertainment market, accounting for 35% of the region's 1.46 billion total gamers as of 2021. This demographic is expanding at a faster rate than the general gaming population, with a year-over-year growth of 7.6% compared to the total market increase of 5.0%. The scope of this analysis covers China and the Asia-10 markets, which include Chinese Taipei, India, Indonesia, Japan, Korea, Malaysia, Philippines, Singapore, Thailand, and Vietnam. Data was derived from a 2021 survey of over 6,500 randomized respondents who identified as active gamers across mobile, PC, and console platforms.
Mobile gaming is the dominant platform for this demographic, utilized by 95% of female gamers, while 60% engage with PC games and 17% use consoles. In terms of genre, female players in Asia show a strong preference for role-playing, racing, and strategy games. Discovery of new titles is primarily driven by social recommendations from friends, followed by the visual quality of graphics and core gameplay mechanics.
Monetization trends indicate that female gamers are highly engaged with in-game economies, with 84% of those willing to spend making in-game purchases. They are particularly inclined toward purchasing cosmetic items and participating in gacha mechanics. In 2021, female gamer spending reached $13.07 billion in China and $5.52 billion across the Asia-10 for mobile titles, while PC game spending reached $9.70 billion and $3.93 billion in those respective regions. These findings suggest that gender inclusivity and targeted development for diverse interests are essential for capturing the full economic potential of the Asian games industry.
- Female gamers in Asia represent 35% of the region's 1.46 billion total gamers, with a year-over-year growth rate of 7.6% that outpaces the 5.0% growth of the general gaming population.
- In 2021, female gamer spending on mobile titles reached $13.07 billion in China and $5.52 billion across the Asia-10, while PC spending reached $9.70 billion and $3.93 billion respectively.
- Mobile is the primary platform for this demographic, with 95% of female gamers playing on mobile devices, compared to 60% on PC and 17% on consoles.
- Female players in Asia demonstrate high engagement with in-game economies, as 84% of those willing to spend make in-game purchases, specifically favoring cosmetic items and gacha mechanics.
- New title discovery for this demographic is driven primarily by social recommendations from friends, followed by visual graphics quality and core gameplay mechanics.
+1
Niko PartnersOct 2022
Report24 pages
Blockchain Industry Report: October 2022
The analysis evaluates the health and dynamics of the blockchain ecosystem during October 2022, revealing a sector in transition marked by divergent growth patterns across applications, platforms, and asset classes. Overall user engagement rose, with unique active wallets for decentralized applications increasing 6.8 percent to just over two million, driven primarily by explosive adoption on Arbitrum, Optimism and a dramatic surge on NEAR following its partnership with Google Cloud. By contrast, the gaming segment and Ethereum’s core wallet base contracted, falling 2 percent and 4.5 percent respectively, underscoring a shift of activity toward emerging layer‑2 solutions.
DeFi continued its rebound, with total value locked climbing 5.3 percent to $83 billion, though Ethereum retained a dominant 62 percent share of that capital. New entrants also made notable strides; the Aptos token achieved a $1 billion market capitalization within two weeks, entering the top‑50 cryptocurrencies, while Dogecoin posted the strongest price appreciation of the month at 50 percent. NFT markets displayed mixed signals: trading volume and sales declined 30 percent month‑on‑month, yet the number of unique NFT traders grew 18 percent to 1.11 million, and Polygon’s NFT volume surged 770 percent, largely propelled by Reddit‑hosted collections.
Security vulnerabilities remained a critical concern, with cross‑chain bridges accounting for 82 percent of the month’s $3.57 million in exploit losses, including high‑profile attacks on Mango Markets, TempleDAO, the QANX bridge and Rabby Swap. The combined effect of rapid user migration, uneven asset performance, and persistent bridge exploits highlights both the growth potential and the systemic risk factors shaping the blockchain industry at the close of 2022.
- Total unique active wallets for decentralized applications grew 6.8 percent to over two million in October 2022, fueled by adoption on Arbitrum, Optimism, and NEAR.
- Cross-chain bridges were the primary security risk, accounting for 82 percent of the $3.57 million in total exploit losses during the month.
- DeFi total value locked increased 5.3 percent to $83 billion, with Ethereum maintaining a 62 percent market share.
- NFT trading volume and sales fell 30 percent, yet the number of unique NFT traders rose 18 percent to 1.11 million, driven by a 770 percent volume surge on Polygon due to Reddit collections.
- The blockchain gaming segment experienced a contraction, with activity falling 2 percent as users shifted toward emerging layer-2 solutions.
+1
DappRadarOct 2022
Report69 pages
Store Intelligence Data Digest: Q4 2022
The fourth quarter of 2022 delivered a nuanced portrait of the mobile‑app ecosystem, tracking download activity across the world’s two dominant storefronts and highlighting shifts in consumer preference. Global install volume slipped marginally to 35.5 billion, a 0.1 % decline, while the Apple App Store posted a 2.4 % rise to 8.1 billion downloads and Google Play contracted 0.9 % to 27.5 billion. Instagram reclaimed the top‑ranked position worldwide, and Meta’s portfolio occupied half of the top‑ten list, underscoring the company’s entrenched influence. TikTok, CapCut and the newly launched game Stumble Guys emerged as the fastest‑growing titles, signaling continued appetite for short‑form video and casual gaming.
In the Asian market, video‑centric applications remained dominant. TikTok delivered roughly 29 million installs despite a 19 % quarter‑over‑quarter dip, while Instagram led Google Play with more than 116 million downloads, driven largely by India’s sizable user base. The FIFA World Cup spurred a surge in football‑related games, with FIFA Mobile and Soccer Super Star posting 136 % and 112 % QoQ growth respectively. New releases such as Gas (7,102 % QoQ in the United States), Makeover Studio (2,035 % QoQ) and MARVEL SNAP broke into the top‑20, and Ludo King amassed over 36 million Asian downloads.
Meta and Google continued to dominate the download landscape, with Meta recapturing the No. 1 slot on Google Play. Regional spikes, notably Stumble Guys’ peak performance in Indonesia, illustrate how localized trends can amplify global patterns. Overall, the quarter reflects a stable yet evolving market where established platforms retain supremacy while emerging titles and event‑driven spikes reshape the
- Global mobile app installs remained stable at 35.5 billion in Q4 2022, with the Apple App Store growing 2.4% to 8.1 billion downloads while Google Play contracted 0.9% to 27.5 billion.
- Meta maintained significant market influence, with Instagram reclaiming the top-ranked global position and Meta’s portfolio occupying half of the top-ten most downloaded apps.
- The FIFA World Cup drove massive engagement in sports gaming, resulting in quarter-over-quarter growth of 136% for FIFA Mobile and 112% for Soccer Super Star.
- New viral titles saw explosive growth in Q4, led by Gas at 7,102% and Makeover Studio at 2,035% quarter-over-quarter growth in the United States.
- TikTok, CapCut, and the casual game Stumble Guys emerged as the fastest-growing titles, reflecting a sustained consumer appetite for short-form video and casual gaming.
+1
Sensor TowerSept 2022

Report84 pages
DeNA Integrated Report 2022
DeNA is undergoing a strategic evolution to diversify its portfolio into two primary pillars: "Entertain," comprising Games and Live Streaming, and "Serve," focusing on Healthcare and Sports. This transition is supported by core competencies in artificial intelligence, agile in-house development, and a regional "Home Base" strategy centered in Yokohama. By leveraging high-potential technologies such as Web3 and health big data, the organization aims to balance stable cash flow from established entertainment properties with high-growth opportunities in medical data and global streaming markets.
Financial performance in fiscal year 2021 reflects this transition, with profit attributable to owners reaching 30.5 billion yen and a return on equity of 13.2%. While the Game Business experienced a revenue decline to 74.7 billion yen due to a lack of new hits, the Live Streaming segment saw a 1.4x revenue increase, and the Healthcare segment achieved its first quarterly profit. Strategic capital moves, including the sale of approximately half of the company's Nintendo shareholdings and the acquisition of subsidiaries like IRIAM and DATA HORIZON, have been implemented to increase asset efficiency and expand the medical database to over 15 million insured individuals.
Operational and governance structures have been modernized to support this multi-sector growth. The January 2022 establishment of a cross-departmental Product Development Department and a new Group Executive System aims to accelerate business execution and talent cultivation. Personnel strategies now emphasize specialized technical rankings to attract top-tier engineers, while executive compensation is increasingly linked to mid-to-long-term growth indicators. Looking ahead, the strategy focuses on releasing three to five global game titles annually, expanding the Pococha streaming service into the United States and India, and deepening the long-term strategic partnership with Nintendo to secure a robust global presence.
- DeNA is pivoting toward a dual-pillar strategy of 'Entertain' (Games and Live Streaming) and 'Serve' (Healthcare and Sports) to balance stable cash flow with high-growth sectors.
- Fiscal year 2021 financial results included 30.5 billion yen in profit attributable to owners and a 13.2% return on equity.
- The Game Business revenue declined to 74.7 billion yen due to a lack of new hits, while the Live Streaming segment grew 1.4x and the Healthcare segment achieved its first quarterly profit.
- Strategic capital reallocation included selling approximately half of the company's Nintendo shareholdings and acquiring subsidiaries like IRIAM and DATA HORIZON to expand its medical database to over 15 million insured individuals.
- The company is targeting an annual release cadence of three to five global game titles and is expanding the Pococha streaming service into the United States and India.
+1
DeNA Co.Sept 2022
Presentation13 pages
Financial Results Presentation: Half Year 2022
PCF Group S.A. presents its financial and operational results for the first half of 2022, highlighting a period of steady growth and strategic expansion. The primary objective is to maintain its trajectory toward becoming a leading global independent developer by implementing a dual-track production model. This strategy involves releasing at least one game annually starting in 2024, utilizing both traditional publisher-funded partnerships and a self-publishing framework.
Financial performance for HY 2022 shows a 17.2% increase in revenue, reaching 90.6 million PLN compared to 77.3 million PLN in HY 2021. Net profit rose by 17.5% to 25.5 million PLN. EBITDA remained stable at 29.0 million PLN, while adjusted EBITDA, accounting for warrant valuations under IFRS2, grew by 7.6% to 29.7 million PLN. The group’s balance sheet remains strong with 134.6 million PLN in cash and a 9.1% increase in equity to 283.1 million PLN. Notably, investment in development work in progress surged by 152.9%, reflecting intensified production activity.
The group’s portfolio currently consists of seven projects, including two VR titles. Key projects such as Gemini and Dagger are in pre-production, with others like Bifrost and Victoria also in development. Geographically, the company has expanded its footprint across Europe and North America, with offices in Warsaw, New York, Chicago, Montreal, and Newcastle. The total workforce grew from 495 at the end of 2021 to 580 by June 30, 2022, supported by the acquisition of Incuvo and the expansion of the PCF Framework, a proprietary software suite designed to streamline multi-studio game development.
- PCF Group S.A. achieved a 17.2% revenue increase to 90.6 million PLN and a 17.5% net profit rise to 25.5 million PLN for the first half of 2022.
- The company is executing a dual-track production strategy aiming for at least one game release annually starting in 2024 through a mix of publisher-funded and self-publishing models.
- Investment in development work in progress surged by 152.9% during the period, signaling a significant ramp-up in production activity across the group's seven active projects.
- The group maintains a strong financial position with 134.6 million PLN in cash and a 9.1% increase in equity to 283.1 million PLN.
- The workforce expanded from 495 to 580 employees by June 30, 2022, supported by the acquisition of Incuvo and the implementation of the proprietary PCF Framework for multi-studio development.
PCF GroupSept 2022
Report29 pages
The State of Social Apps in Europe 2022
The European social application market in 2022 was characterized by a significant shift from rapid user acquisition toward aggressive monetization and the rise of niche, authenticity-driven platforms. While overall download volumes stabilized following the 2020 pandemic peak, consumer spending reached a record $830 million in the first ten months of 2022, representing an 86% year-over-year increase. This financial surge was primarily driven by TikTok, which maintained its position as the region's most downloaded app while diversifying its revenue streams through gaming, music, and high-value in-app purchases. Despite this dominance, TikTok’s revenue growth began to decelerate by the third quarter of 2022, signaling a maturing market.
Competitive dynamics within the messaging and social networking subsectors revealed a diversifying landscape. Telegram emerged as a formidable challenger to WhatsApp, nearly closing the download gap and capturing significant market share in Russia. Simultaneously, BeReal disrupted the market by targeting Gen Z with dual-camera, privacy-focused content, forcing established giants like Instagram and TikTok to develop similar features to retain younger demographics. These shifts occurred against a backdrop of lower barriers to entry for new apps, as the download threshold required to reach the top of the App Store rankings declined by 30% compared to 2019.
Despite the emergence of new competitors and shifting consumer preferences, legacy platforms maintained a strong foothold across the continent. Meta-owned applications, particularly Facebook, continued to lead in monthly active users across most European markets, with sustained dominance in Central and Eastern Europe. The industry's evolution reflects a broader transition where established leaders leverage massive existing user bases to pivot toward new monetization strategies, while newcomers focus on hyper-specific engagement models to challenge the status quo in an increasingly fragmented digital ecosystem.
- European social app consumer spending reached $830 million in the first ten months of 2022, marking an 86% year-over-year increase.
- TikTok dominated the European market in 2022 but saw its revenue growth decelerate by the third quarter, indicating a maturing market.
- The barrier to entry for top-tier App Store rankings decreased, with the required download threshold falling 30% compared to 2019.
- Telegram significantly challenged WhatsApp's market share in 2022, nearly closing the download gap between the two platforms.
- BeReal’s focus on authenticity and dual-camera features forced major competitors like Instagram and TikTok to adopt similar functionality to retain Gen Z users.
+1
Sensor TowerSept 2022
Report14 pages
Video Game Streaming Trends: 2022 Third Quarter Report
The third quarter of 2022 reflects a period of stabilization for the live streaming industry as it transitions away from pandemic-era highs. While total hours watched and unique channels both decreased by 13% compared to the previous year, the market remains significantly larger than in 2019, with viewership levels nearly double those of the pre-pandemic era. Data indicates that while fewer creators are active, those remaining are broadcasting for longer durations, resulting in a 7.5% increase in total hours broadcast year-over-year.
Twitch maintains a dominant market share, accounting for 72% of total gaming hours watched, followed by YouTube at 15% and Facebook Gaming at 12%. Notably, YouTube was the only major platform to see growth in hours watched, rising 4% as high-profile creators migrated to the service. Conversely, Facebook Gaming experienced a sharp 70% decline in viewership, likely influenced by the discontinuation of its standalone app. In contrast to the broader market slowdown, the esports segment grew by 40% year-over-year, with Twitch capturing 66% of this specific market.
Content trends highlight the rising influence of VTubers and the strategic shift of esports organizations toward variety content. VTubers now represent 50% of the top ten female creators, with the top ten VTubers seeing an average viewership growth of 30% over the previous quarter. Additionally, eight of the top ten esports organizations now generate more than half of their total watch time through content creators rather than competitive matches. While established titles like Grand Theft Auto V and League of Legends continue to lead the charts, the quarter also saw a peak in gambling viewership on Twitch just prior to the implementation of new platform restrictions on unlicensed sites.
- Twitch maintains a dominant 72% market share of gaming hours watched, while YouTube grew its viewership by 4% and Facebook Gaming suffered a 70% decline following the discontinuation of its standalone app.
- The live streaming industry is stabilizing post-pandemic with total hours watched down 13% year-over-year, though current viewership remains nearly double 2019 levels.
- Esports viewership grew 40% year-over-year, with Twitch capturing 66% of this segment and eight of the top ten esports organizations now generating the majority of their watch time through non-competitive variety content.
- While the total number of active channels decreased by 13%, the remaining creators increased their output, leading to a 7.5% year-over-year rise in total hours broadcast.
- VTubers are a significant growth driver, now representing 50% of the top ten female creators and achieving an average viewership increase of 30% over the previous quarter.
+1
Stream HatchetSept 2022
Report22 pages
Drake Star Global Gaming Report Q3 2022
The global gaming industry experienced a year of unprecedented transaction volume through the first nine months of 2022, reaching a total disclosed deal value of $123 billion across 976 transactions. While a record-breaking first quarter gave way to a macroeconomic slowdown, the third quarter demonstrated resilience through a resurgence in activity, including 81 announced mergers and acquisitions and 216 private financings. This period was defined by a stark contrast between robust private investment and significant public market volatility, where major entities like Ubisoft and Roblox saw stock valuations decline by more than 45% since early 2021.
Blockchain and Web3 gaming emerged as the primary catalysts for private capital, accounting for nearly half of all private financing value and 40% of total deal rounds in the third quarter. Significant capital infusions, such as Epic Games’ $2 billion round and the $4.5 billion raised for dedicated crypto gaming funds in May 2022, underscore the sector's shift toward decentralized models and "free-to-own" mechanics. Venture capital activity remained concentrated among top-tier firms like Andreessen Horowitz and Animoca Brands, even as the broader public market faced contraction and a quiet IPO landscape.
Strategic consolidation remains a dominant trend as major players like Microsoft, Tencent, and Savvy Games Group leverage lower public valuations to pursue mid-sized acquisitions and take-private events. This shift toward consolidation is increasingly driven by a necessity for profitability and margin maintenance, particularly in high-growth regions like Southeast Asia and India, where strong revenue growth has been offset by negative EBITDA margins. Moving forward, the industry appears positioned for continued structural realignment as strategic buyers capitalize on market corrections to secure long-term intellectual property and technological infrastructure.
- The global gaming industry recorded $123 billion in deal value across 976 transactions during the first nine months of 2022.
- Blockchain and Web3 gaming dominated private investment in Q3 2022, accounting for 40% of all deal rounds and nearly half of total private financing value.
- Public market volatility has significantly impacted valuations, with major entities like Ubisoft and Roblox experiencing stock declines exceeding 45% since early 2021.
- Strategic consolidation is accelerating as major players like Microsoft, Tencent, and Savvy Games Group leverage lower public valuations to acquire mid-sized companies and pursue take-private events.
- Venture capital remains concentrated among top-tier firms such as Andreessen Horowitz and Animoca Brands, highlighted by a $2 billion funding round for Epic Games and $4.5 billion raised for crypto gaming funds in May 2022.
+1
Drake Star PartnersSept 2022

Report109 pages
Mobile Game Marketing: Insights & Trends of Popular Game Genres Q3 2022
The analysis examines mobile‑game marketing dynamics during the third quarter of 2022, concentrating on the performance of leading genres and the geographic distribution of traffic and revenue. By comparing download activity, user engagement, and monetisation across regions, it identifies where growth opportunities are emerging and which markets continue to dominate the ecosystem.
Casual games recorded only modest increases in downloads, adding roughly five million installs versus the previous quarter and less than one percent year‑on‑year growth. Despite the limited acquisition surge, daily‑active‑user and monthly‑active‑user ratios remained stable, while revenue climbed seven percent year‑on‑year, an uplift of about thirty million dollars. The United States accounted for the largest share of earnings, generating more than $250 million—46 percent of total casual‑game revenue—and posted an eleven‑percent increase over the prior year. Meanwhile, less‑developed markets showed accelerating expansion, signalling untapped monetisation potential.
Regionally, North America retained its position as the primary source of mobile‑game traffic, delivering a five‑percent year‑on‑year rise in downloads and a modest one‑percent quarter‑on‑quarter gain. Southeast Asia emerged as the fastest‑growing market, with download growth of eleven percent year‑on‑year and twelve percent quarter‑on‑quarter, underscoring its role as a catalyst for user‑base expansion. The contrast between the mature, revenue‑rich U.S. market and the rapidly scaling Southeast Asian audience highlights divergent strategic imperatives for acquisition versus monetisation.
Overall, the findings suggest that while casual‑game revenue remains anchored by the United States, future growth will be driven by intensified marketing efforts in emerging regions, particularly Southeast Asia. Companies that balance retention‑focused tactics in established markets with aggressive user‑acquisition campaigns in high‑growth territories are likely to optimise both short‑term earnings and long‑term audience development.
- The United States remains the dominant revenue driver for casual games, generating over $250 million in Q3 2022, which represents 46% of total revenue and an 11% year-on-year increase.
- Southeast Asia is the fastest-growing market for mobile game downloads, recording 11% year-on-year and 12% quarter-on-quarter growth.
- Casual games experienced stagnant download growth of less than 1% year-on-year, yet generated a 7% year-on-year revenue increase, totaling approximately $30 million in additional earnings.
- North America continues to lead in total mobile game traffic, posting a 5% year-on-year increase in downloads and a 1% quarter-on-quarter gain.
- While casual game download growth is limited, user engagement metrics—specifically daily and monthly active user ratios—remained stable throughout Q3 2022.
+2
SocialPetaSept 2022
Report19 pages
Hyper-Casual Benchmark Report Q3 2022
The hyper-casual gaming landscape continues to evolve as developers navigate shifting attribution models and monetization strategies. Analysis of the sector reveals that advertising remains the primary revenue driver, with a heavy reliance on high-volume user acquisition and optimized ad mediation. Data from 2021 and 2022 indicates that the top-performing ad networks for hyper-casual titles are those capable of delivering massive scale at low costs per install, while simultaneously providing robust monetization tools to capture value from short-lived player lifecycles.
Geographic trends show a significant concentration of activity in established markets, though emerging regions are increasingly contributing to the global install base. The industry segments covered include both Android and iOS platforms, with a specific focus on how privacy changes have impacted attribution and marketing efficiency. Statistics suggest that while the cost of acquiring users has fluctuated, the most successful publishers are those utilizing sophisticated data analytics to balance spend across a diverse range of ad networks.
Methodological insights derived from industry benchmarks highlight the importance of real-time data processing and cross-platform tracking. By examining the performance of the top ten ad networks, it becomes clear that market leadership is defined by the ability to integrate seamlessly with attribution partners. The findings conclude that the hyper-casual market remains resilient, provided that developers adapt to the technical requirements of modern mobile advertising and maintain a rigorous focus on retention metrics and effective ad placement strategies.
- Hyper-casual revenue remains primarily driven by high-volume user acquisition paired with optimized ad mediation to maximize value during short player lifecycles.
- Market leadership among ad networks is defined by the ability to deliver massive scale at low costs per install while integrating seamlessly with attribution partners.
- Successful publishers are mitigating the impact of privacy-driven attribution changes by utilizing sophisticated data analytics to balance ad spend across diverse networks.
- Real-time data processing and cross-platform tracking are essential technical requirements for maintaining performance in the current mobile advertising landscape.
- While hyper-casual activity remains concentrated in established markets, emerging regions are increasingly contributing to the global install base.
+3
TenjinSept 2022
Report43 pages
Global Cloud Gaming Report: 2022
The global cloud gaming market is entering a phase of maturity, with 2022 revenues projected to reach $2.4 billion supported by a base of 31.7 million paying users. Despite high-profile shifts in the ecosystem, such as the closure of Google Stadia, the industry remains fundamentally viable as major platform holders like Xbox and PlayStation successfully integrate cloud technology to complement traditional hardware. This evolution is primarily driven by the increasing seamlessness of services, which allows players to bypass local hardware limitations and access high-end content instantly across a diverse range of devices.
Market projections indicate a robust growth trajectory through 2025, at which point paying users are expected to reach 86.9 million and annual revenues are forecasted to climb to $8.2 billion. This expansion is underpinned by the global rollout of 5G networks, improved service profitability, and the emergence of cloud infrastructure as the foundational backbone for the metaverse. Strategic scaling by major players, including Alibaba’s YuanJing, aims to support massive concurrent user experiences while overcoming the constraints of physical hardware on a global scale.
Technological innovation in infrastructure-as-a-service models is further accelerating adoption by lowering costs for both telecom operators and consumers. By utilizing GPU edge computing within carrier networks, providers can deliver high-quality gaming experiences with reduced latency. The industry is also refining its internal metrics and consumer segmentation, distinguishing between cloud-enabled and cloud-native content to better target diverse player demographics. These developments suggest that cloud gaming is transitioning from a niche technology into a central pillar of the broader interactive entertainment landscape.
- The global cloud gaming market is projected to grow from $2.4 billion in 2022 to $8.2 billion by 2025.
- The paying user base is expected to expand significantly from 31.7 million in 2022 to 86.9 million by 2025.
- Cloud gaming is shifting from a niche technology to a core industry pillar as major platforms like Xbox and PlayStation integrate cloud services to complement traditional hardware.
- Technological advancements, specifically the deployment of 5G networks and GPU edge computing within carrier networks, are reducing latency and lowering costs for providers and consumers.
- Cloud infrastructure is increasingly positioned as the foundational backbone for the metaverse, with companies like Alibaba’s YuanJing scaling to support massive concurrent user experiences.
+1
NewzooSept 2022
Report48 pages
Market Outlook 2022: An Overview & Analysis of Industry Trends
The global mobile gaming market is currently undergoing a period of stabilization following unprecedented pandemic-era growth, characterized by a slight 6% year-over-year revenue decline to $21.2 billion in early 2022. Despite this correction, the industry maintains a high baseline of approximately 14 billion quarterly downloads and is projected to reach $117 billion in annual revenue by 2026. While casual titles account for 78% of total downloads, the financial core of the industry remains the mid-core segment, specifically RPG and strategy genres, which generate 60% of all player spending. Growth is increasingly concentrated in Asia-Pacific markets, though Western regions are showing significant engagement spikes driven by major intellectual property launches.
The RPG and MMORPG sectors remain the primary engines of monetization, particularly in Asian markets which contribute 80% of total genre revenue. However, the successful launch of titles like Diablo Immortal, which earned $28 million in its first six weeks in the United States, signals an expanding Western appetite for these complex mobile experiences. Simultaneously, the card battler sub-genre has emerged as a top-five growth category, benefiting from cross-media synergies and established franchises. This expansion is supported by a strategic shift in advertising, as developers increasingly leverage social platforms like YouTube and Instagram to capture a higher share of voice among target demographics.
Market leadership in the strategy and RTS segments is shifting, with China surpassing the United States in player spending for real-time strategy titles. While established leaders like Clash Royale maintain global dominance, the success of newer entries demonstrates that local market expertise and the integration of popular IPs are essential for sustained growth. As the industry moves toward a projected 73 billion annual downloads by 2026, the reliance on sophisticated advertising networks and the ability to monetize mid-core audiences will define the competitive landscape of the mobile gaming ecosystem.
- The global mobile gaming market is projected to reach $117 billion in annual revenue by 2026, despite a 6% year-over-year revenue decline to $21.2 billion in early 2022.
- Mid-core genres, specifically RPG and strategy, drive 60% of total player spending, while casual titles account for 78% of total downloads.
- Asian markets contribute 80% of total RPG and MMORPG revenue, though Western appetite for these complex titles is growing, evidenced by Diablo Immortal earning $28 million in the U.S. during its first six weeks.
- China has overtaken the United States in player spending for real-time strategy titles, highlighting the importance of local market expertise and intellectual property integration.
- Card battlers have emerged as a top-five growth category, supported by cross-media synergies and established franchises.
+1
Sensor TowerAug 2022

Report34 pages
Japan Mobile App Trends 2022: Essential App Performance Benchmarks and Insights
The Japanese mobile app market underwent a period of significant expansion between 2020 and mid-2022, characterized by a 19% increase in total installs and a 12% rise in user sessions. Gaming remains the primary driver of this growth, with installs surging 52% year-over-year. Within this vertical, Hyper Casual and RPG titles command the largest market shares, accounting for 15% and 13% of installs respectively. While gaming leads in volume, the Fintech and E-commerce sectors have reached record engagement levels, with E-commerce sessions growing 29% over 2020 benchmarks and Fintech sessions rising 13% annually.
User acquisition dynamics in Japan reveal a complex landscape of costs and returns across different platforms and genres. Dating apps face particularly high acquisition hurdles, with costs per install peaking at $6.60, while puzzle games average a $5.48 cost per install. Data indicates that Android users frequently outperform iOS users in terms of conversion efficiency and return on ad spend, particularly within the gaming and dating verticals. These performance metrics suggest that while the market is maturing, strategic platform selection remains critical for optimizing marketing budgets.
Looking toward future growth, the Japanese digital landscape is shifting toward multi-channel engagement, with Connected TV emerging as a vital marketing frontier. Projections suggest that ad spend in the Japanese Connected TV sector will reach ¥58.8 billion by 2024. This evolution, supported by data from the top 2,000 performing apps, underscores a resilient mobile economy where traditional gaming dominance is being supplemented by rapid digital transformation in financial services and retail. The transition from 2020 through the first half of 2022 highlights a market that is both expanding in scale and diversifying in its technological reach.
- The Japanese mobile market saw a 19% increase in total installs and a 12% rise in user sessions between 2020 and mid-2022, driven primarily by a 52% year-over-year surge in gaming installs.
- Hyper Casual and RPG titles dominate the gaming sector, accounting for 15% and 13% of total installs respectively.
- E-commerce and Fintech are experiencing significant engagement growth, with sessions rising 29% and 13% respectively compared to 2020 benchmarks.
- User acquisition costs are high, with Dating apps peaking at $6.60 per install and Puzzle games averaging $5.48 per install.
- Android users demonstrate superior conversion efficiency and return on ad spend compared to iOS users, particularly within the gaming and dating verticals.
+1
AdjustAug 2022
Report19 pages
Blockchain Industry Report: August 2022
This analysis examines the state of the decentralized application (dapp) and blockchain industry during August 2022. The report highlights a period of significant volatility characterized by a 14.73% year-over-year decline in daily Unique Active Wallets (UAW), which reached a yearly low of 1.67 million. Despite the prevailing bear market and a series of high-profile security breaches—including the $190 million Nomad bridge exploit and the Solana wallet hack—the industry showed pockets of resilience, particularly within Ethereum scaling solutions and the gaming sector.
The Decentralized Finance (DeFi) sector experienced a 10.47% contraction in Total Value Locked (TVL), falling to $74.21 billion. This decline was exacerbated by U.S. sanctions against Tornado Cash, which sparked industry-wide debates regarding the true nature of Web3 decentralization. Conversely, Ethereum Layer-2 protocols like Optimism and Arbitrum saw growth in anticipation of "The Merge," with Optimism entering the top ten blockchains by TVL. While the gaming sector’s dominance of industry usage dipped slightly to 51%, it remained the primary driver of blockchain activity with over 847,000 daily UAW.
The NFT market faced downward pressure, with UAW dropping 16.7% to its lowest level since mid-2021. Trading volumes decreased by 5% month-over-month, influenced by the falling price of Ethereum and liquidation fears surrounding major collections like Bored Ape Yacht Club. However, the report notes structural evolution in the marketplace, specifically the rise of the Automated Market Maker (AMM) model via SudoSWAP and continued interest from traditional brands like Mars and Tiffany & Co. The findings suggest that while macroeconomic uncertainty and security vulnerabilities persist, the underlying infrastructure continues to mature through technical milestones and diversifying use cases.
- Daily Unique Active Wallets (UAW) across the blockchain industry fell 14.73% year-over-year to a yearly low of 1.67 million in August 2022.
- The gaming sector remains the primary driver of blockchain activity, accounting for 51% of industry usage with over 847,000 daily UAW.
- Total Value Locked (TVL) in Decentralized Finance (DeFi) contracted by 10.47% to $74.21 billion, impacted by market volatility and U.S. sanctions against Tornado Cash.
- NFT market activity declined significantly, with UAW dropping 16.7% to its lowest level since mid-2021 and trading volumes falling 5% month-over-month.
- Ethereum Layer-2 protocols, specifically Optimism and Arbitrum, experienced growth in anticipation of 'The Merge,' with Optimism securing a position in the top ten blockchains by TVL.
+1
DappRadarAug 2022
Report21 pages
Global Gaming Report H1 2022
The first half of 2022 marked the most active period in the history of the gaming industry, characterized by unprecedented consolidation and record-breaking investment levels. Total deal value exceeded $107 billion across 651 transactions, with mergers and acquisitions accounting for $95 billion of that total. This surge was primarily driven by massive strategic consolidations, most notably Microsoft’s acquisition of Activision Blizzard and Take-Two’s purchase of Zynga. While the public markets faced significant headwinds and valuation corrections, the private sector remained resilient, securing $7 billion in financing across nearly 500 deals.
Blockchain gaming and metaverse infrastructure emerged as the dominant catalysts for growth, representing over half of all financing transactions in the second quarter. This sector attracted more than $2.2 billion in funding, supported by the launch of multi-billion dollar funds from major venture capital firms. Despite the robust private activity, public gaming stocks largely underperformed, leading to a shift in investor focus toward high-quality, profitable targets. The absence of activity in the IPO and SPAC markets further underscored a transition toward private equity and strategic M&A as the primary vehicles for industry movement.
The industry landscape is currently defined by a divergence between aggressive private investment and cautious public market sentiment. As valuation multiples adjust to new economic realities, the sector is positioned for a second half of the year focused on opportunistic acquisitions and potential take-private transactions. The continued integration of Web3 technologies and the entry of massive capital reserves suggest that while the pace of "mega deals" may fluctuate, the fundamental restructuring of the gaming ecosystem toward a consolidated, blockchain-integrated future remains the central trajectory for the global market.
- The gaming industry saw record-breaking activity in H1 2022 with $107 billion in total deal value across 651 transactions, dominated by $95 billion in M&A activity.
- Strategic consolidation was driven by major acquisitions, most notably Microsoft’s purchase of Activision Blizzard and Take-Two’s acquisition of Zynga.
- Blockchain gaming and metaverse infrastructure became the primary growth catalysts, accounting for over 50% of all financing transactions in Q2 and attracting $2.2 billion in funding.
- While public markets faced valuation corrections and underperformed, the private sector remained resilient, securing $7 billion in financing across nearly 500 deals.
- The absence of IPO and SPAC activity signals a shift in industry movement toward private equity and strategic M&A as the primary vehicles for growth.
+3
Drake Star PartnersJul 2022
Report25 pages
The Rise of Midcore Mobile Games Snapshot Report July 2022
The midcore mobile gaming sector is experiencing a significant shift as AAA developers and high-fidelity titles increasingly challenge the historical dominance of casual and hyper-casual games. Analysis of the US iOS market between Q1 2021 and Q1 2022 reveals that midcore was the only category to achieve revenue growth, currently accounting for 36.73% of total mobile game revenue. This trend is further evidenced by the fact that nine midcore titles released in the past year remain in the top 200 grossing chart, compared to only three casual titles.
The success of these games, such as Diablo Immortal, Genshin Impact, and Apex Legends Mobile, is attributed to three essential design pillars: sophisticated control systems, diversified monetization, and high content cadence. Top-performing midcore games differentiate themselves by offering precise, console-like manual controls and minimizing reliance on autoplay. Furthermore, they utilize complex monetization strategies; 75% of top-grossing midcore games employ Battle Pass systems, and over 63% feature five or more distinct gacha mechanics.
Live operations and player engagement are equally critical, with 100% of top-tier midcore games utilizing recurring live events. A notable 80% of these titles implement special event-specific currencies to manage game economies and drive temporary sinks. Additionally, a burgeoning trend involves publishers establishing external web stores to bypass standard app store commission fees. Data for this analysis was sourced from the GameRefinery SaaS platform, focusing on feature adoption and revenue performance within the US iOS market to identify the specific mechanics that separate market leaders from the broader competitive field.
- Midcore mobile games were the only category to achieve revenue growth in the US iOS market between Q1 2021 and Q1 2022, now capturing 36.73% of total mobile gaming revenue.
- New midcore titles are outperforming casual games in long-term retention, with nine midcore releases from the past year remaining in the top 200 grossing chart compared to only three casual titles.
- Top-performing midcore titles like Diablo Immortal, Genshin Impact, and Apex Legends Mobile prioritize console-like manual controls over autoplay mechanics to drive engagement.
- Monetization in the sector is highly complex, with 75% of top-grossing midcore games utilizing Battle Pass systems and over 63% incorporating five or more distinct gacha mechanics.
- Live operations are universal among top-tier midcore games, with 100% employing recurring live events and 80% using event-specific currencies to manage game economies.
+1
GameRefineryJul 2022
Report16 pages
DappRadar Blockchain Industry Report: Highlights of July 2022
The July 2022 DappRadar Blockchain Industry Report analyzes the state of the decentralized application ecosystem during a significant market downturn. The findings indicate that while the broader crypto industry remains trapped in a bear market influenced by the collapse of Terra and macroeconomic pressures like U.S. inflation, specific sectors—most notably blockchain gaming—demonstrate remarkable resilience. The report covers global trends across decentralized finance (DeFi), non-fungible tokens (NFTs), and gaming, utilizing data on Unique Active Wallets (UAW) and Total Value Locked (TVL) to measure health and engagement.
Data shows that dapp activity reached a yearly low in July with 1.68 million daily UAW, a 4% decrease from June. DeFi was the hardest-hit segment, with UAW dropping below 500,000 for the first time since early 2021. Despite this, DeFi TVL saw a 22% recovery during the month, rising to $82.3 billion, led by growth on Ethereum, BNB Chain, and Tron. The report also highlights the continued "crypto contagion" following the Celsius Network bankruptcy filing, which has increased calls for international regulatory frameworks like the EU’s MiCA.
The NFT market experienced a contraction, with monthly trading volume failing to reach $1 billion for the first time in over a year. Market dynamics are shifting as OpenSea’s dominance fell from 84% in May to 58.6% in July, facing increased competition from new entrants like the GameStop and Nickelodeon marketplaces. Conversely, the gaming sector emerged as a primary industry driver, accounting for nearly 60% of all dapp usage. With nearly 1 million daily UAW, blockchain games grew 8% month-over-month, suggesting that immersive mechanics and venture capital interest are insulating the segment from the prevailing "crypto winter."
- Blockchain gaming remains the industry's primary driver, accounting for nearly 60% of all dapp usage with 1 million daily Unique Active Wallets (UAW), an 8% month-over-month increase.
- DeFi activity hit a yearly low with UAW dropping below 500,000, though Total Value Locked (TVL) recovered 22% to reach $82.3 billion across Ethereum, BNB Chain, and Tron.
- The NFT market contracted significantly in July 2022, with monthly trading volume falling below $1 billion for the first time in over a year.
- OpenSea’s market dominance in the NFT space declined sharply from 84% in May to 58.6% in July due to competition from new entrants like GameStop and Nickelodeon.
- Overall dapp activity reached a yearly low of 1.68 million daily UAW in July, representing a 4% decrease from the previous month.
+2
DappRadarJul 2022
Report25 pages
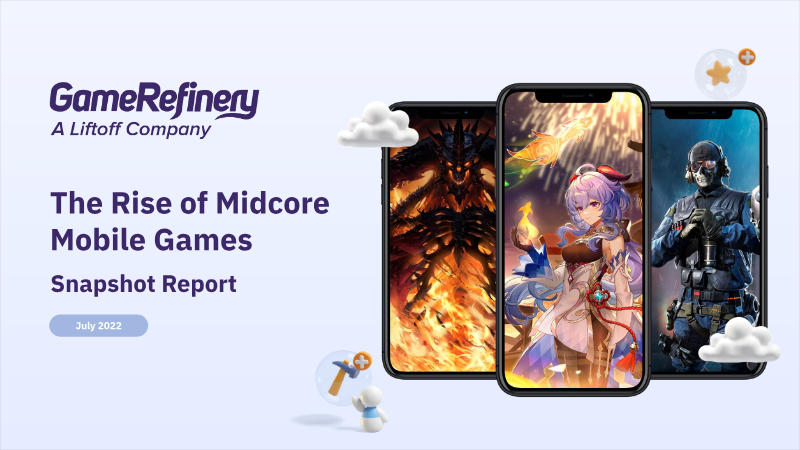
The Rise of Midcore Mobile Games Snapshot Report
The midcore mobile gaming sector is experiencing a significant shift as AAA developers successfully port major PC and console franchises to mobile devices. Between Q1 2021 and Q1 2022, midcore games represented the only category to see market share growth, accounting for nearly 37% of US iOS mobile game revenue. This trend is further evidenced by the fact that nine midcore titles released in the past year remain in the top-200 grossing charts in the US, compared to only three casual titles.
The success of these high-performing midcore games is attributed to three essential design pillars: sophisticated control systems, diversified monetization, and high content cadence. Leading titles like Diablo Immortal and Genshin Impact have moved away from traditional mobile autoplay mechanics, instead favoring precision-based manual controls and immersive storytelling that mirror premium console experiences. These games effectively cater to player motivations centered on mastery and the adrenaline rush of reaction-based skills.
Monetization strategies in the midcore space have become increasingly complex. Top-performing games are significantly more likely to utilize Battle Passes, with 75% of the top 20% grossing midcore games employing the feature compared to just 25% of lower-ranking titles. Furthermore, gacha systems remain a dominant revenue driver; over 65% of top midcore games feature more than five different gachas. To maximize margins, a emerging trend shows publishers establishing external web stores to bypass standard app store commission fees.
Finally, maintaining a massive content cadence is critical for retention. Approximately 80% of top midcore games utilize special live event currencies to create temporary economic sinks and drive daily engagement. By combining frequent limited-time events with a steady stream of cosmetic updates and new gameplay modes, successful developers ensure long-term player interest in an increasingly competitive AAA mobile landscape.
- Midcore games were the only mobile category to see market share growth between Q1 2021 and Q1 2022, capturing nearly 37% of US iOS mobile game revenue.
- Successful midcore titles are increasingly adopting high-cadence content strategies, with 80% of top-performing games using special live event currencies to drive daily engagement.
- Battle Passes are a primary monetization driver for top-tier midcore games, utilized by 75% of the top 20% grossing titles compared to only 25% of lower-ranking games.
- Leading titles like Genshin Impact and Diablo Immortal are shifting away from mobile autoplay mechanics in favor of precision-based manual controls and immersive storytelling to mirror console experiences.
- Gacha systems remain a dominant revenue source, with over 65% of top midcore games featuring more than five distinct gacha mechanics.
+1
GameRefineryJul 2022