Skip to main content
Game Industry
Library
Library
Search
Ask AI
News
Connect your AI
Browse
The Catch Up
Topics
Collections
Writers
Help
Subscribe
Game Industry
Library
Library
Search
Ask AI
Saved
Library
223 reports matching your filters
All Types
Reports
Articles
Presentations
Whitepapers
Financial
Legal
Other
Search
Japan
Market Analysis
Investment
Mobile
Global
Game Publishing
Advertising
Monetization
Game Development
Console
Asia
Marketing
RPG
Player Behavior
Market Forecast
Mergers & Acquisitions
USA
South Korea
Clear
Filters
1
Japan
Recently added
Newest first
Oldest first
Title A–Z
Title Z–A
Report
1 pages
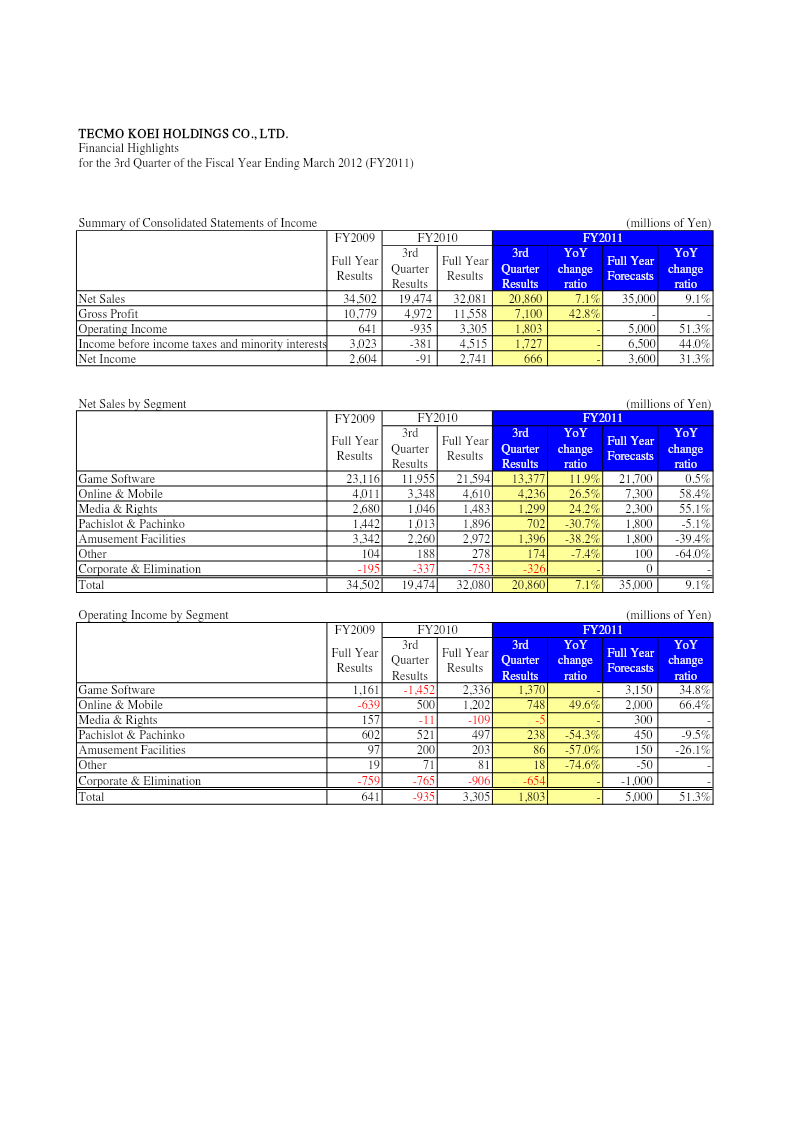
Financial Highlights: 3rd Quarter of the Fiscal Year Ending March 2012
Consolidated net sales for Q3 of the fiscal year ending March 2012 rose 7.1% to ¥32,080 million, while operating income surged 51.3% to ¥3,305 million.
The Game Software segment remains the primary driver of profitability, growing 11.9% to ¥21,594 million in sales and contributing ¥2,336 million in operating income.
The Online & Mobile segment achieved a turnaround, growing 26.5% to ¥4,610 million in sales and generating ¥1,202 million in operating income after posting a loss in the prior year.
Market Analysis
Investment
Japan
+1
Koei Tecmo
Report
1 pages
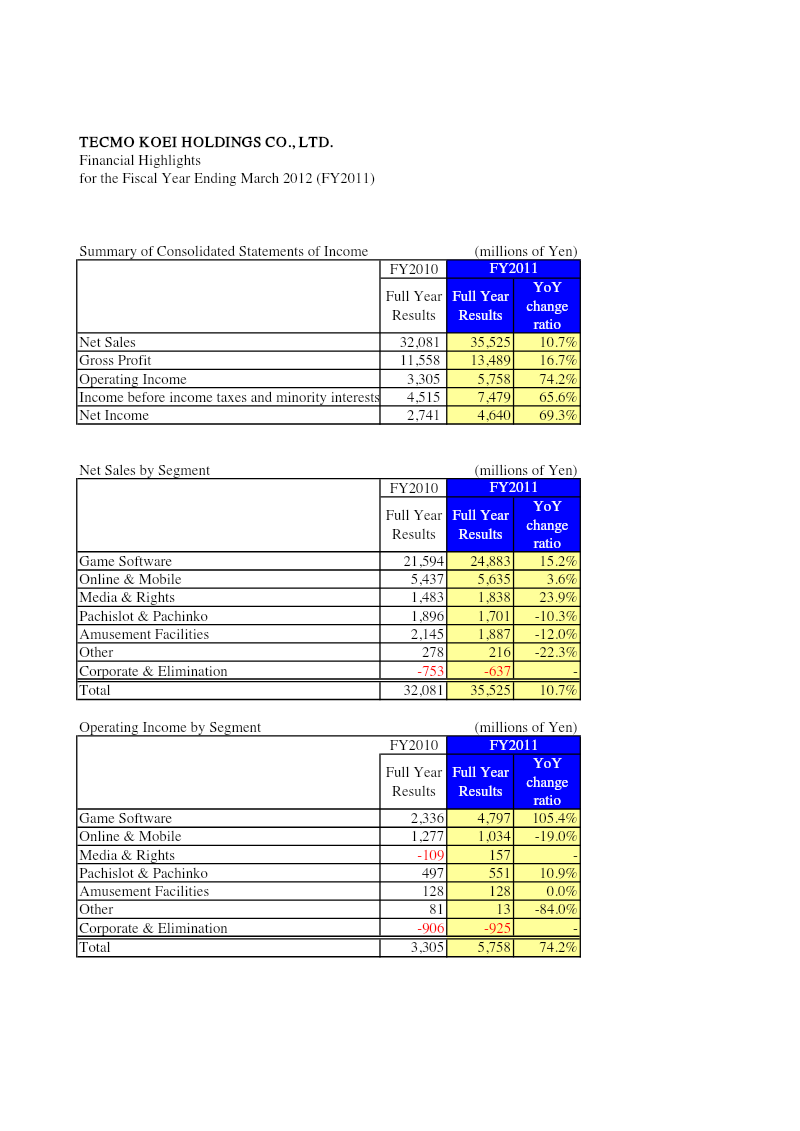
Financial Highlights: FY2011
Tecmo Koei Holdings achieved a 74.2% surge in operating income to ¥5,758 million and a 69.3% increase in net income to ¥4,640 million for the fiscal year ending March 2012.
Net sales grew 10.7% to ¥35,525 million, driven primarily by a 15.2% increase in Game Software sales to ¥24,883 million.
Game Software operating profit more than doubled, jumping 105.4% to ¥4,797 million, which served as the primary catalyst for the company's overall profit growth.
Market Analysis
Investment
Japan
Koei Tecmo
Report
27 pages
Management Policy & Strategy: Fiscal Year Ended March 2013
Tecmo Koei achieved record-high profitability in FY2012, with operating profit reaching ¥6.21 billion (17.9% of sales) and net income margin increasing to 16.3%.
Total sales grew 2.5% year-over-year to ¥34.6 billion, driven primarily by strong performance in game software titles like 'One Piece: Dynasty Warriors 8' and 'Fist of the North Star.'
The company maintains a heavy reliance on the domestic market, with Japan accounting for approximately 84% of total sales, while overseas segments (North America, Europe, and Asia) grew by only 1.6%.
Market Analysis
Investment
Japan
Koei Tecmo
Report
1 pages
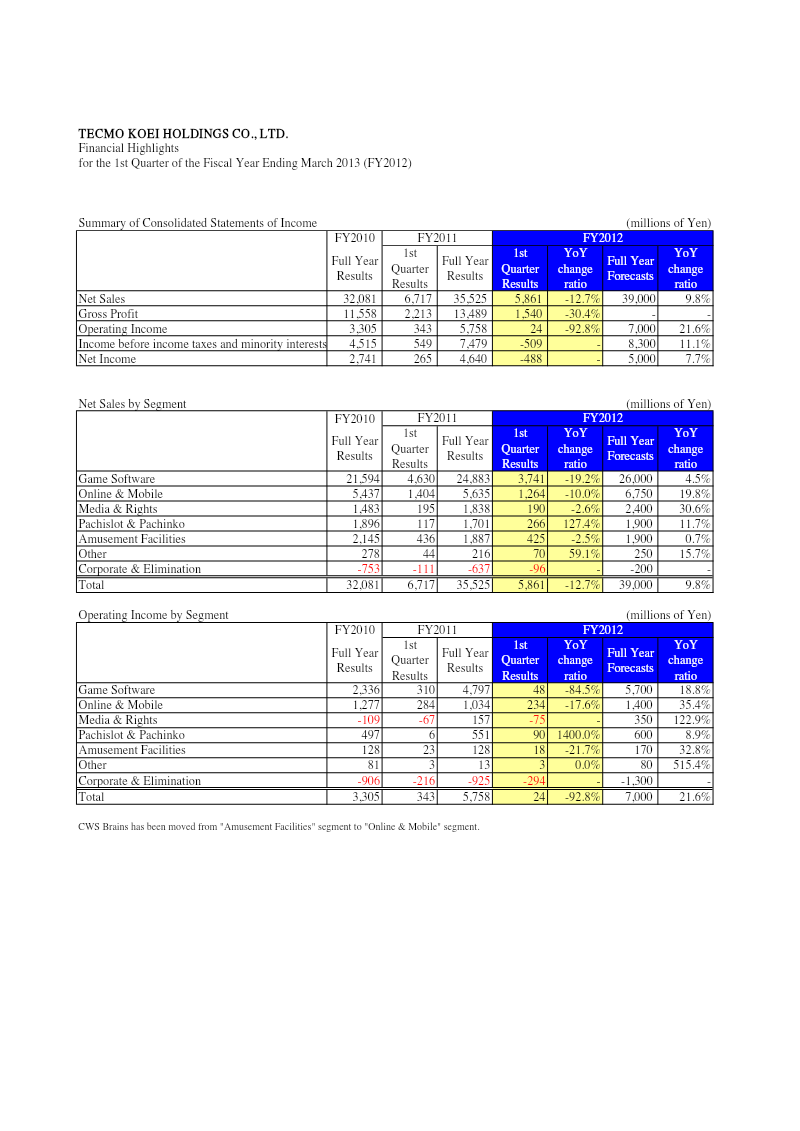
Financial Highlights: 1st Quarter of Fiscal Year Ending March 2013
Tecmo Koei Holdings experienced a significant financial downturn in Q1 FY2013, with net sales falling 12.7% year-over-year to ¥35,525 million and operating income plummeting 92.8% to ¥5,758 million.
The core Game Software segment, the company's primary revenue driver, saw a 19.2% decline in sales and an 84.5% collapse in operating income.
Online & Mobile operations underperformed, recording a 10.0% drop in sales and a 17.6% decrease in operating income.
Investment
Market Analysis
Game Publishing
+1
Koei Tecmo
Report
2 pages
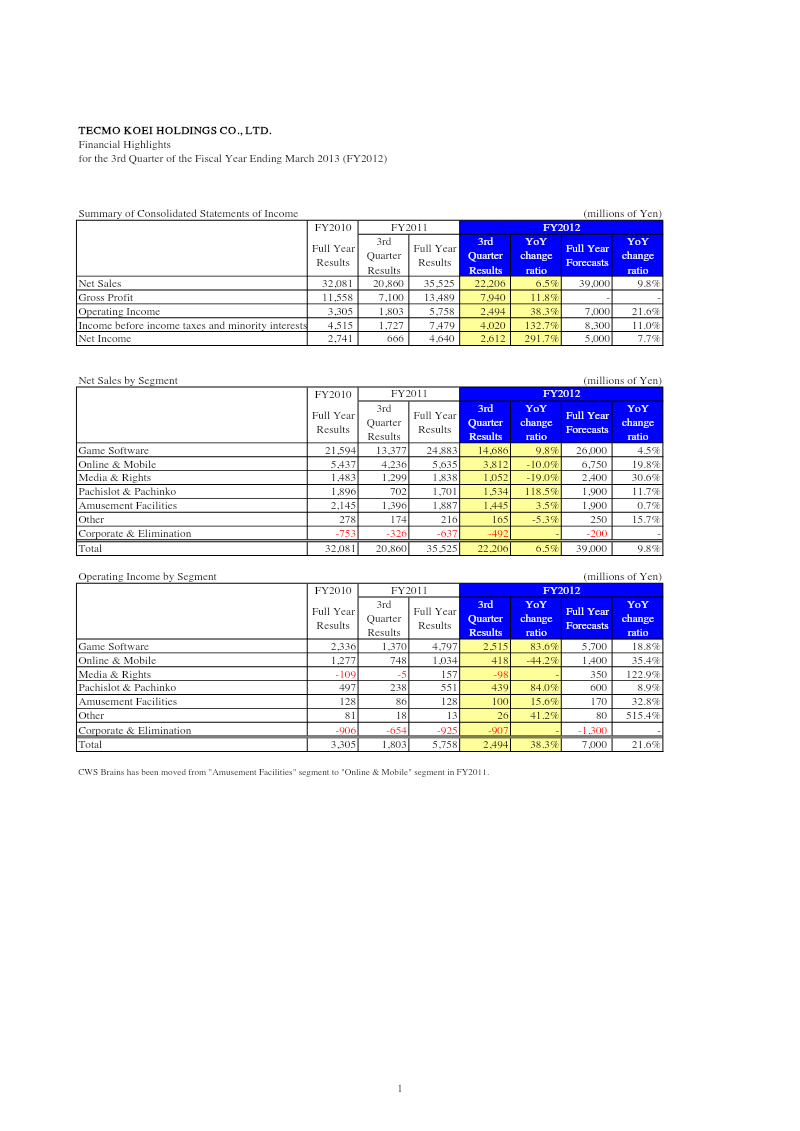
Financial Highlights: 3rd Quarter of the Fiscal Year Ending March 2013
Tecmo Koei Holdings achieved a net income of ¥4,640 million for Q3 FY2012, representing a 291.7% increase over the prior year's ¥666 million.
The Game Software segment was the primary driver of growth, with operating income surging 83.6% year-on-year to ¥4,797 million.
Total net sales rose 6.5% to ¥35,525 million, while overall operating income climbed 38.3% to ¥5,758 million.
Market Analysis
Investment
Japan
+1
Koei Tecmo
Report
1 pages
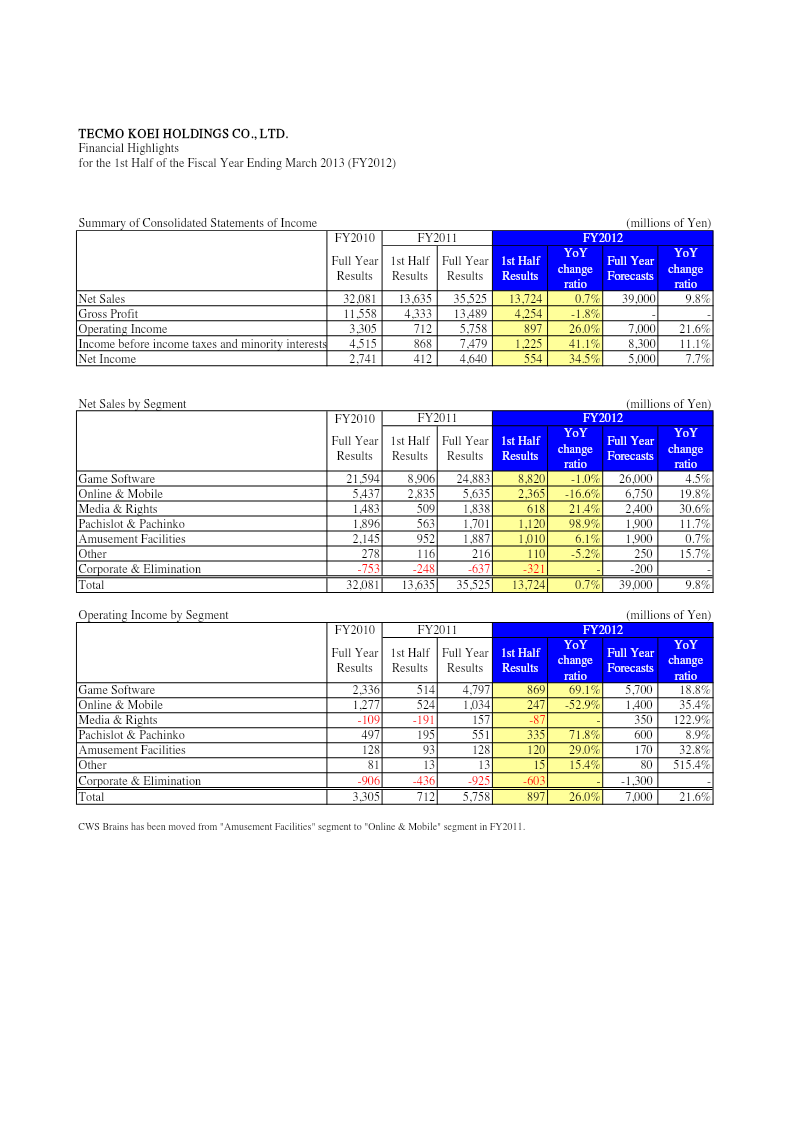
Financial Highlights: 1st Half of FY2013
Tecmo Koei Holdings reported a 34.5% increase in net income to ¥554 million for the first half of FY2012, significantly outperforming the 7.7% growth forecast.
Operating income surged 26.0% to ¥897 million, driven primarily by strong rebounds in the Game Software and Pachislot & Pachinko business segments.
Despite a 1.0% decline in Game Software sales to ¥8,820 million, segment operating income jumped 69.1% to ¥869 million due to improved gross margins.
Market Analysis
Investment
Japan
+1
Koei Tecmo
Report
2 pages
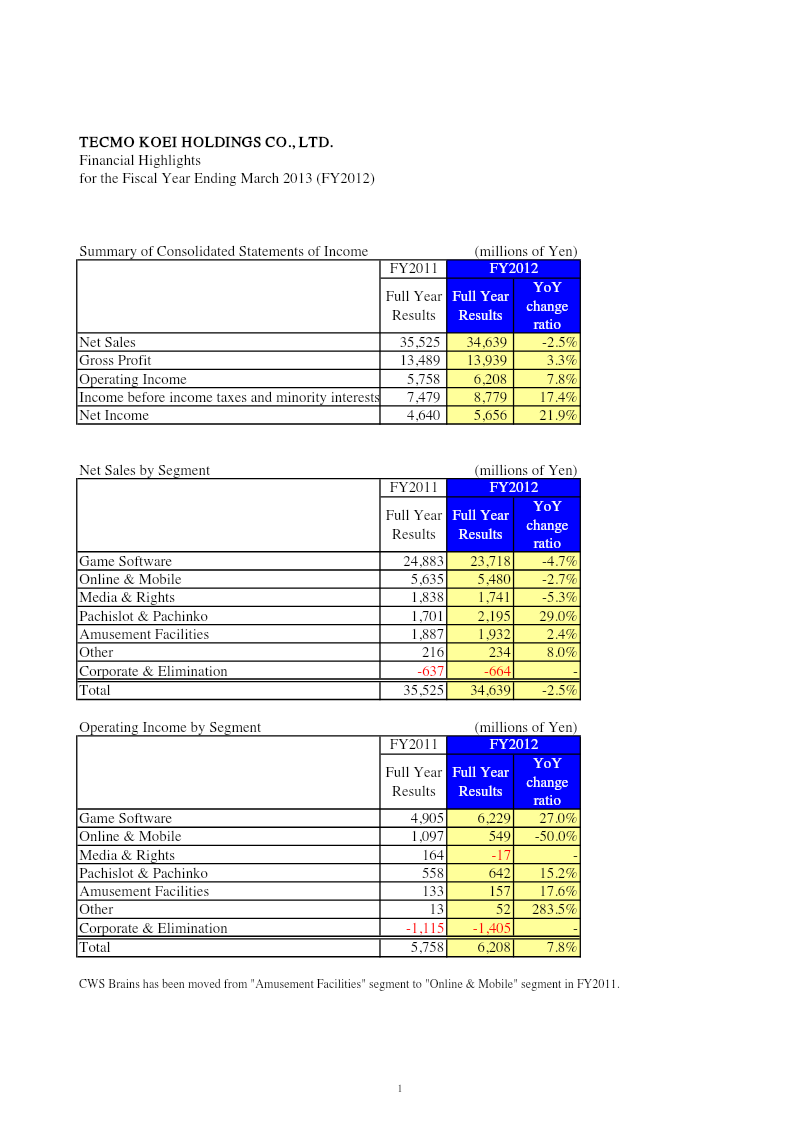
Financial Highlights: FY2012
Net income grew by 21.9% to ¥5,656 million in FY2012, despite a 2.5% decline in total net sales to ¥34,639 million.
Operating income rose 7.8% to ¥6,208 million, bolstered by a 27% increase in Game Software operating income and a 15.2% rise from Pachislot & Pachinko, which offset a 50% collapse in Online & Mobile operating income.
Revenue performance was mixed across segments, with Pachislot & Pachinko sales jumping 29% to ¥2,195 million, while Game Software sales fell 4.7% and Online & Mobile revenue dropped 2.7%.
Market Analysis
Investment
Japan
Koei Tecmo
Report
2 pages
Financial Highlights: 1st Quarter of Fiscal Year Ending March 2014
Consolidated net sales rose 10.9% to ¥35,525 million in Q1 FY2014, driven by a 10.9% increase in game-software revenue and a 26.5% surge in pachislot & pachinko sales.
Operating income grew 79.8% to ¥6,208 million, bolstered by a 113.9% increase in game-software operating profit and a 444.3% rise in the 'Other' segment.
Net income increased 18.0% year-over-year to ¥5,656 million, though this figure fell slightly short of the ¥5,700 million forecast for the period.
Market Analysis
Investment
Japan
+1
Koei Tecmo
Report
2 pages
Financial Highlights: 1st Half of Fiscal Year Ending March 2014
Tecmo Koei Holdings reported a 329.6% increase in net income to ¥5,656 million for the first half of fiscal year 2013, ending March 31, 2014.
Operating income surged 83.8% to ¥6,208 million, bolstered by a 34.3% increase in game software operating income and a 62.1% rise in online and mobile operating income.
Net sales grew 12.6% year-over-year to ¥34,639 million, fueled by a 10.8% increase in game software sales and a 27.9% rise in online and mobile revenue.
Market Analysis
Investment
Japan
+1
Koei Tecmo
Report
2 pages
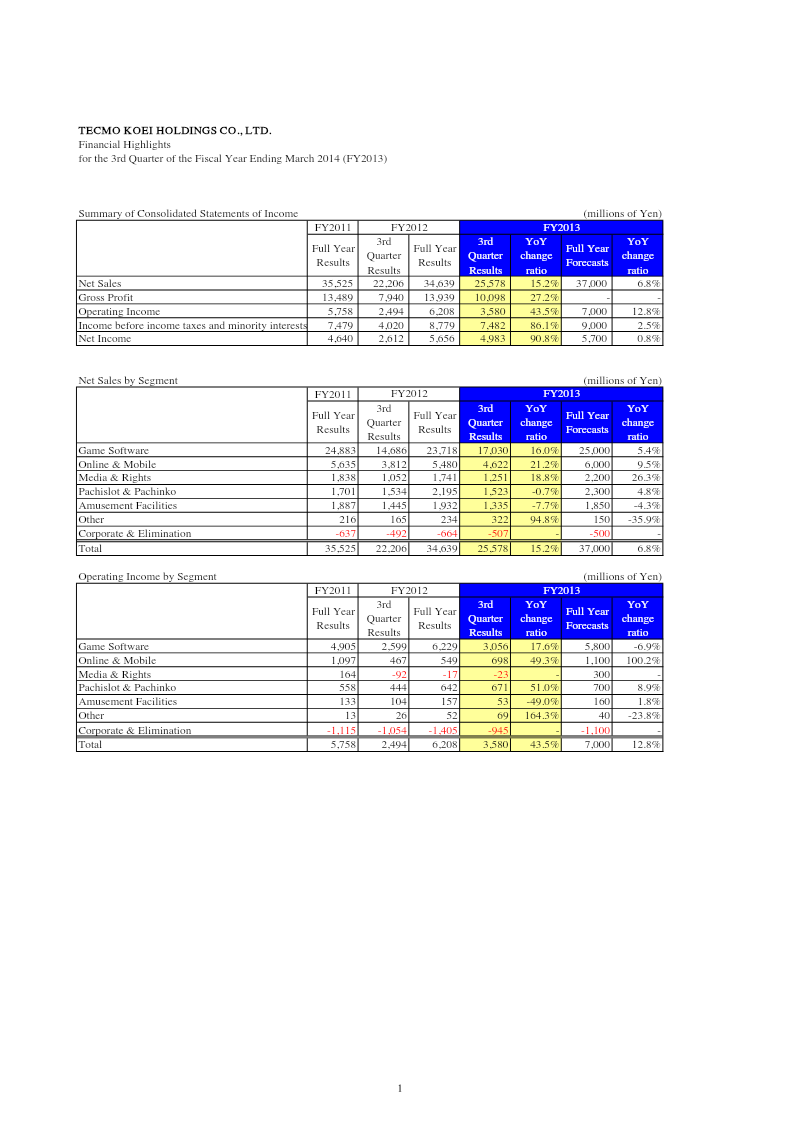
Financial Highlights for the 3rd Quarter of the Fiscal Year Ending March 2014: Japan
Net income for Q3 of the fiscal year ending March 2014 surged 90.8% to ¥5,656 million, significantly outperforming the company's initial growth forecasts.
Total net sales rose 15.2% to ¥34,639 million, while operating income increased 43.5% to ¥6,208 million, driven by strong execution across core business segments.
Game Software remains the primary revenue driver, contributing ¥23,718 million in sales and ¥6,229 million in operating income.
Market Analysis
Investment
Japan
+2
Koei Tecmo
Report
2 pages
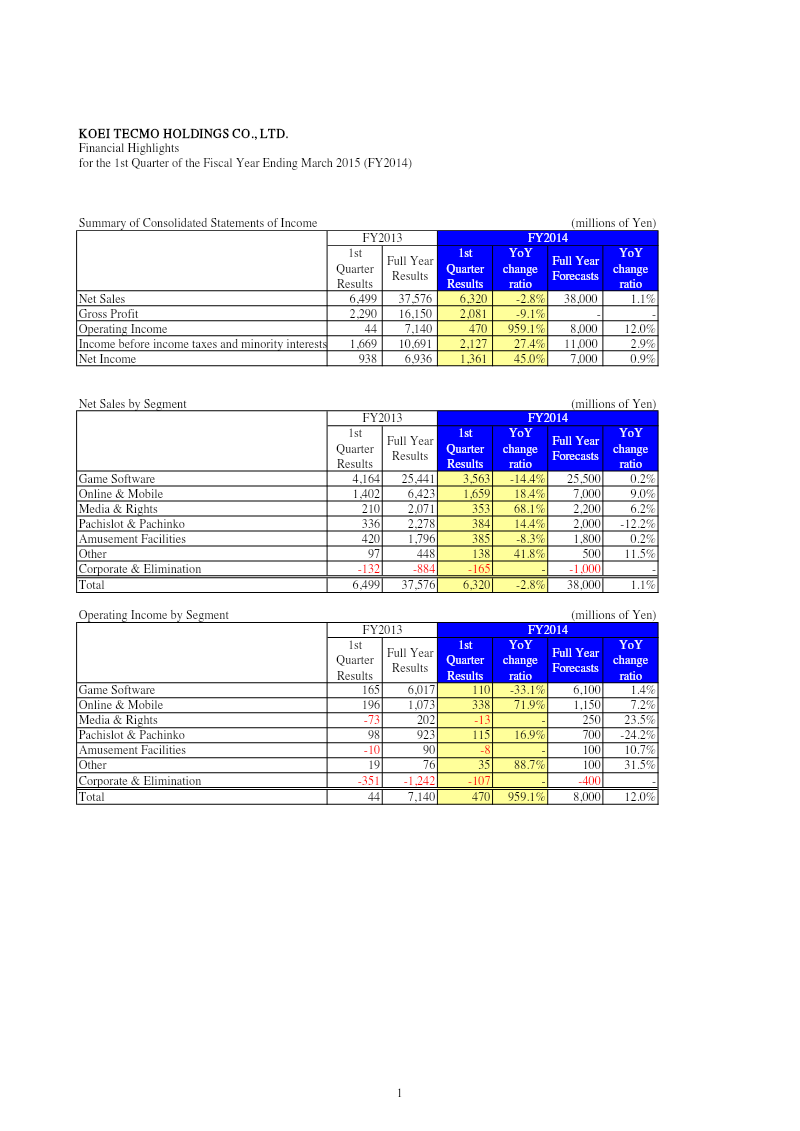
Financial Highlights: Q1 FY2014
KOEI TECMO HOLDINGS reported a massive 959.1% surge in operating income to ¥7,140 million for Q1 FY2014, driven by increased profitability in its core gaming segment.
Net income rose 45.0% to ¥6,936 million, nearly meeting the company's ¥7,000 million forecast despite a 2.8% decline in net sales to ¥37,576 million.
The Online & Mobile segment outperformed expectations with an 18.4% sales increase to ¥6,423 million and a 71.9% rise in operating income to ¥1,073 million.
Market Analysis
Investment
Japan
+1
Koei Tecmo
Report
2 pages
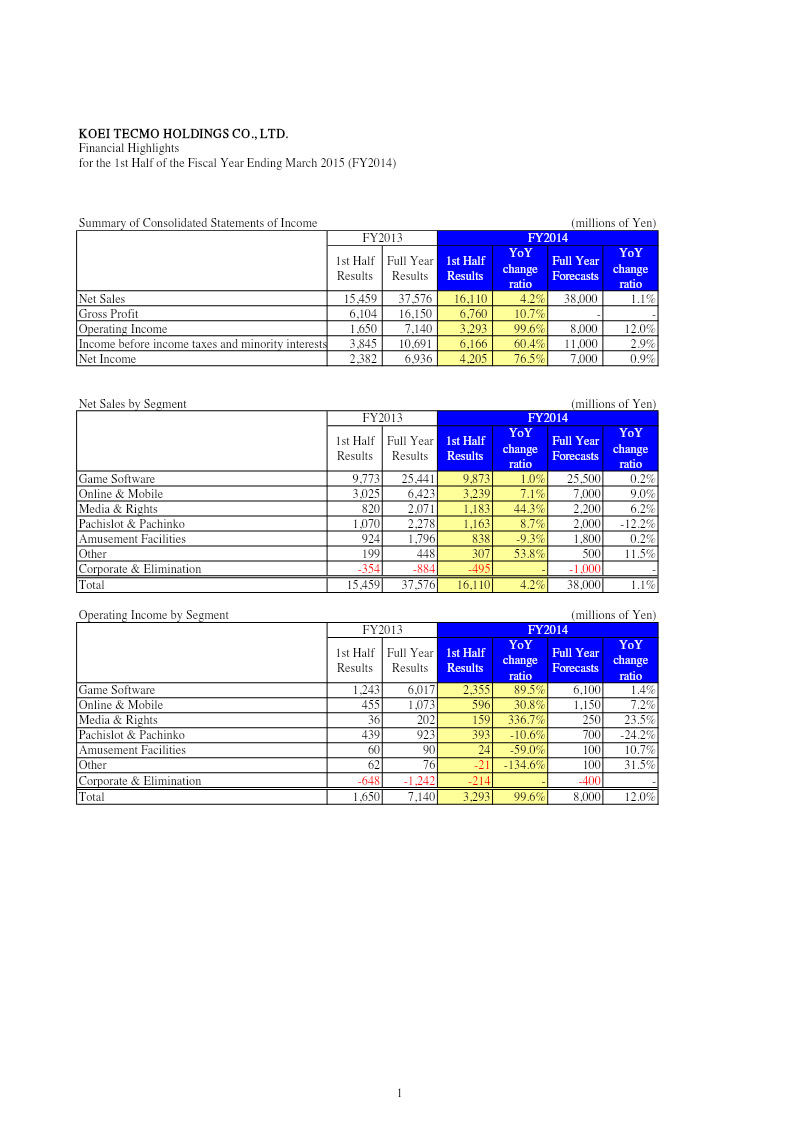
Financial Highlights: 1st Half of the Fiscal Year Ending March 2015
KOEI TECMO HOLDINGS achieved a 99.6% increase in operating income to ¥7,140 million and a 76.5% rise in net income to ¥6,936 million for the first half of the fiscal year ending March 2015.
Net sales grew 4.2% year-on-year to ¥37,576 million, fueled by a 1.0% increase in game software sales and a 7.1% rise in online and mobile revenue.
Profitability in the game software segment surged with an 89.5% increase in operating profit, while the online and mobile segment saw a 30.8% profit gain.
Market Analysis
Investment
Japan
Koei Tecmo
Report
2 pages
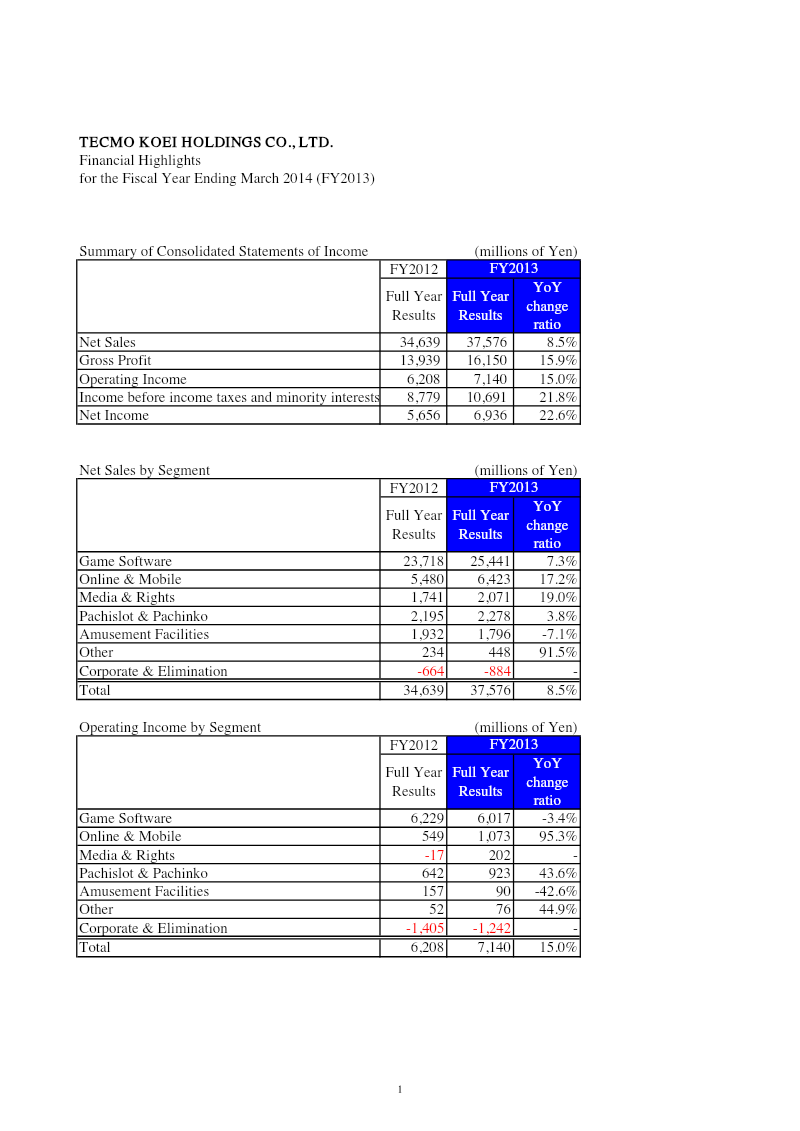
Financial Highlights: FY2013
Tecmo Koei Holdings achieved a 22.6% increase in net income to ¥6,936 million for FY2013, supported by a 15.0% rise in operating income to ¥7,140 million.
The Online & Mobile segment was a primary growth driver, recording a 17.2% revenue increase and a 95.3% surge in operating profit.
Consolidated net sales grew 8.5% to ¥37,576 million, bolstered by a 7.3% increase in Game Software sales and 19% growth in Media & Rights.
Market Analysis
Investment
Japan
Koei Tecmo
Report
2 pages
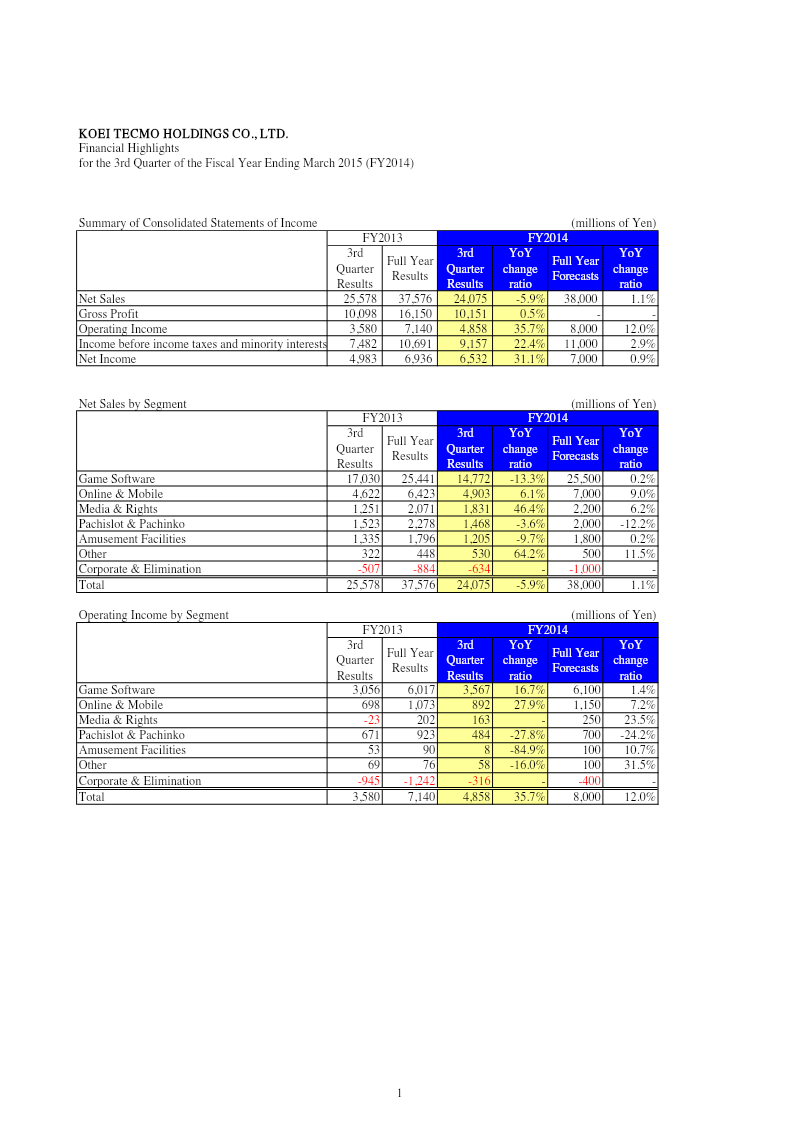
Financial Highlights: 3rd Quarter of the Fiscal Year Ending March 2015
KOEI TECMO HOLDINGS achieved a 35.7% surge in operating income to ¥7,140 million, significantly outperforming the company's forecast by 12.0%.
Net income for the third quarter ending March 31, 2015, rose 31.1% year-over-year to ¥6,936 million, despite a 5.9% decline in net sales to ¥37,576 million compared to the prior year.
The Media & Rights segment experienced a sharp 46.4% revenue expansion to ¥2,071 million, successfully shifting from a loss to a profit of ¥202 million.
Market Analysis
Investment
Japan
+1
Koei Tecmo
Report
2 pages
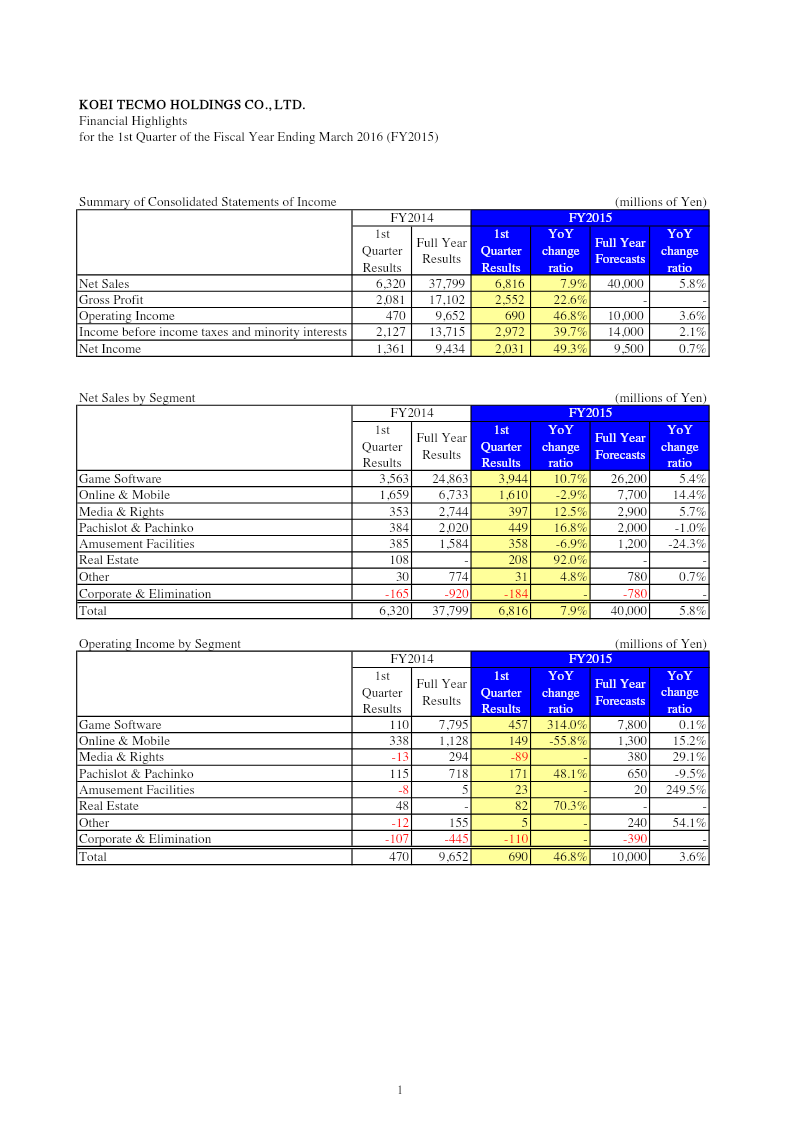
Financial Highlights: 1st Quarter of the Fiscal Year Ending March 2016
Koei Tecmo reported a strong Q1 fiscal 2016, with net income surging 49.3% to ¥9.4 billion and net sales rising 7.9% to ¥37.8 billion.
Operating income grew 46.8% to ¥9.7 billion, driven by a 314% increase in game software segment profitability and a 48% gain in pachislot & pachinko.
The online & mobile segment experienced a 2.9% decline in sales and a significant 55.8% drop in operating income, while media & rights saw an 89% decline in operating income despite a 12.5% revenue increase.
Market Analysis
Investment
Japan
+1
Koei Tecmo
Report
2 pages
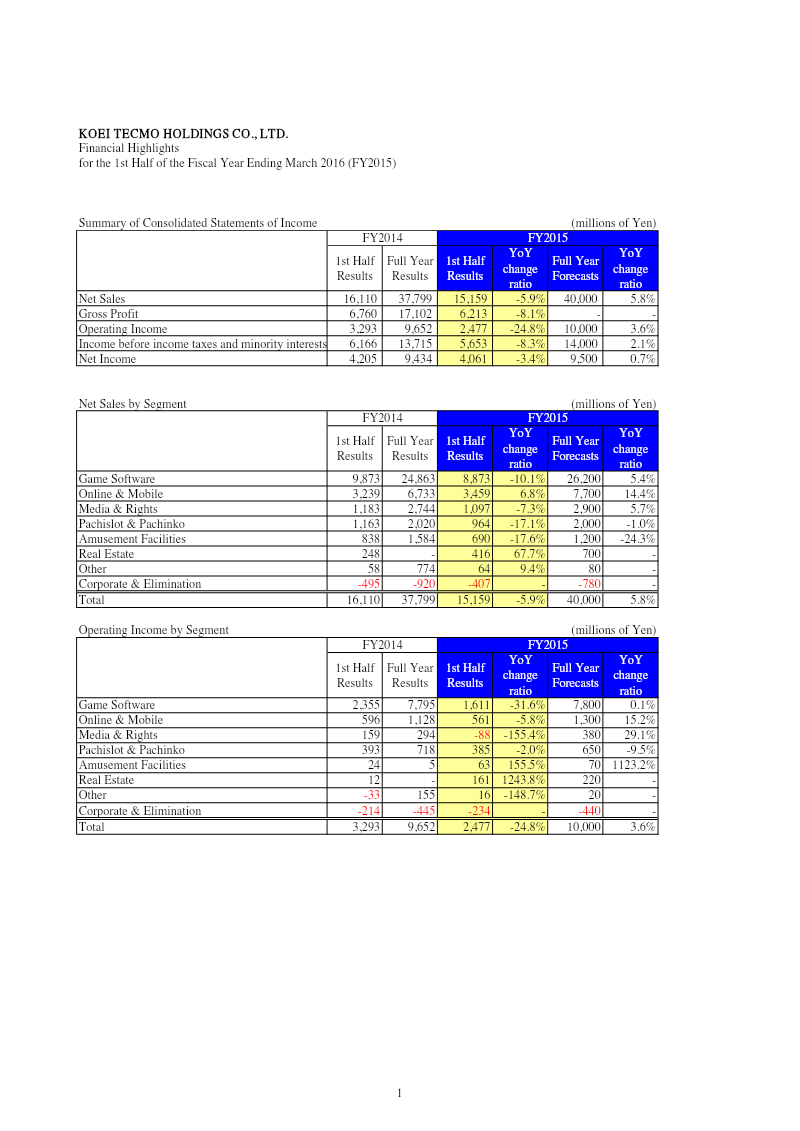
Financial Highlights: 1st Half of the Fiscal Year Ending March 2016
Koei Tecmo reported a 5.9% decline in net sales to ¥37.8 billion for the first half of the fiscal year ending March 2016, though the company projects a 5.8% increase in full-year sales to ¥40 billion.
Operating income fell by 24.8% to ¥9.7 billion, while net income saw a more modest decline of 3.4% to ¥9.4 billion.
The core Game Software segment experienced a 10.1% revenue decline to ¥24.9 billion, though it remained the primary driver of operating income at ¥7.8 billion.
Market Analysis
Investment
Japan
+1
Koei Tecmo
Report
2 pages
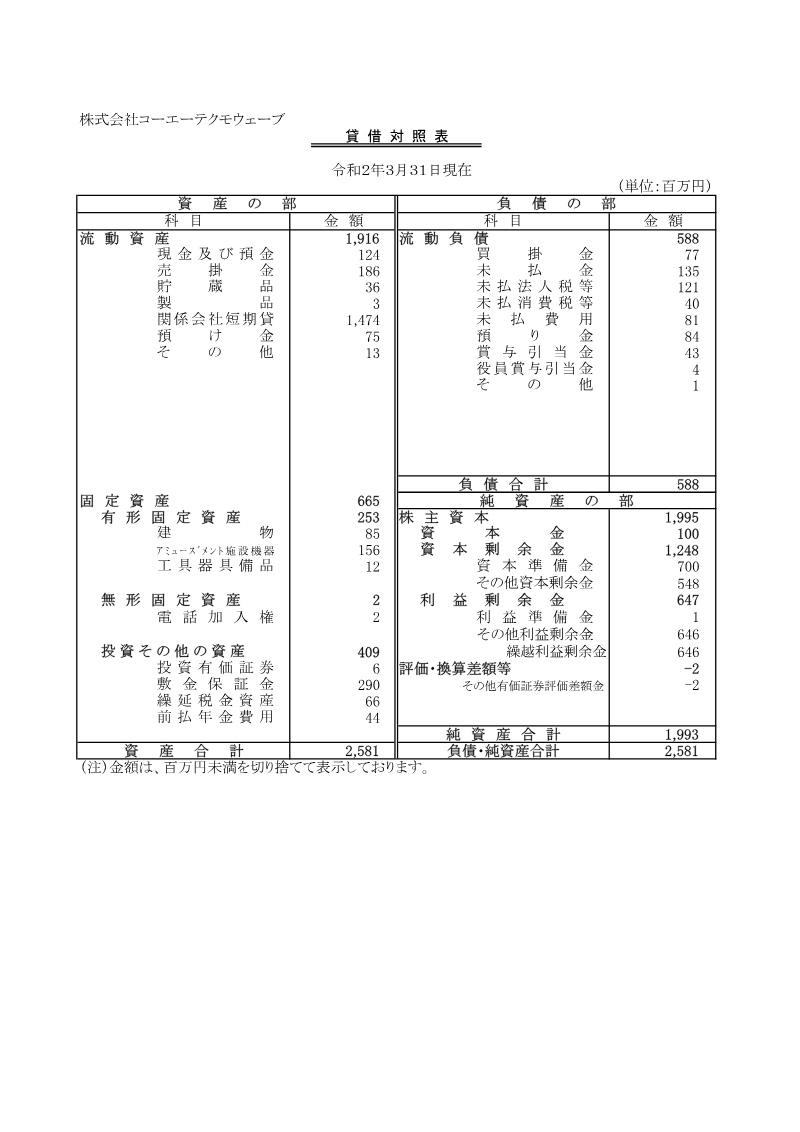
Balance Sheet: March 31, 2020
Koei Tecmo Wave reported total assets of ¥2,581 million and an equity base of ¥1,993 million as of March 31, 2020.
The company generated a net income of ¥303 million for the fiscal year ending March 31, 2020.
Current assets totaled ¥1,916 million, significantly outweighing current liabilities of ¥588 million.
Investment
Japan
Koei Tecmo
Report
2 pages
Financial Highlights: 3rd Quarter of the Fiscal Year Ending March 2016
Koei Tecmo reported net sales of ¥37.8 billion for Q3 FY2015, a 6.4% year-over-year increase that exceeded the company's ¥40 billion forecast by 5.8%.
Operating income rose 19% year-over-year to ¥9.65 billion, though this result fell 3.6% short of the ¥10 billion target.
Net income reached ¥9.43 billion, representing a 4.6% year-over-year increase but missing the ¥9.5 billion forecast.
Market Analysis
Investment
Japan
+1
Koei Tecmo
Report
2 pages
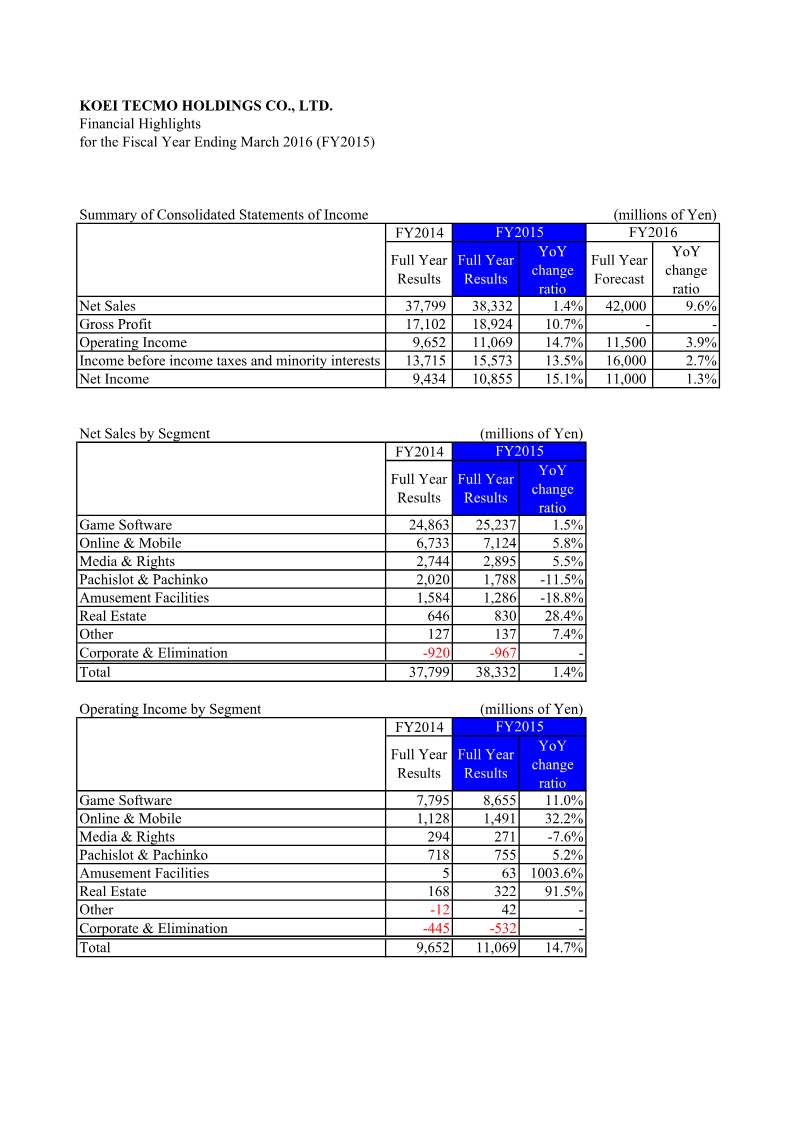
Financial Highlights: FY2015
KOEI TECMO HOLDINGS CO., LTD. achieved a net income of ¥10,855 million for FY2015, representing a 15.1% increase and a strong net profit margin of approximately 28.3%.
Operating income grew by 14.7% to ¥11,069 million, driven by improved profitability within the Online & Mobile and Real Estate business segments.
Total revenue reached ¥38,332 million, a modest 1.4% year-over-year increase supported by growth in Online & Mobile (5.8%) and Game Software (1.5%) sales.
Market Analysis
Market Forecast
Investment
+1
Koei Tecmo
Report
2 pages
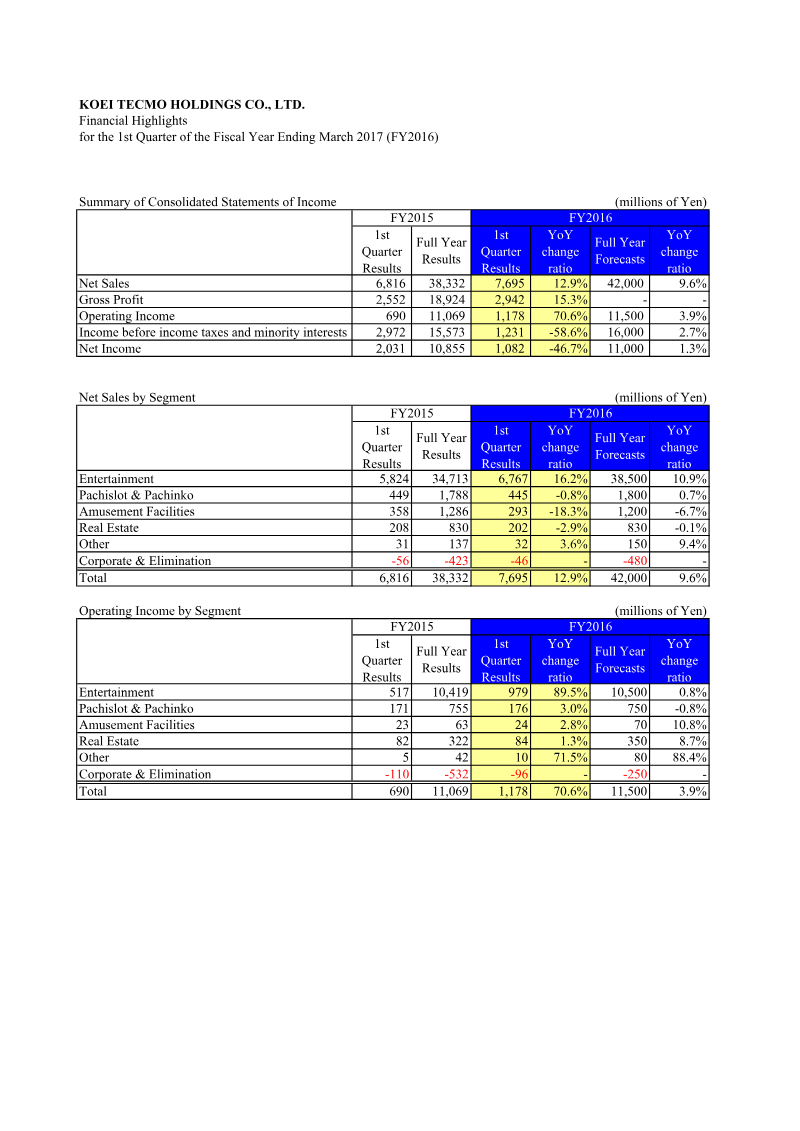
Financial Highlights: 1st Quarter of the Fiscal Year Ending March 2017
KOEI TECMO Holdings reported a 12.9% year-over-year increase in net sales to ¥38,332 million for the first quarter ending June 30, 2016.
Operating income surged 70.6% to ¥11,069 million, with the entertainment division serving as the primary driver by contributing 89.5% of this total gain.
Net income declined 46.7% to ¥10,855 million, primarily attributed to a 58.6% drop in income before taxes and minority interests.
Market Analysis
Game Publishing
Investment
+1
Koei Tecmo
Previous
1
…
3
4
5
…
12
Next