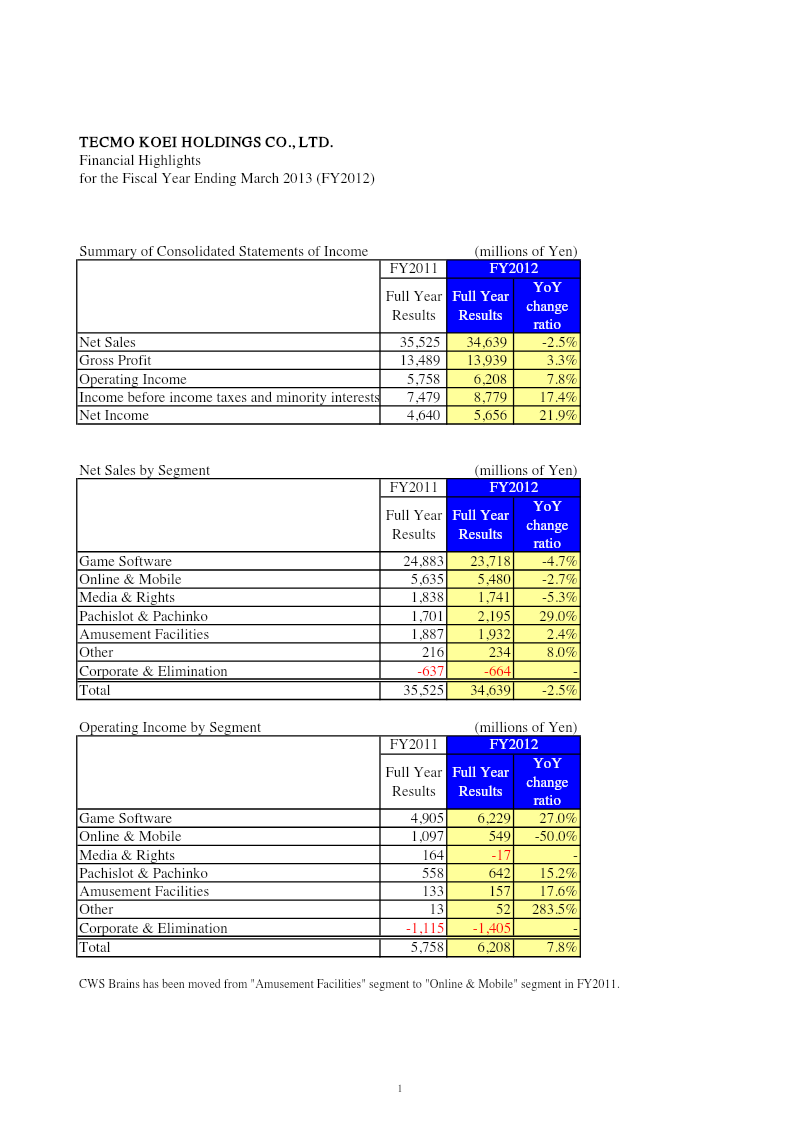
Net income grew by 21.9% to ¥5,656 million in FY2012, despite a 2.5% decline in total net sales to ¥34,639 million.
See it on page 1Operating income rose 7.8% to ¥6,208 million, bolstered by a 27% increase in Game Software operating income and a 15.2% rise from Pachislot & Pachinko, which offset a 50% collapse in Online & Mobile operating income.
See it on page 1Revenue performance was mixed across segments, with Pachislot & Pachinko sales jumping 29% to ¥2,195 million, while Game Software sales fell 4.7% and Online & Mobile revenue dropped 2.7%.
See it on page 1The company’s balance sheet strengthened significantly, with total assets increasing from ¥54,909 million to ¥63,594 million, driven by substantial growth in cash, time deposits, and investment securities.
See it on page 2Income before taxes saw a notable 17.4% increase to ¥8,779 million, contributing to an overall rise in shareholders' equity from ¥77,934 million to ¥82,392 million.
See it on page 2Current liabilities increased from ¥9,220 million to ¥12,303 million as of March 31, 2013, primarily due to higher trade payables and income taxes payable.
See it on page 2Financial highlights for the fiscal year ending March 2013 (FY2012) show a modest decline in net sales of 2.5 % to ¥34,639 million, driven mainly by a 4.7 % drop in Game Software sales and a 2.7 % fall in Online & Mobile revenue. Gross profit, however, increased by 3.3 % to ¥13,939 million, reflecting higher operating income of 7.8 % (¥6,208 million) and a 17.4 % rise in income before taxes to ¥8,779 million. Net income grew 21.9 % to ¥5,656 million, supported by a 27 % jump in Game Software operating income and a 15.2 % increase from Pachislot & Pachinko, offset by a 50 % decline in Online & Mobile operating income.
Segment performance varied: Pachislot & Pachinko sales rose 29 % to ¥2,195 million; Amusement Facilities grew 2.4 %; Other segments saw an 8 % rise, while Media & Rights fell 5.3 %. The company’s balance sheet expanded, with total assets rising from ¥54,909 million to ¥63,594 million, largely due to a jump in cash and time deposits (¥6,742 → 13,851 million) and investment securities (¥33,752 → 45,339 million). Current liabilities increased from ¥9,220 million to ¥12,303 million, driven by higher trade payables and income taxes payable. Shareholders’ equity grew from ¥77,934 million to ¥82,392 million, supported by retained earnings and capital surplus gains.
The report covers Japan‑based operations for FY2012, with data presented in millions of yen. It relies on consolidated financial statements prepared under Japanese GAAP, reflecting a full year’s performance and balance sheet as of March 31, 2013.