ReportKoei Tecmo
Financial Highlights: 3rd Quarter of the Fiscal Year Ending March 2013
2 pages~4 min full read
Key insights
7 takeaways · ~3 min read- 01
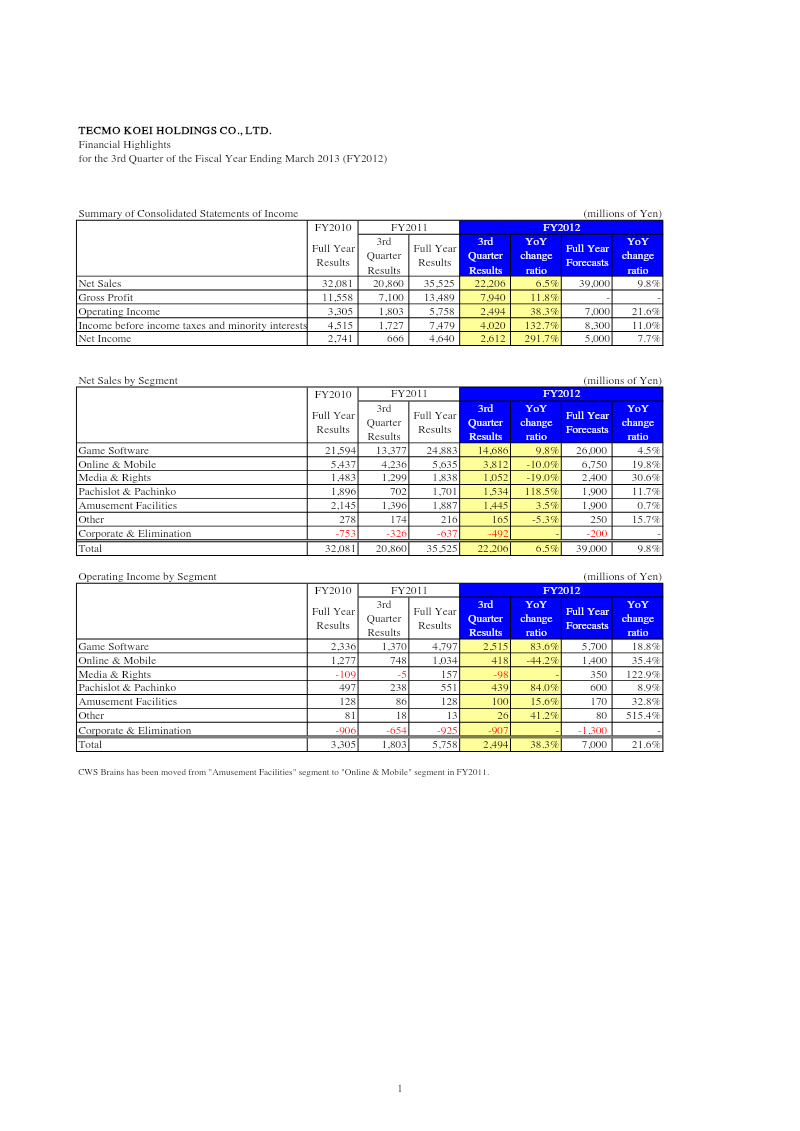
Tecmo Koei Holdings achieved a net income of ¥4,640 million for Q3 FY2012, representing a 291.7% increase over the prior year's ¥666 million.
See it on page 1 - 02
The Game Software segment was the primary driver of growth, with operating income surging 83.6% year-on-year to ¥4,797 million.
See it on page 1 - 03
Total net sales rose 6.5% to ¥35,525 million, while overall operating income climbed 38.3% to ¥5,758 million.
See it on page 1 - 04
The Online & Mobile segment saw sales increase to ¥5,635 million, but operating income dropped 44.2% to ¥1,034 million due to rising marketing expenditures.
See it on page 1 - 05
Media & Rights returned to profitability with an operating income of ¥157 million, a significant turnaround from the previous year's ¥109 million loss.
See it on page 1 - 06
Liquidity improved as current liabilities decreased from ¥9,220 million to ¥5,691 million, while shareholders' equity grew to ¥79,070 million.
See it on page 2 - 07
Pachislot & Pachinko and Amusement Facilities segments both posted gains, with operating incomes rising 84.0% to ¥551 million and 15.6% to ¥128 million, respectively.
See it on page 1


