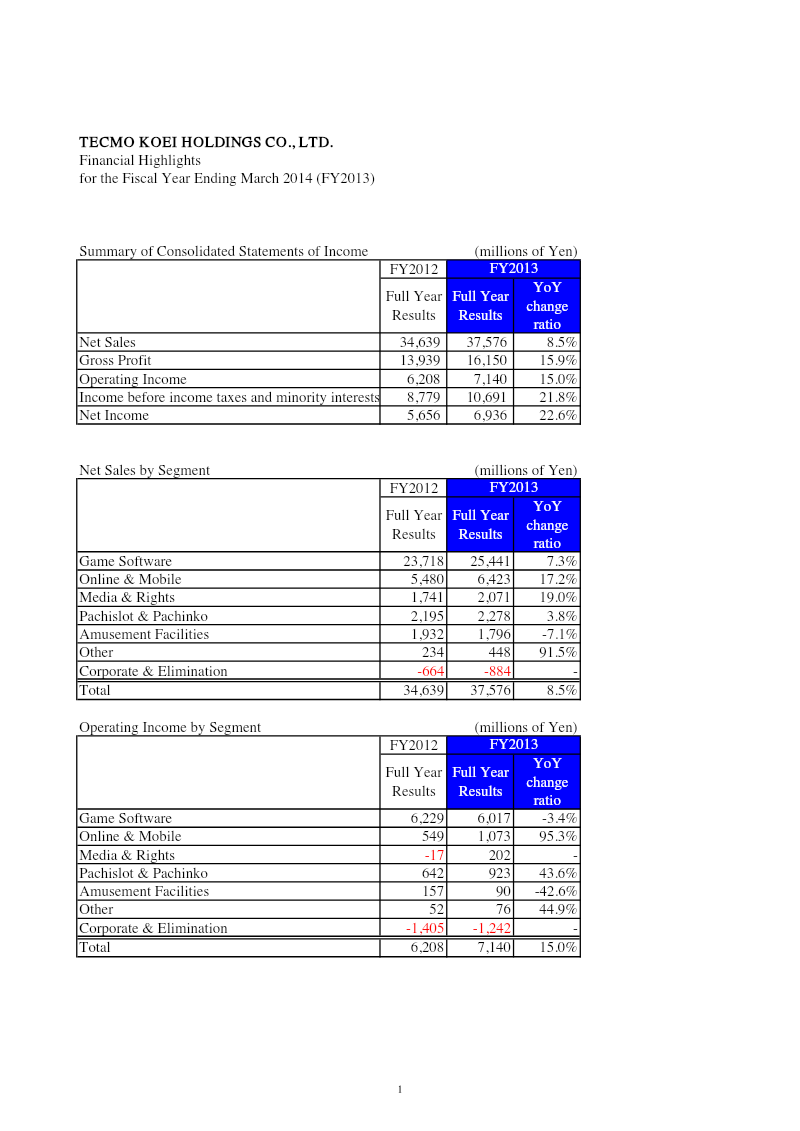
Tecmo Koei Holdings achieved a 22.6% increase in net income to ¥6,936 million for FY2013, supported by a 15.0% rise in operating income to ¥7,140 million.
See it on page 1The Online & Mobile segment was a primary growth driver, recording a 17.2% revenue increase and a 95.3% surge in operating profit.
See it on page 1Consolidated net sales grew 8.5% to ¥37,576 million, bolstered by a 7.3% increase in Game Software sales and 19% growth in Media & Rights.
See it on page 1Operational efficiency improved as the gross profit margin expanded from 40.2% in FY2012 to 43.0% in FY2013.
See it on page 1Income before taxes rose 21.8% to ¥10,691 million, reflecting strong overall profitability across the company's segments.
See it on page 1Total assets grew 5.9% to ¥100,622 million, while shareholders' equity increased 5.4% to ¥86,535 million by the end of the fiscal year.
See it on page 2Despite a 19% decline in current assets due to reduced cash and marketable securities, the company maintained robust liquidity with current assets exceeding current liabilities.
See it on page 2Financial highlights for the fiscal year ending March 2014 demonstrate a solid growth trajectory for Tecmo Koei Holdings. Net sales increased by 8.5 % to ¥37,576 million, driven primarily by a 7.3 % rise in Game Software sales and a notable 17.2 % jump in Online & Mobile revenue, while Media & Rights grew 19 %. Operating income expanded 15.0 % to ¥7,140 million; the Online & Mobile segment alone contributed a 95.3 % surge in operating profit, offsetting modest declines in Game Software and Amusement Facilities.
Profitability metrics improved markedly: income before taxes rose 21.8 % to ¥10,691 million and net income climbed 22.6 % to ¥6,936 million. Gross profit margin widened from 40.2 % in FY2012 to 43.0 % in FY2013, reflecting efficient cost management across segments.
Balance‑sheet strength is evident. Total assets grew 5.9 % to ¥100,622 million, largely due to a jump in investment securities and property & equipment. Current assets fell 19 % as cash and marketable securities were reduced, yet liquidity remained robust with current assets still exceeding current liabilities. Shareholders’ equity increased 5.4 % to ¥86,535 million, supported by retained earnings growth and a modest reduction in treasury stock.
The data cover the Japanese market for FY2013, with segmental performance broken down by product lines. Figures are presented in millions of yen and reflect consolidated financial statements, providing a comprehensive view of the company’s operational and financial health during the period.