ReportKoei Tecmo
Financial Highlights: 3rd Quarter of the Fiscal Year Ending March 2016
2 pages~4 min full read
Key insights
7 takeaways · ~3 min read- 01
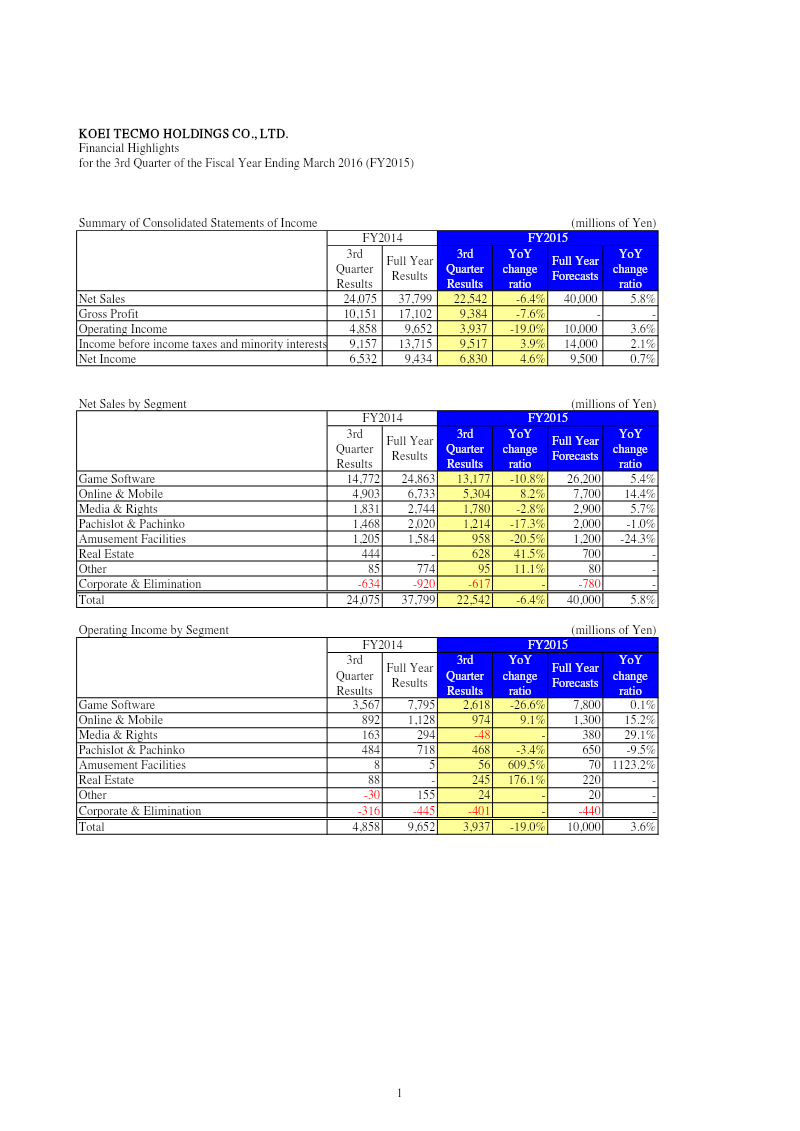
Koei Tecmo reported net sales of ¥37.8 billion for Q3 FY2015, a 6.4% year-over-year increase that exceeded the company's ¥40 billion forecast by 5.8%.
See it on page 1 - 02
Operating income rose 19% year-over-year to ¥9.65 billion, though this result fell 3.6% short of the ¥10 billion target.
See it on page 1 - 03
Net income reached ¥9.43 billion, representing a 4.6% year-over-year increase but missing the ¥9.5 billion forecast.
See it on page 1 - 04
The Game Software segment, the company's primary revenue driver, generated ¥24.86 billion in sales, marking a 10.8% decline from the previous year.
See it on page 1 - 05
Online & Mobile sales grew by 8.2% to ¥6.73 billion, outperforming the segment's forecast by 14.4%.
See it on page 1 - 06
Total assets decreased to ¥104.5 billion from ¥115.2 billion a year prior, while current liabilities were halved to ¥5.38 billion, reflecting a significant tightening of the balance sheet.
See it on page 2 - 07
Real Estate sales saw the highest growth rate among all segments, rising 41.5% year-over-year to ¥628 million.
See it on page 1


